Epilogue: Speculations and Skepticism
Here in the last chapter of our textbook, we ask you to consider all that you have learned about the scientific investigations seeking to discover life beyond the Earth. So far, we have not been successful in discovering such life, but hopefully in the near future we will find some evidence. In the meantime, a large contingent of people have argued that they know that life forms from beyond the Earth exist and that they have actually visited us. Some of these people have been prominent individuals with a lot of resources at their disposal to make their claims seem exciting and more convincing than they actually may be. However, these claims have not stood up to close scrutiny. There are very few claims that have made it past any sort of peer review, and those few peer reviewed papers which have made bold claims to have discovered evidence for life beyond the Earth have ended up criticized, contradicted, and, in some cases, retracted from publication by the rest of the community. Nevertheless, the popular media continues to promote many of these ideas that there are not accepted by the scientific community. In this chapter, we will explore these ideas, try to decide how to distinguish science from pseudoscience.
Learning Objectives
By the end of this chapter, you will be able to:
- Critically assess claims made in various locations, especially in the popular media, by use of Carl Sagan’s baloney detection kit.
- Explain various natural phenomena, human technologies, hoaxes, and delusions that have been called “UFOs”.
- Discuss how some beliefs, especially those related to religion and spirituality, form part of some people’s arguments that life beyond the Earth exists and interacts with us.
Since we have yet to find scientific evidence for life outside of the Earth, much of the study of astrobiology is necessarily speculative. Perhaps because of this, there has been and continues to be a tendency for people to believe that evidence does exist for life from beyond Earth interacting with us.
This tendency can be seen in the mythologies associated with the skies across many human cultures. Intelligence and life was assumed to be part of the celestial world, with gods, monsters, and the spirits of once-living terrestrial creatures complete with agency and personalities that could interact with humanity. Constellations, planets, and stars were the first “extraterrestrial life forms” that human beings assumed existed.
With an adoption of scientific perspectives on how the natural world operates, such enchantment of the natural world was eschewed. The planets, stars, and other phenomena we observe with our telescopes has up to now exhibited no signs of magic, intelligence, or life. However, a somewhat large contingent of humanity takes issue with this lack of evidence and proposes, contrariwise, that there is in fact ample evidence for such. This chapter aims to examine some of these claims in some detail.
Before proceeding much further, however, the evidence that will be considered in this chapter will be, in most cases, rejected as problematic, incomplete, or even completely incorrect. How does anyone decide this is the case? Ultimately, you have to use your own judgment to weigh evidence, and this includes the scientific evidence that has thus far been presented in this book.
Skepticism
One possible approach to evaluating claims is that of skepticism. Skeptics, as those who adhere to this position are called, adopt a set of standards for evidence used to hopefully distinguish fact from fantasy. The nature of this position is, however, that there will be people who disagree with the skeptical perspective. If one person argues that a phenomenon exists, the skeptical position is to propose that unless there is convincing and verifiable evidence that can be measured, the phenomenon is assumed not to exist. This type of assumption is called the null hypothesis.
What standards of evidence would be enough to have a skeptic reject the null hypothesis? There is no firm demarcation, and this is likely why there is often controversy surrounding these subjects especially within the popular, philosophical, and sociological discourse. Nevertheless, surveys of experts and scientists tend to show remarkable agreement as to the lack of evidence for a lot of the ideas we will be discussing, according to some general principles of “skepticism” including a famous dictum often attributed to the late Carl Sagan, “Extraordinary claims require extraordinary evidence”. What follows is one possible set of criteria that attempt to offer a means to determine which claims are supported by evidence provided by the late Carl Sagan.
Baloney Detector Kit
In his 1991 book, Demon-Haunted World, Sagan attempts to provide his readers with a set of tools that can be used to indicate concern with certain arguments. These tools are not meant to be foolproof methods to determine with absolute certainty whether a claim is true or false, but the hope is as one starts to evaluate more and more claims, the “Baloney Detector Kit” will work to help steer the user in the direction of being able to identify which claims are worthy of more careful consideration and which can be dismissed more quickly. Entertaining every claim is an exhausting endeavor, and with limited time such techniques can be used to move on to more productive avenues of investigation. Sagan writes that the tools in this kit are the following principles, quoted here in full:
- Wherever possible there must be independent confirmation of the “facts.”
- Encourage substantive debate on the evidence by knowledgeable proponents of all points of view.
- Arguments from authority carry little weight — “authorities” have made mistakes in the past. They will do so again in the future. Perhaps a better way to say it is that in science there are no authorities; at most, there are experts.
- Spin more than one hypothesis. If there’s something to be explained, think of all the different ways in which it could be explained. Then think of tests by which you might systematically disprove each of the alternatives. What survives, the hypothesis that resists disproof in this Darwinian selection among “multiple working hypotheses,” has a much better chance of being the right answer than if you had simply run with the first idea that caught your fancy.
- Try not to get overly attached to a hypothesis just because it’s yours. It’s only a way station in the pursuit of knowledge. Ask yourself why you like the idea. Compare it fairly with the alternatives. See if you can find reasons for rejecting it. If you don’t, others will.
- Quantify. If whatever it is you’re explaining has some measure, some numerical quantity attached to it, you’ll be much better able to discriminate among competing hypotheses. What is vague and qualitative is open to many explanations. Of course there are truths to be sought in the many qualitative issues we are obliged to confront, but finding them is more challenging.
- If there’s a chain of argument, every link in the chain must work (including the premise) — not just most of them.
- Occam’s Razor. This convenient rule-of-thumb urges us when faced with two hypotheses that explain the data equally well to choose the simpler.
- Always ask whether the hypothesis can be, at least in principle, falsified. Propositions that are untestable, unfalsifiable are not worth much. Consider the grand idea that our Universe and everything in it is just an elementary particle — an electron, say — in a much bigger Cosmos. But if we can never acquire information from outside our Universe, is not the idea incapable of disproof? You must be able to check assertions out. Inveterate skeptics must be given the chance to follow your reasoning, to duplicate your experiments and see if they get the same result.
In the discussions that follow, try to see where these tools can be applied to the evidence that is provided. It is important to understand that these tools do not say “yes” or “no” in answer to the question, “Is this claimed phenomenon real or not?” The hope is rather to provide enough tools so that the merits of the claims can be evaluated and the reader can make up her or his own mind.
Unidentified Flying Objects
One of the first subjects that students are interested in exploring is the question of whether spacecraft from other intelligent groups are visiting Earth. An extensive catalog of stories attempting to demonstrate evidence for this has been assembled by various investigators often termed “ufologists” as a way of identifying that they study “UFOs”. The term “UFO” Is an acronym that was coined by Air Force Captain Edward J. Ruppelt in the 1950s to stand for the words “unidentified flying object”. At the time, this was intended to be a neutral indicator of the reports: most people who believe they have seen a UFO report that it is flying in the sky, that it is a physical object that can be seen or tracked by, for example, radar, and that the observer does not know what the object is making it “unidentified”. Over the decades, the term has become so closely associated with the claim that there are extraterrestrial intelligent beings visiting the Earth, that now many associate UFO with “alien spacecraft”.
The official investigations of UFOs first happened in a coordinated fashion after World War II. At the time, there was heightened interest in threats from flying objects of human origin. During the Second World War, aerial technology advanced quickly to jet-propelled aircraft and rocket artillery and in the United States a Civil Air Defense Corps was inaugurated to monitor the skies for incoming enemy threats. The culture of reporting unusual aerial phenomena to the authorities was well-established by the time UFO investigations sponsored by the United States Air Force first began.
Under a variety of monickers, after assembling a team of investigators, the US Air Force undertook a number of projects to investigate the reports and determine whether they could be explained or whether they constituted a threat to the national security of the United States. Over the course of nearly a decade, a number of reports came back indicating consistently that some sightings could be identified as being caused by known phenomena and the ones that could not be explained did not rise to a level such that they could conclusively point to any new phenomena beyond the prosaic explanations that identified the other sightings. Since there was nothing conclusive that could be ascertained from the reports the investigations were ended so as to avoid prolonging a wild goose chase.
Since that time, formal studies of UFOs have been only intermittently conducted by governments and the scientific community has all but ignored such ideas. Ongoing claims that evidence for UFOs exist continue to be made, but so far there has not been the acceptance that these extraordinary claims have generated any extraordinary evidence.

Popular interest in UFOs continues in part due to such stories featuring in entertainment and in journalism. H.G. Wells in 1897 wrote War of the Worlds which presented a scenario of intelligent lifeforms from Mars invading the Earth. Likely, Wells was influenced by the recently published book by Percival Lowell entitled, Mars where, erroneously, Lowell reported on the observations of Giovanni Schiparelli and others who argued that there was a network of canals that could be seen on the planet. This inspired considerable speculation that there could be flowing water and life on Mars, but later work revealed that these observations were entirely spurious.
At around the same time, humanity began experimenting with flight starting with airships that used hydrogen gas to achieve the necessary lift. A number of mystery airships were reported in the media with a few newspaper reporters uncritically claiming that they were made by lifeforms from other worlds who had used them to travel to Earth.
Reports of UFOs began to proliferate after a media sensation surrounding the claims of a pilot named Kenneth Arnold who in 1947 who reported seeing nine aircraft that appeared to him to move in a way that was far different than any aircraft he had seen until that point. He argued that such objects appeared to be moving like “saucers skipping across a pond” and the term “flying saucer” was soon attached to the unknown objects. On the basis of his personal observations, Arnold was convinced that aircraft were visiting Earth and were developed by an advanced extra-terrestrial intelligent beings. He consistently argued this for the rest of his life.
Not long after this, the now famous Roswell Incident occurred where a New Mexico rancher saw a balloon crash into a field and wreckage was recovered. The local news story complete with photographs and a visit by the officials from the Army Air Force who removed the physical evidence and eventually explained the event as a weather balloon crash although it was actually a nuclear testing monitoring balloon. The event might have disappeared into obscurity, but interest was revived in the late 1970s through the 1990s when a number of claimants began to argue that there had been recovery of extraterrestrial artifacts including lifeforms. The culmination of this sensation was the production of a so-called “Alien Autopsy” video which was broadcast nationally in 1995 and claimed at the time to be authentic footage, though the filmmaker years later would clarify that it was a reproduction of what he claimed to remember.

Identifying UFOs
Claims of visitations by intelligent lifeforms from beyond the Earth continue to be made in news stories, science fiction, and popular media. The very identification of a sighting of an “unidentified” object makes attribution difficult. The null hypothesis is that such observations have prosaic explanations and such explanations fall into four categories: natural phenomena, human technology, delusions, and hoaxes.
Natural Phenomena
A number of natural phenomena have confused observers into believing they were due to fantastical technology or the supernatural owing to peculiar characteristics, circumstances, or simply not knowing how the phenomena appears in nature.
A number of astronomical objects have been reported as “flying” in ways that observes thought looked like they were piloted by intelligent lifeforms, but this is not the case. Famously, the planet Venus is often puzzling for those who are unaware that it is the third brightest natural object in the sky and can rival the brightness of plane landing lights. In dark sites when there is no moon, Venus is bright enough to cast shadows. As a planet, it is also not a point source and can therefore be distinguished from stars because it exhibits less twinkling than stars exhibit as the random fluctuations in the atmosphere that cause twinkling stars are washed out over the larger apparent size of the planet. Venus is never far from the horizon, giving it the appearance of flying closer to the ground. When it is in the evening sky, Venus sets at approximately the rate of the Sun which makes it appear to be moving through the sky or perhaps landing at some distance. When Venus is very low in the sky, the same atmospheric refraction that causes sunsets can affect the color of Venus on short timescales, making it appear to be flashing different colored lights.
Some transient astronomical phenomena include meteors or bolides which appear as bright streaks and, in some instances, smoke trails in the sky. These are the visible signs that a rocky body from space has entered the Earth’s atmosphere on a collision course. Shooting stars can be seen almost any night, but some points during the year there are many more of them in so-called “meteor showers” at a point in the Earth’s orbit where it passes through the debris field of a comet. The largest fireballs are unusual, but can be extremely bright and happen high enough in the atmosphere to be visible for hundreds of kilometers. Occasionally, these meteors are large enough to cause damage when they hit the ground as meteorites or propagate shockwaves and sonic booms if they explode in the atmosphere.
Birds are, of course, flying objects and while most people think they can readily identify birds, some birds are large enough to confuse the perspective of the observer. One suggestion that has been made to explain Kenneth Arnold’s sighting was that he was observing a flock of pelicans. These large birds can fly fairly high and if they are not identified as birds, it is possible to misjudge their size. Arnold proposed that the objects he saw were the size of aircraft and that they moved very quickly. Pelicans are approximately the size of a small human and if they are mistaken for larger objects, the person seeing them may believe that they are farther away than they actually are as a large object can have the same angular size as a small object when it is at a further distance. What is more, a closer object will appear to move across the field of view at a faster rate than one that is further away, so it has been suggested that Arnold’s estimate of the speed of the objects could have been misjudged as being much faster if he assumed the objects were further away than they were.

Another instance of a possible bird sighting was the so-called “Flatwoods Monster” which was a reported contact with what the observers thought was an extraterrestrial lifeform. The night of the incident was the same night that a meteor was observed, and the people who reported seeing the Flatwoods Monster went to investigate the meteor crash in the local forest. When they happened upon the location where the meteorite hit, they reported seeing a human-like figure that scared them. A sketch artist’s impression of what they saw was mocked up, and a comparison of the drawing to what a barn owl on the top of a moderately-sized tree or stump has been suggested as an intriguing correlation.
A few other usual natural phenomena have been identified in connection to UFO reports. Will-o-the-wisp are claims of glowing lights typically seen in marshy or swampy areas that have identified as sometimes being due to the igniting of combustable methane gas. St. Elmo’s Fire has been described since antiquity but has only recently been identified as electrical discharge that can occur in certain situations where there is substantial charging in the atmosphere as what might happen before a thunderstorm.

Finally, cloud formations have been misidentified, especially lenticular clouds. These clouds are formed under very particular atmospheric conditions and look superficially like the stereotypical “Flying Saucer” spacecraft often claimed in UFO reports. When such clouds appear in the evening or morning, they can reflect and refract light from the sun on the horizon taking on unusual coloring and mimicking flashing lights.
Human Technology
Many comparisons to UFOs are directly to human technology either as the airships of the late nineteenth and early twentieth centuries through to jet aircraft and rocket ships today. Even so, rocket launches are unusual enough that when they happen and an unsuspecting observer happens to be looking in the direction of a launch, they can be led to believe that they are witnessing something otherworldly. An example of this is the 2009 Norwegian Spiral Anomaly which formed a dramatic blue spiral visible from many parts of Norway one evening. It was identified as a failed rocket launch from Russia, but the unusualness of contrails and exhaust that come from the launch are such some classify it as a member of a class of “Space Jellyfish”.
Once in orbit, satellites can appear in ways that are very unusual in comparison to planes. Low Earth orbit implies a satellite that passes directly overhead will cross from horizon to horizon in 45 minutes, but most of that time will be spent near the horizon. As it passes overhead, it moves at a considerable clip crossing the distance of five full moons in one second. Such satellites reflect the light of the Sun and so can mostly be seen near sunrise or sunset. Low-Earth orbiting satellites pass either into or out of the shadow of the Earth appearing to appear or reappear suddenly, and if the architecture of the satellite is favorable, this can lead to satellites appearing to “flare” as they point a flat reflective surface towards the unsuspecting observer.
Perhaps one of the most famous UFO-related human technology observed are balloons. While most people have experience with party balloons, there are extremely large balloons used for scientific and military purposes which look nothing like those at a party. These high-altitude balloons do not fully inflate until they reach the height of the stratosphere past 15 km or so. Once at these heights, the balloons inflate to the size of a small building and in the early evening when they are typically launched will reflect the setting sun as they travel quickly through the action of the jet stream. West Texas and New Mexico are the launching point for much of the scientific ballooning done in the US and often reports of UFOs to the local media increase during the launch season.
In the last few decades, robotic drone flyers have become another source for confusion by people seeing unexplained things in the sky. Drones used for classified missions have confounded pilots as the size of the drones and therefore their distances are difficult to ascertain. Drones may also be subject to radar detection, but in the case of military uses, stealth technology can be employed to hide or confuse the radar signal so that distances and speeds cannot be accurately ascertained. A number of the latest UFO sightings breathlessly reported in even reputable media have been attributed to drones by skeptics. Commercially available drones are also one of the most common ways to create a UFO hoax.
Delusions
A certain number of UFO sightings are due to delusions, but it is important to realize that anyone can suffer from delusions. The accusation that someone is delusional is often a tool of derision, but intelligent, capable and otherwise competent human beings are suspect to any number of effects that can cause them to believe they have perceived something that they have not perceived. A common example of this is the so-called “Misinformation Effect” where memories can be distorted and inaccurately recalled due to the introduction of misleading information or suggestions. Indeed, suggestibility is a psychological phenomenon that is offered to explain how hypnosis functions. Studies of such effects have cast doubt on the reliability of eyewitness testimony in courts, and in instances where testimony is the only evidence for an observation of a UFO, such effects may be cause for concern. Unfortunately, those who offer eyewitness testimony are often completely unaware that their memory has been distorted and instead take umbrage at the suggestion that they are mistaken, but such concerns are not intended to cast those offering their testimony as liars. Instead, it is an effect to keep in mind as a possible explanation for a testimony that was intended to be offered truthfully.
In some instances, these sorts of misremembered events can be the result of trauma. An instance of this seems to be indicated in the community of abductees who claim with varying degrees of detail and intensity, that they have not only been visited by lifeforms from beyond Earth, but that these lifeforms have captured and, in some cases, tortured them. Some accounts follow patterns that have been identified by psychologists as similar to a condition known as sleep paralysis where a certain somnambulatory state between dreaming and waking happens when a person is aware of what is happening but is unable to physically move.

The first claimed abduction is worth recounting due to the iconic nature of its occurrence. Barney and Betty Hill were an interracial married couple living in New Hampshire in 1961 at a time when interracial marriages were uncommon and actually illegal in many parts of the United States. During a drive home, they saw a UFO, followed it in their car, left the vehicle to investigate, and then became very frightened of what danger it could pose. They reported a strange loss of time upon their arrival back home. For some days afterwards, they were haunted by the trauma of the event and Betty had reported troubling dreams. At the time, UFO stories were still being investigated by national authorities, and the stories often ended up reported in the press uncritically. Also at the time, hypnosis was being actively used in a way we now know is problematic: to help people recall so-called “repressed memories”. Unfortunately, it has been convincingly documented that encouraging people to participate in an activity where they are subject to suggestibility as in a hypnosis session is a way to plant false memories. Nevertheless, through hypnotic sessions that began some years after the incident, Barney and Betty Hill began to describe more remembered features of their encounter including an abduction by what they described as extraterrestrials who took them to their spacecraft and examined them. Betty Hill outlived her husband by decades and continued to produce more and more claims about her contact with the extraterrestrial lifeforms including describing the aliens as the now familiar “gray alien”, and eventually determining that they came from a planet orbiting the star Zeta Reticuli. An entire community of people believe that “Zetans” are the intelligent extraterrestrials visiting Earth largely based on Betty Hill’s prolific accounts that are stored in the archives of the University of New Hampshire library.
Delusions do not only happen to individuals. There are instances of so-called “mass delusions” where multiple independent people or groups of people become convinced of events or phenomena which simply do not exist. One example of this that predates the UFO phenomenon were reports of the Edison Star in March and April of 1897. At this time, there was concern across the United States that Thomas Edison was producing an artificial star to light up the night. Sightings of this star happened in many locations, but there was no such object to be seen. This event is very reminiscent of various “UFO waves” which occur in places from time to time. As media interest intensifies, more and more reports are made of people seeing unexplained objects flying in the sky to the point where the argument is offered, sometimes even explicitly, that if it had to be interactions with extraterrestrial lifeforms because otherwise there would not be so many sightings. After an increasing flurry of interest, the reports eventually come to an end as the attention of the media and society is moved towards other things.
Hoaxes
Since the claims began to proliferate, hoaxes have been promulgated. Faked photographs, video footage, and physical evidence have been used to claim “clear proof” and discoveries of hoaxes inevitably lead skeptics to question claims that come after this. One instance where a hoax was strongly suspected was the first photograph ever taken of a UFO from a farm near McMinnville, Oregon. The pair of pictures appear to show a flying saucer and the claim was that the pictures also indicate the UFO was moving from one part of the scene to the other. Suggestions that the photographs were faked were made almost from when they were first published, most explanations proposing that either an old motor, a hubcap, or a dinner plate was suspended by fishing line. The family never admitted that it was a hoax.
Perhaps the most famous hoax associated with ufology was that of crop circles. For years in the late 1980s and early 1990s, crops in south England were discovered mysteriously flattened in circular patterns that became increasingly elaborate. A craze of investigation happened that captured worldwide attention. Various phenomena were invoked as plausible explanations including claims by many who believed that UFOs were extraterrestrial spacecraft that the crop circles were related to the intelligent lifeforms. In spite of the media sensation, in 1991 two men admitted to producing most of the crop circles in England using fairly rudimentary devices. Even as they were able to demonstrate their production of crop circles, there still remained believers convinced that this was not the explanation some of whom still do not believe the phenomenon was a hoax. Crop circles continue to be produced by artists and other aficionados including one that famously paid homage to the Arecibo Message.
Conspiracy Theories
Even with the large number of prosaic explanations for claimed UFOs and the number of reports issued that concluded there was no strong evidence for UFOs indicating an interaction with life from beyond the Earth, there continue to be those who believe that some UFOs are not explainable by the four categories of identifications listed above. When faced with the question as to why government agencies and experts dismiss such arguments, there is sometimes a claim that there is a conspiracy among a large number of interested parties to conceal the truth of the matter. Stories as to how this has done often include hiding evidence at secret military installations such as the famous “Area 51” in the United States Air Force’s Nevada Test and Training Range where the promoters of the “Alien Autopsy” video claimed evidence was being hidden. There are declassified documents which indicate that the United States Armed Forces in part did not spend time refuting such claims in order to hide the true classified nature of some of these institutions (some of which were involved in the production of espionage technology, for example).
Whether these stories are promoted by people who know they are incorrect or whether they were promoted by people who truly believe in “alternative scenarios” is hard to determine. Suffice to say, these expansive narratives become increasingly complicated as the interested interlocutor continues to ask additional questions about the existence or lack of existence of evidence for such conspiracy theories. Inevitably, completely unrelated arguments end up incorporated. Arguments get made such as, “If NASA is lying about the existence of extraterrestrial lifeforms interacting with human beings, perhaps it is also lying about the shape of the Earth.” Aside from the fact that it is possible to perform some simple experiments yourself to discover that NASA is not lying about the shape of the Earth, the chain of argument becomes longer and longer and weaker and weaker as the explanations continue.
One particular conspiracy theory that has gained traction in the popular media is the proposal that not only are extraterrestrial lifeforms interacting with Earth, but that there is evidence that they have been doing so for millennia. The evidence for such “Ancient Aliens” is usually the large structures that humans built before the Industrial Era. The pyramids of Egypt and Central America, the megaliths of Europe and Asia, the now-abandoned cities of the past in the Eastern and Western Hemispheres are all cited as in certain television shows and popular books that there must have been contact with intelligent lifeforms possessing advanced technology to enable humanity to construct these impressive structures.
Archeologists and anthropologists have entire journals dedicated to explaining the way in which our predecessors constructed the large and complicated features of their societies. Not everything is completely understood, but there is ample evidence of the construction techniques, design knowledge, and abilities of the craftspeople from written records, artifacts, and even oral histories. The presumption by many of those arguing that human beings were incapable of achieving the incredible feats of the past is that because they do not understand how, for example, a pyramid could be built therefore no human being can. The people who built the pyramids beg to differ.
The allure of such arguments is that they excite the imaginations of many. In the modern world, science fiction and fantasy literature may hold functions similar to those that folktales and mythologies used to hold. That some people confuse these stories for factual accounts is not surprising, but as with any claim to truth, it is important to keep stock of the full range of possibilities and narrow on in explanations that are more likely to be correct while avoiding those that are more likely to be incorrect. Hopefully, the baloney detector kit can work.
An Enchanted Universe
The connection of these ideas to mechanisms that are unknown to scientific investigation inspires some people to delve into open questions which have been attempted to be answered through alternative philosophical and religious means. Examples include: Is there something special about life that requires explanations that our physical models will be unable to provide? Are there ways that we and other aspects of reality are influenced beyond the four forces of physics?
While open questions of this sort are, by definition, not answered, there are auxiliary proposals and ideas for which we can examine the evidence.
Astrology
The predictability of the motions of the heavens enabled early astronomers to become accurate timekeepers and calendar makers. This skill required observation and modeling as we currently enjoy, but there were extensions to such predictions that were abandoned by the scientific community in the eighteenth century. These included so-called “astrological” claims that the planets influenced human affairs and current events through personality-like influences. These claims continue to be made today with the influences argued as being due to personal characteristics that the planets and constellations were given. For example, Mars was considered a masculine god of war and Venus a feminine goddess of love. The position of these visible planets with respect to the Sun, Moon, and background stars was meant to influence daily life in individuals depending most strongly on where the Sun appeared to be when they were born, and less strongly on where the Moon and the rest of the planets were. As the Sun, Moon, and planets all orbit in a plane, the only constellations that they can be seen in are the twelve constellations that form the Zodiac or the Plane of the Ecliptic which indicates the orientation of the plane of our Solar System with respect to the Earth (if there were no tilt to our axis, the Plane of the Ecliptic would align with the Celestial Equator).

The idea that the position of the planets with respect to stars influences human behavior or future outcomes generally was (and, by contemporary believers in astrologers, continues to be) attributed to the same mysterious forces which kept the planets moving in their courses. However, with the advent of both the heliocentric model for the solar system and our modern theory of gravity, it became possible to explain the motion of the planets and precisely calculate the strength of the forces that planets exert. The scientific explanations for the motions of the planets often recast the stories of astrology in a different light. For example, retrograde motion of the planets still worries people, many of whom do not know what retrograde motion is. At various points along the synodic period of a planet (the time it takes for a planet to return to the same position in the sky), a planet will appear to stop moving in the normal direction it wanders across the constellations of the Zodiac. At that point it will turn apparently make an abrupt change of course and move in the opposite direction before stopping again and returning to its previous path. This retrograde motion is said by astrologers to indicate a disorienting or disordered characteristic to the planets’ motion (recall that planets were once considered imbued with consciousness as deities or spirits), but in fact it is the result of the Earth moving around the Sun. The analogy can be drawn to cars passing each other on a roadway while traveling in the same direction. For most of the journey, the cars will appear to move in the same direction, but at certain points one car will pass another causing the appearance of the cars moving in different directions. Retrograde motion occurs as the Earth passes the planets that are farther away than the Sun or as the planets that are closer to the Sun swing in their orbit to the opposite side of the Sun and appear to move in a different direction for a time. If you believe the Earth is the center of the Solar System, such motion is strange and puzzling and famously needed to be explained using a complicated system of epicycles which allowed a planet to move backwards at certain points in its motion. With the heliocentric Solar System, the explanation becomes as simple as explaining relative motion.
Our advancing understanding of the motions of the celestial sphere also mean that the claims of many so-called “classical” astrologers are based on calculations that place the planets in different places in the sky than they actually are. The Earth’s axis precesses every 26,000 years which means that the Celestial Poles point in slightly different directions with respect to the background stars year by year. This motion was unknown to ancient astronomers because it requires either a significant baseline of observations before the shifts are seeable without advanced technology. But it has been long enough since the invention of astrology that most people’s “Star Signs” are no longer the constellation that the Sun was in when they were born.
Finally, there is a question of mechanism when it comes to astrology. Some astrologers were probably encouraged by the fact that Isaac Newton’s explanation for gravity required the planets to exert gravitational pulls on human beings. However, the force exerted is minuscule compared to other forces we encounter in our day-to-day lives. The planet Jupiter exerts less of a gravitational influence on you than the gravity from a nearby human being; it is essentially too small to measure. As for the other forces known to physics (electromagnetism, the strong force, and the weak force), their influences are even smaller.
Thus, in order for astrology to work there would have to be some unknown fifth force originating from the planets, influencing humanity, and following the traditional stories that were told to explain motion of the planets that we now explain through celestial mechanics. Such a force should be measurable, but it does not appear in any of the tests that physicists make to look for such fifth forces. The conclusion that most physicists arrive at, then, is that astrological claims cannot attributable to actual physical influences.
At this point, some believers in astrology appeal to spirituality to argue that the influences cannot be measured. There are profound philosophical implications to believing in the existence of things that cannot be measured, well beyond the scope of this text. By definition, there is no test that can be done to either substantiate or debunk the existence of immeasurable things. We have left the purview of science and have entered into a space of ideas that is more properly contained within metaphysics or religion.
Spirituality and Religion
Some religions make claims directly relevant to the questions this book is seeking to explore. For example, there are those who have a religious belief that there cannot possibly be intelligent life in the Universe other than humanity. Others not only believe in such life, but make claims to know what the life is and how it operates. Some modern religions even incorporate UFOs as part of their belief systems.
Other religious believers question fundamental results of scientific investigation. However, most mainstream religions do not see any necessary conflict between scientific investigations, the facts discovered by science, and the religious beliefs. There may be outstanding queries and disagreements as to what is possible or impossible in such discussions of religion and science, but generally there is an ongoing demarcation that is maintained between religion and science that is only breached in certain philosophical fora. Students are often intrigued by this (lack of) interaction, but because the approaches to explaining the world are very different between a religious perspective and a scientific perspective, it is typically difficult to isolate even what the topics up for discussion should be. Open questions in science are sometimes left to religions to answer. Whether they provide reasonable answers or not is largely a question of faith.
Key Concepts and Summary
Without a second example of life elsewhere, the field of astrobiology is speculative. This offers an excellent opportunity to develop critical thinking, skepticism, and logic as thinking habits. It is human nature to want to succeed. It is scientific nature to be skeptical and demand empirical evidence before jumping to conclusions and the scientists working on SETI and the search for life employ these best practices in their work. They will be the first to say there is no evidence that UFOs are alien spacecraft or to identify hoaxes met to deceive. These practices may be the most important thing you can take away from your study of astrobiology.
Two key classes of chemicals have been seen to operate in all known living things on Earth: amino acids and nucleic acids. Amino acids are the fundamental building blocks of proteins, which are essential for most biological processes. Nucleic acids make up the genetic code of all living things on Earth, providing the molecular basis for evolution. Once life formed on Earth, over time it became more complex...eventually leading to humans capable of pondering their own existence. All life on Earth descends from the very first instance of life. Natural selection drove species to form and adapt to new environments and ecological niches. The rise of oxygen in the atmosphere about 2.5 billion years ago caused a proliferation of new life forms that had more efficient metabolic pathways. We will look at some of the milestones in the formation of more complex life throughout Earth's 4.5 billion year history.
Learning Objectives
By the end of this chapter, you will be able to:
- Explain the structure of amino acids and proteins
- Discuss the importance of proteins for the functioning of life
- Describe the basic features of DNA and RNA and their components
- Discuss the role of an organism's genetic code and the impact of genetic mutations
- Describe the three different domains of the tree of life
- Explain the difference between prokaryotes and eukaryotes
- Explain how endosymbiosis leads to more complex cells
- Describe how cyanobacteria increased the amount of oxygen in the Earth’s early atmosphere
- Explain how aerobic respiration is more efficient than anaerobic respiration
Amino Acids to Proteins
Amino acids and the proteins they combine to form are found in every living organism on Earth. Proteins are needed to make critical biological reactions happen on timescales relevant to life. Proteins regulate the processes that drive life. Though proteins are found across all living things and carry out a wide variety of roles, every protein on Earth is made up of only twenty different amino acids.
Amino Acids
Amino acids are molecules that are defined by a specific structure; all amino acids consist of a central carbon atom forming four bonds to: (1) a hydrogen atom, (2) an amino group (-NH2), (3) a carboxyl group (-COOH), and (4) a changeable side chain (see Figure 1 below). In organic chemistry, molecules with a carboxyl group are called carboxylic acids. This along with the amino group gives these compounds the name amino acid.

The amino and carboxyl groups allow amino acids to bond to one another through a process of dehydration, i.e. a process that releases water (H2O). Figure 2 below diagrams the reaction with structural formulas. Water is formed by the loss of an -OH group and a hydrogen (H) atom.
This process forms a new bond, called a peptide bond, between the carbon and nitrogen atoms. Chains of amino acids are joined by peptide bonds; these chains are therefore also called polypeptide chains. Figure 3 shows an example of a polypeptide chain. Polypeptide chains are then folded into proteins. Note that Figure 3 uses a mixture of a structural and molecular formula; specifically, not all bonds to Hydrogen atoms are shown with a line.


The side chains give each amino acid a unique functionality. Examples of amino acids and their side chains are shown in Figure 3 in green. Amino acids can be positively or negatively charged, water-repellent, bulky, bent into different configurations, or have other properties depending on their side chains. These differences help the polypeptides fold as they form proteins, bind to specific compounds, or chemically react in different ways.
Despite the fact that more than 500 amino acids exist on Earth, living things on Earth incorporate only 20 different amino acids to form the vast array of proteins that are used to regulate chemical reactions in all aspects of life. This is similar in spirit to the concept that even though the English languages only uses 26 letters, those same letters make up the words that compose millions of books.
Want to know more: Essential Amino Acids, Body Building, and You
Of the 20 amino acids used by life on Earth, the human body is capable of synthesizing all but nine. These nine amino acids are known as the essential amino acids. It is important to include sources of these amino acids either from meat or plants in a healthy diet since the body has no other source for them.
In fact, many products sell amino acids as supplements targeted towards endurance athletes and body builders. Scientists have been able to trace different amino acids and the role they play in muscle contraction or recovery to identify what the body needs after the coach has said "last set'" for the third set in a row. For example, glutamine is drained during intense physical activity. If the body's glutamine stores become depleted, the body begins to break down muscle cells to compensate.
Proteins
It is commonly said that you are what you eat, but perhaps more correctly, you are what your proteins decide to do. Proteins are the driving force behind the processes of life. Many proteins act as enzymes, which are highly specified molecules that allow complicated organic reactions to progress more easily.
In most organic reactions, the molecules involved must first assume an unfavorable, intermediate configuration (see Figure 5 below) before progressing to the finished product. Enzymes bind to these starting molecules and act to stabilize the intermediary state. This makes it easier for molecules to progress to the desired final products. Enzymes are the primary why to increase reaction rates for biochemical processes.
")
In addition to acting as enzymes, proteins also fulfill several other important roles. Proteins are involved with cell signaling, which helps different cells in the body work together. Antibodies are proteins that work with the body's immune system to recognize and destroy foreign substances that might cause illness. Structural proteins give shape or rigidity to cells, such as those that make up our nails or hair. Motor proteins allow for the movement of single-celled organisms. In short, proteins are critical for all of the basic functions of life.
Chirality of Amino Acids and Proteins
The central carbon in an amino acid can serve as a chiral center because it is typically bound to four different groups. Recall that chirality is defined as the property of an object that can not be superimposed on its mirror image, like how your palm-up hands cannot lay exactly on one another. The one exception is the amino acid, glycine, whose hydrogen side chain makes it a symmetric molecule.
The chirality of amino acids means there exists both left-handed and right-handed amino acids (Figure 6 below). Oddly, while either configuration is possible, life on Earth only uses left-handed amino acids.

Studies have been done to investigate how the chirality of protein affects how it is made and performs. Synthesis of both left-handed and right-handed amino acids is not only possible, it is chemically equivalent. From an energy standpoint, protein that is composed entirely of right-handed amino acids should function just as well as proteins made of left-handed amino acids. The only difference is that using only one type of chirality could add an extra layer of regulation in biochemical reactions that may help to reduce synthesis errors.
How did life come to pick left-handed proteins over right-handed ones? There are many competing theories as to the origins of this inequality. One idea is that left-handed amino acids are slightly more water soluble (i.e., easier to dissolve in water), which could have made them easier to incorporate into early life. Amino acids may also have been affected by the polarization of light.
Want to know more: Polarization
The polarization of light defines how the wave component of light oscillates relative to the direction in which the light is moving. Figure 7 shows light traveling from the bottom-right corner to the top-left corner. It shows how the polarization of light can be (1) incoherent, as in the right-most third of Figure 7, (2) oscillate back and forth in only one direction, i.e., linearly polarized as in the center of Figure 7, or (3) circularly polarized as is shown in the first third of Figure 7. Different types of filters (shown in Figure 7 as blue squares) help give rise to these types of polarization. In the early Solar System, it is thought that dust grains could have caused all light to be circularly polarized.

It is possible that this circularly polarized light might have been more damaging to right-handed amino acids or more favorable to left-handed ones. Amino acids found in space, for example on meteorites, also exhibit an excess of left-handed molecules. If polarized sunlight gave rise to this imbalance, it could have tipped the scales to the left for life on Earth. Regardless of what established the original inequality, biological processes probably accentuated the imbalance.
Nucleic Acids to Genes
Nucleic acids are used throughout life on Earth to transfer genetic information during cell replication. This genetic information defines the nature and structure of organisms.
Genes that are shared through cell replication and reproduction is why offspring look like their parents. Differences in genetic information can give rise to differences in the traits of an organism. For example, a change in genetic information may result an organism that is taller/shorter or fur color that is lighter/darker.
The process of gene replication---specifically gene mutation, which describes the errors that occur during gene replication---allow for different traits to arise. Some traits may allow an organism to survive better in a given environment. Lighter fur may be useful to blend in with a snowy environment; darker fur may be more helpful in a dark forest.
Organisms with these advantageous traits are more likely to be able to reproduce and pass on their favorable traits. This process of natural selection allows organisms to adapt and evolve to different environments. This ability to grow better equipped to surviving in an environment, also known as Darwinian evolution, is thought to be a key aspect of all living things.
Nucleotides
The nucleic acids found in all known living things on Earth take two forms: ribonucleic acid (RNA) and deoxyribonucleic acid (DNA). Nucleic acids are long, complex chains made up of nucleotides, a specific kind of molecule as diagramed in Figure 8. Nucleotides consist of three components: (1) a central sugar, (2) an interchangeable base, and (3) a phosphate group.
RNA and DNA differ by the central sugar of the nucleotides that makes them up. RNA uses ribose sugar while DNA uses deoxyribose sugar, which has one less oxygen molecule (note the atoms bonded to the 2nd carbon atom of each nucleotide shown in Figure 8).
The base of a nucleotide changes depending on the specific nucleotide, much like how different amino acids have different side chains. In living things on Earth, five different bases are used. RNA uses adenine, cytosine, guanine, and uracil (ACGU). DNA also uses adenine, cytosine and guanine, but uses thymine in place of uracil (ACGT). These bases bond to each other in specified ways. Cytosine always binds to guanine. Adenine bonds to the thymine in DNA and the uracil in RNA.
The structural formula for the five different bases are drawn in Figure 9. Nucleotide bases fall into two categories: double-ringed purines (A,G) and single-ring pyrimidines (C, T, U). Some of these bases were named after the material where they were first discovered. For instance, guanine was first discovered from guano, a fancy name for bird poop.

A phosphate group consists of a phosphorus atom bound to four oxygen atoms. This configuration contains many high energy bonds. The energy stored in this phosphate group allows nucelotides to undergo the reaction that links nucleotides together to form the long-chain nucleic acids that are RNA and DNA. These nucleic acids have a specific structure that was revealed only in the 1950s.
Want to know more: ATP - Cellular Energy Banks
An influx of energy is required to carry out many of the processes necessary for life. You eat to enable your body to create stores of energy to use for these reactions. You eat to create adenosine triphosphate, or ATP.
ATP, shown in Figure 10, is the most widely used energy carrier in all living organisms on Earth. ATP is also a nucleotide consisting of (1) a ribose sugar, (2) an adenine base, and (3) three phosphate groups bonded in a chain. When energy is needed for a chemical reaction, one of the high-energy phosphate to oxygen bonds in the chain is broken. This converts ATP to ADP, adenosine diphosphate, where only two phosphate groups remain.
Phosphate groups are used across living organisms on Earth to supply the energy for necessary reactions. Can you think of reasons why having a common source of energy across reactions would be beneficial? (Hint: would you rather have different charging cables for each of your devices, or one common charging cable?)

How do we know: DNA's structure
The exact structure of DNA was revealed through a series of insights that built on one another. When DNA was broken up into its constituent nucleotides, it was discovered that certain bases always appeared in the same proportions. The number of adenine and thymine nucleotides was always equal, and the number of cytosine nucleotides was always equal to the number of guanine nucleotides. In 1949, Erwin Chargoff, an Austro-Hungarian-born American biochemist, sought to explain this observation with the idea of base pairing---the idea that in DNA adenine is always bonded to thymine and cytosine is always bonded to guanine.
Observations of DNA using x-ray crystallography further revealed the structure of the molecule. X-ray crystallography is a complicated technique akin to shining a flashlight into a hall of mirrors and determining where the mirrors are placed based on the way that the light bounces around.
Rosalind Franklin, a British chemist, had a background in physical chemistry that she used to improved on x-ray crystallography techniques in the mid 1900s. Franklin produced unprecedentedly precise x-ray crystallography images (see Figure 11) while working in the lab of Maurice Wilkins. Her most famous photo, known as "Photo 51", held the key to DNA's structure. This photo was heralded by J.D. Bernal, the father of x-ray crystallography in biochemistry, as "among the most beautiful x-ray photographs of any substance ever taken.

The theoretical biochemists James Watson and Francis Crick used the idea of base pairing and Franklin's images to reveal the double-helix structure of DNA. Watson discovered that the adenine-thymine bond was exactly the same length as the cytosine-guanine bond, which helped him form the picture of each base pair as rungs of a ladder. Crick helped to develop a mathematical model for the pattern that a helical structure would produce with x-ray crystallography.
In 1951, Crick and Watson began to work together. When Maurice Wilkins showed them Rosalind Franklin's Photo 51, they were able to piece together the double-helix model of DNA (see Figure 12).

The double-helix backbone of DNA is composed of the sugar and phosphate components of nucleotides. The bases stick out from this backbone and bind to their appropriate counterpart through weak hydrogen bonds. In the most common form, the bases appear parallel to each other, like a well-designed stairwell. The double-stranded nature of DNA affords a rigid, stable, and long-lived structure. During DNA replication, each strand is checked against the other to reduce copying errors or accidental mutations.
Translating the Genetic Code
The genetic code in DNA is translated into instructions for how to manufacture proteins with the help of RNA. Messenger RNA (mRNA) transcribes the code from where DNA is located in the cell and carries this information to the ribosome. Ribosomes are the molecules responsible for fabricating proteins in a cell.
A ribosome can read the genetic code from mRNA and translate it to the necessary amino acids to build a protein. Ribosomes themselves are made up in part of RNA, known as ribosomal RNA (rRNA). Each amino acid is specified by different codons, a sequence of three base pairs. Transfer RNA (tRNA) matches up each codon with the appropriate amino acid. These different amino acids are bonded together into a polypeptide chain that can then be folded into the needed proteins.

The Genetic Code
To summarize, the cellular process of transcription generates messenger RNA (mRNA), a mobile molecular copy of one or more genes with an alphabet of A, C, G, and uracil (U). Translation of the mRNA template converts nucleotide-based genetic information into a protein product. Protein sequences consist of 20 commonly occurring amino acids; therefore, it can be said that the protein alphabet consists of 20 letters. Each amino acid is defined by a three-nucleotide sequence called the triplet codon. The relationship between a nucleotide codon and its corresponding amino acid is called the genetic code.
Given the different numbers of “letters” in the mRNA and protein “alphabets,” combinations of nucleotides corresponded to single amino acids. Using a three-nucleotide code means that there are a total of 64 (4 × 4 × 4) possible combinations; therefore, a given amino acid is encoded by more than one nucleotide triplet.
Three of the 64 codons terminate protein synthesis and release the polypeptide from the translation machinery. These triplets are called stop codons. Another codon, AUG, also has a special function. In addition to specifying the amino acid methionine, it also serves as the start codon to initiate translation. The genetic code is universal. With a few exceptions, virtually all species use the same genetic code for protein synthesis, which is powerful evidence that all life on Earth shares a common origin.
DNA encodes and stores genes, which describe a unit of genetic information. Together, all the genes stored in DNA provide a very lengthy instruction manual for all living creatures on Earth. If you took the entire chain of DNA in one human cell and completely stretched it out, it would measure roughly 2 meters, the average height of an NBA player. If you took all of the DNA from all of the cells in a human body and joined them end-to-end, they would cross the diameter of the Solar System twice.
Different segments of DNA are known as chromosomes. An organism's genome is the complete collection of chromosomes. Humans have 23 pairs of chromosomes, encoding roughly 25,000 genes using about 3 billion base pairs. A mosaic of the entire human genome was sequenced between 1990 and 2008. This monumental effort brought together twenty different institutions in six different countries. This remains one of the most impressive collaborative projects in science.
Want to know more: My, What Big Genomes You Have
All the better to encode with...or is it? Intuitively, it might seem that a larger genome would correspond to more complex organisms. A larger genome would allow for more genes, meaning more genetic traits, meaning more complexity. This is wrong.
An example of different genome sizes is given by the table below. Various species are ordered by increasing genome size as defined by the number of base pairs in the organism's complete genome.
| Species | Base Pairs | Genes |
| Virus | 170,000 | ? |
| E. Coli | 4,600,000 | 3,200 |
| Fruit Fly | 180,000,000 | 13,600 |
| Chicken | 1,000,000,000 | 23,000 |
| Corn | 2,500,000,000 | 59,000 |
| Human | 3,000,000,000 | 25,000 |
| Lily | 100,000,000,000 | ? |
| Grasshopper | 180,000,000,000 | ? |
| Amoeba | 670,000,000,000 | ? |
Not only does genome size not scale with perceived organism complexity, it also does not scale with the number of genes. Humans have longer genomes than chickens, but we lose out to grasshoppers. Humans also have a longer genome than corn, but less genes.
One reason for this is that most DNA is noncoding DNA, which does not translate directly to genes. Noncoding DNA may instead be used to signal the start of a gene, to help with DNA coiling, and/or potentially carry out several other functions that we have yet to discover.
Remarkably, more than 98% of the human genome is non-coding. In contrast, only 20% of the DNA in bacteria is noncoding DNA. The bladderwort plant currently holds the record for most efficient genome with only 3% noncoding DNA.
DNA encodes important instructions for life, but it can become damaged when base pairs or whole segments of DNA are deleted, inverted, duplicated, or moved around. Mutations can be damaging, for example, causing cells to become cancerous. Damage sustained to the phosphate-sugar backbone of DNA is one of the primary causes of mutations. This type of damage is a common result of exposure to UV radiation, such as from the Sun (never skimp on sunscreen).
However, mutations can also occur naturally, resulting in expressed altered genes that give rise to new characteristics. This is the mechanism for Darwinian evolution: beneficial traits arising from mutation will be preferentially selected when mating and propagated through succeeding generations.
Natural mutations arise at measurable rates for different species. This mutation rate allows us to measure the genetic distance between species. This value is obtained by determining the statistical number of mutations required to change one species' genome into another's. For example, deer and giraffes are close in genetic difference, the genome of a deer requires relatively few differences to change into the genome of a giraffe when compared to, say, the genome of sunflowers.
Concept Check
The Last Universal Common Ancestor
The Last Universal Common Ancestor (LUCA) on Earth is a concept, rather than an actual organism. Any universal characteristics of life on Earth are universal either because they are inherited or because they are truly fundamental to life in general. Without a second example of life we are unable to understand how common these features will be on other worlds.
LUCA represents the earliest shared qualities of ancestral life and likely appeared on Earth between 3.5 to 4 Gya and seeded our planet with life. All of the features of life today would have been inherited from LUCA. From what we know about terrestrial biology, this means that LUCA would have been carbon-based, dependent on water, incorporated left-handed amino acids, and used ATP for energy transport. LUCA would have used DNA or RNA to encode genes and translate them into proteins. Significantly, the codons that translate for specific amino acids are the same in every known organism. This code must have been passed down from a common ancestor from which every other species has since evolved. LUCA might not have even been as sophisticated as a single celled organism.
The Tree of Life
The first instance of life was likely very simple and single-celled. Today, life is fantastically varied and complex. We separate the life we see today into three domains based on shared cellular structure and genetic material. The three domains of life, archaea, bacteria, and eukaryotes, are a diversification of the Last Universal Common Ancestor (LUCA).

- Bacteria make up the largest domain with both the greatest number of individual species and a biomass that exceeds the combined biomass of all plants and animals. Bacteria were one of the earliest forms of life on our planet and they are found in most habitats. Bacteria can rapidly recombine their genes with other bacteria to allow for genetic innovations, such as resistance to antibiotics.
- Archaea are genetically distinct from bacteria with their own, separate domain. Archaea are known to generate energy in a variety of ways and have been found in some of the most extreme environments on Earth. Halophiles, for example, exist in extremely salty conditions.
- Eukaryotes are distinct from prokaryotes in containing a central nucleus enclosed in a membrane and also contain other membrane-bound organelles. Examples of eukaryote organelles include chloroplast, the site of photosynthesis in plants and some algae, and mitochondria, where energy is generated in a cell. Eukaryotes can be uni- or multi-cellular, allowing for larger and more complex organisms.

Both bacteria and archaea are prokaryotes: single-celled microbes that do not contain membrane-bound organelles. However, the membranes in archaea incorporate a different type of lipid than either bacteria or eukaryotes. Genetic analysis reveals that archaea are closer to eukaryotes in an evolutionary sense than they are to bacteria. Archaea and eukaryotes use many of the same enzymes for DNA translation.
The Diversification of Life
Endosymbiosis
Eukaryotic cells have gained membrane-bound organelles and increased complexity through the process of endosymbiosis. Endosymbiosis is a process whereby primitive organisms benefited by living inside other organisms. Chloroplasts and mitochondria are examples of highly complicated organelles in eukaryotes that have their own membrane. They retained the DNA, messenger RNA, transfer RNA, and ribosomes of their bacterial ancestors before they were symbiotically incorporated into larger eukaryotic cells. The larger cell presumably provided protection and easy access to organic molecules while the chloroplast and mitochondria provided energy to the larger cell. This beneficial relationship led to the creation of larger, more efficient cells.
Want to know more: Mother's Mitochondria
With sexual reproduction, the offspring ends up with a combination of the mother's and father's DNA. However, the DNA found in mitochondria is exclusively the mother's DNA. When cells are replicated, the mitochondria split themselves as needed and so maintain a self-consistent set of DNA. With mammals, the egg destroys most of the mitochondria in sperm when they merge. In addition, most of the sperm's mitochondria is positioned in the tail to provide energy and does not make it into the egg.
This preservation of maternal mitochondrial DNA is often used to trance ancestries. Because it is contained only in the mitochondria and is infrequently used, mitochondrial DNA also suffers fewer mutations. It is therefore also helpful in determining the ancestry of different species and how they fit onto the tree of life.
Cyanobacteria
The rise of oxygen likely began with organisms known as cyanobacteria, an early type of photosynthetic bacteria thought to be the first organism to produce oxygen as a byproduct. Photosynthesis is the process by which organisms can harness the energy of the sun to generate energy for their own use. Cyanobacteria are the only know prokaryotes to produce oxygen, and this adaptation brought about the destruction of many other organisms.
Want to know more: Oxidation Reactions and the Free Radicals
Oxidation describes a chemical process in which a molecule, atom, or ion loses an electron. Oxygen is a particularly good oxidizing agent because its nucleus strongly attracts electrons to fill its valence shell. Oxidation often produces free radicals, which are very reactive. They can attack and break apart bonds in other molecules, inciting a chain reaction that is damaging for biochemical reactions.
Antioxidants are compounds that inhibit oxidation and thereby prevent the formation of free radicals. Plants and animals have many natural antioxidant systems in place to guard against this or use antioxidant vitamins such as vitamin A, vitamin C, and vitamin E. A certain amount of antioxidants is required in a well-balanced diet. However, clinical studies have been unable to prove benefits of artificially increasing antioxidant intake or antioxidant supplements.
The rise in atmospheric oxygen was far from smooth and steady (see Figure 16 below). Cyanobacteria slowly became more abundant, but there was still a significant delay in the build up of oxygen. There are several processes that would have hindered the rise in oxygen. Oxygen would have reacted with various chemicals, mainly iron, in the oceans, and these reactions would trap oxygen, prevent it from building up the atmosphere.

Stage 1 (3.85–2.45 Ga): Practically no O2 in the atmosphere.
Stage 2 (2.45–1.85 Ga): O2 produced, but absorbed in oceans and seabed rock.
Stage 3 (1.85–0.85 Ga): O2 starts to gas out of the oceans, but is absorbed by land surfaces and formation of ozone layer.
Stages 4 and 5 (0.85 Ga–present): O2 sinks filled, the gas accumulates.Credit: Heinrich D. Holland derivative work: Loudubewe, CC BY-SA 3.0, via Wikimedia Commons
Oxygen may also have been taken up by microbes in metabolic pathways that generate energy. Organisms that used the oxygen to oxidize ammonia appear to have been plentiful at the time and could have been effective in the reduction of free-floating oxygen. Other organisms produced methane as a byproduct that could have acted as a sink for atmospheric oxygen. However, organisms that are known to produce methane require nickel to carry out the necessary reactions, and concentrations of nickel were dropping. The decrease of nickel would mean less excreted methane, and would allow oxygen to begin accumulating.
The increase of oxygen in the atmosphere was poisonous for anaerobic organisms. Most life before the Great Oxidation Event was anaerobic, so the rise of atmospheric oxygen surely resulted in one of the most significant extinction events in Earth's history. The fossil record shows a mass extinction of anaerobic life around 2.4-1.6 billion years ago, coincident with the rise of aerobic life.
Anaerobic vs Aerobic Life
The rise of atmospheric oxygen coincided with the appearance of far more complicated life forms. There is every reason to believe that the rise in oxygen would have been responsible since aerobic metabolisms are more efficient.
Respiration, in biological terms, describes the process by which organisms convert nutrients into usable energy by forming ATP bonds. Respiration begins with glycolysis, wherein glucose, a sugar, is broken down to form two molecules of a compound called pyruvate along with two molecules of ATP. Without oxygen, organisms have no choice but to undergo anaerobic respiration, or fermentation. Anaerobic respiration of yeast is what makes bread rise and beer bubbly. In this scenario, pyruvate is shuttled down a pathway which produces just two molecules of ATP.
Side Note: A byproduct of anaerobic respiration is a molecule called lactic acid. Lactic acid should be very familiar to any athlete or any student who has been very late to class and had to make a run for it. When our bodies overexert themselves, we begin to use up more oxygen than we can take in. In order to produce the energy needed to keep running, the body switches to anaerobic respiration, which leads to a build up of lactic acid. Lactic acid can damage muscle cells and hinder recovery. The process of producing this lactate is also the cause of next-day muscle soreness.
In the presence of oxygen, aerobic respiration becomes possible. With the help of oxygen, pyruvate can be broken down and enters a more complicated pathway known as the Krebs cycle or the citric acid cycle (note that organisms exhibit an enormous variety of metabolic pathways; the citric acid cycle merely represents one of the more common and well understood pathways). Through the citric acid cycle, organisms can produce from 30--36 ATP from just one molecule of glucose. Though more complicated to assemble, and therefore likely taking longer to evolve, this process can be up to 18-fold more efficient than anaerobic respiration. With more energy, it is possible to carry out more biochemical processes. This may have allowed cells to become increasingly complex and trend towards the more varied, multicellular life we see today.
Want to know more: Viruses
Viruses are even more abundant than bacteria. A virus consists of three functional parts: (1) genetic material, (2) protein coat, and typically (3) an envelope of lipids outside the protein coat. For genetic material, viruses have been discovered to use both DNA and RNA. The protein coat, also known as the capsid, encases and protects this genetic material. The envelope of lipids adds an additional layer of protection.
However, the question of whether viruses can be considered life is hotly debated. Viruses have their own genetic material and are even capable of evolving through natural selection. Viruses survive and replicate by infecting a host cell. After attaching to a cell, the virus injects its DNA into the host cell. Now, the virus is capable of taking over the host cell's replication mechanisms. In doing so, the virus can now create copies of itself until it has exhausted the cell's resources. Millions of viruses can be made in this period before the cell dies and viruses escape to infect new host cells. Because viruses require the metabolism of a host cell to produce energy and reproduce, they can not be called self-sustaining. In this way, viruses fail the NASA definition of life.
Despite their differences, evidence of viruses appear wherever life does, suggesting that viruses and life evolved together. The history of viruses is traced through their DNA or RNA and has given rise to three theories on how viruses came to be.
Regressive evolution theory proposes that viruses were once components of small, parasitic cells. Similar to the idea of endosymbiosis, viruses may have begun as small structures within larger cells that over time became separated. In fact, there exist today some bacteria that, like viruses, can only reproduce in a host cell. As they evolved, these small parasitic structures regressed further from cell-like characteristics, becoming the viruses we see today. However, there is no evidence of types of cells today that could serve as an intermediary between early and present day viruses. Even the smallest cellular parasites fail to really resemble viruses at all.
Another theory is the escaped gene theory, which proposes that viruses got their start as DNA or RNA that escaped from the genome of a larger organism. Surprisingly mobile DNA has recently come to play a large role in biology. Plasmids (Figure below) are circular units of DNA and separate from the genome of an organism. They are most commonly found in bacteria and have been known to move between cells. Scientists have also recently discovered transposons, or "jumping genes," which are large segments of DNA that can move around within a cell's genome. While either of these mechanisms could have provided the genetic material for viruses, it remains unclear where the complicated capsids enclosing these genes arose from.

The exact origin of viruses, much like the origin of life, remains an open question. This vein of research is being pushed forward through analysis of viral and host DNA sequences. What we can say is that genetic comparisons show that the origins of viruses may have predated life splitting into the three different domains. Perhaps the precursors to viruses evolved from the self-replicating molecules that dominated the RNA world. Similar to RNA, viruses are capable of self-assembling in host cells.
Viruses are now well enough understood to be used as tools in biomedical research. In a process called gene therapy, researchers use viruses to inserting genes into specific cells, offering possible treatments for diseases like cystic fibrosis. Some viruses will seek out and destroy cancer cells, while leaving healthy cells alone, allowing for a highly targeted and effective treatments.
Key Concepts and Summary
Two classes of molecules are common to every form of life on Earth: amino acids and nucleic bases. Understanding the fundamental and relatively simple structure of these molecules allows us to see the more complex patterns of biochemistry. Amino acids are the units for building proteins. While there are hundreds of possible amino acid chains, life on Earth uses only a common set of twenty and some amino acids have been detected with radio telescopes in giant molecular clouds - the star-forming regions of space. The nucleic bases adenine, guanine, thymine and cytosine are components of DNA (and in RNA with a substitute of uracil for thymine). In addition to nucleic bases, the nucleotides in RNA and DNA contain a central sugar and a phosphate group. DNA encodes the genetic information for every organism in a collection of chromosomes. DNA transcription errors result in mutations that occur naturally, but the mutation rate can increase with exposure to ultraviolet light or carcinogenic chemicals. All life on Earth shares common characteristic: it is carbon-based, dependent on water, has left-handed amino acids, uses ATP for energy storage and transport and has an inherited genetic code for building proteins to carry out processes in the living cell. These shared attributes are distilled into the concept of the Last Universal Common Ancestor at the root of the Tree of Life. There are three phylogenic branches on the Tree of Life: bacteria, archaea, and eukaryotes. The most complex organisms are eukaryotes, which evolved in part by the process of endosymbiosis to incorporate compartmentalized prokaryotic cells. The first cells were anaerobic - using chemical gradients for energy - and mutated into cells that used the energy of the sun for aerobic respiration. Aerobic respiration is 18 times more efficient in producing ATP than anerobic processes. Photosynthesizing cyanobacteria produce oxygen as a byproduct and are thought to be responsible for the rise of an oxygen-rich atmosphere on Earth.
Review Questions
Summary Questions
- What is an amino acid and how do amino acids form proteins?
- What functions do proteins have in living things?
- What is a nucleic acid? How do the two main nucleic acids used by life, RNA and DNA differ?
- What is the chemical structure of DNA?
- How are nucleic acids and genes related?
- What causes genetic mutations?
- What are the three domains on the tree of life and how do scientists distinguish between them?
- What are the main differences between prokaryotes and eukaryotes?
- Give an example of endosymbiosis and explain what advantages and disadvantages were gained by organisms that evolved from such situations.
- How did cyanobacteria cause one of Earth's mass extinctions?
- What causes aerobic metabolism to be more efficient than anaerobic metabolism?
Exercises
- It is fairly easy to extract DNA from a strawberry using household materials. See the step-by-step instructions here. In a formal laboratory setting or on your own, follow the steps to extract DNA and take detailed notes of the challenges or successes in your endeavor. What do you observe about the characteristics of the DNA you extracted?
- Four examples of eukaryotic organelles that evolved from endosymbiosis include (1) choloroplasts, (2) mitochondria, (3) nitroplasts, and (4) diazoplasts. Conduct the necessary research to construct a table that compares these four examples in separate rows with three different columns: (1) the kinds of organisms that contains these organelles, (2) the approximate timeframes for when the incorporation of these organelles occurred, and (3) explanations of the function of these organelles.
Two key classes of chemicals have been seen to operate in all known living things on Earth: amino acids and nucleic acids. Amino acids are the fundamental building blocks of proteins, which are essential for most biological processes. Nucleic acids make up the genetic code of all living things on Earth. Here, we investigate the chemistry and interplay between these crucial chemicals.
Learning Objectives
By the end of this chapter, you will be able to:
- Explain the structure of amino acids and proteins
- Discuss the importance of proteins for the functioning of life
- Describe the basic features of DNA and RNA and their components
- Discuss the role of an organism's genetic code and the impact of genetic mutations
Amino Acids to Proteins
Amino acids and the proteins they combine to form are found in every living organism on Earth. Proteins are needed to make critical biological reactions happen on timescales relevant to life. Proteins regulate the processes that drive life. Though proteins are found across all living things and carry out a wide variety of roles, every protein on Earth is made up of only twenty different amino acids.
Amino Acids
Amino acids are molecules that are defined by a specific structure; all amino acids consist of a central carbon atom forming four bonds to: (1) a hydrogen atom, (2) an amino group (-NH2), (3) a carboxyl group (-COOH), and (4) a changeable side chain (see Figure 1 below). In organic chemistry, molecules with a carboxyl group are called carboxylic acids. This along with the amino group gives these compounds the name amino acid.
The amino and carboxyl groups allow amino acids to bond to one another through a process of dehydration, i.e. a process that releases water (H2O). Figure 2 below diagrams the reaction with structural formulas. Water is formed by the loss of an -OH group and a hydrogen (H) atom.
This process forms a new bond, called a peptide bond, between the carbon and nitrogen atoms. Chains of amino acids are joined by peptide bonds; these chains are therefore also called polypeptide chains. Figure 3 shows an example of a polypeptide chain. Polypeptide chains are then folded into proteins. Note that Figure 3 uses a mixture of a structural and molecular formula; specifically, not all bonds to Hydrogen atoms are shown with a line.
The side chains give each amino acid a unique functionality. Examples of amino acids and their side chains are shown in Figure 3 in green. Amino acids can be positively or negatively charged, water-repellent, bulky, bent into different configurations, or have other properties depending on their side chains. These differences help the polypeptides fold as they form proteins, bind to specific compounds, or chemically react in different ways.
Despite the fact that more than 500 amino acids exist on Earth, living things on Earth incorporate only 20 different amino acids to form the vast array of proteins that are used to regulate chemical reactions in all aspects of life. This is similar in spirit to the concept that even though the English languages only uses 26 letters, those same letters make up the words that compose millions of books.
Want to know more: Essential Amino Acids, Body Building, and You
Of the 20 amino acids used by life on Earth, the human body is capable of synthesizing all but nine. These nine amino acids are known as the essential amino acids. It is important to include sources of these amino acids either from meat or plants in a healthy diet since the body has no other source for them.
In fact, many products sell amino acids as supplements targeted towards endurance athletes and body builders. Scientists have been able to trace different amino acids and the role they play in muscle contraction or recovery to identify what the body needs after the coach has said "last set'" for the third set in a row. For example, glutamine is drained during intense physical activity. If the body's glutamine stores become depleted, the body begins to break down muscle cells to compensate.
Proteins
It is commonly said that you are what you eat, but perhaps more correctly, you are what your proteins decide to do. Proteins are the driving force behind the processes of life. Many proteins act as enzymes, which are highly specified molecules that allow complicated organic reactions to progress more easily.
In most organic reactions, the molecules involved must first assume an unfavorable, intermediate configuration (see Figure 5 below) before progressing to the finished product. Enzymes bind to these starting molecules and act to stabilize the intermediary state. This makes it easier for molecules to progress to the desired final products. Enzymes are the primary why to increase reaction rates for biochemical processes.
In addition to acting as enzymes, proteins also fulfill several other important roles. Proteins are involved with cell signaling, which helps different cells in the body work together. Antibodies are proteins that work with the body's immune system to recognize and destroy foreign substances that might cause illness. Structural proteins give shape or rigidity to cells, such as those that make up our nails or hair. Motor proteins allow for the movement of single-celled organisms. In short, proteins are critical for all of the basic functions of life.
Chirality of Amino Acids and Proteins
The central carbon in an amino acid can serve as a chiral center because it is typically bound to four different groups. Recall that chirality is defined as the property of an object that can not be superimposed on its mirror image, like how your palm-up hands cannot lay exactly on one another. The one exception is the amino acid, glycine, whose hydrogen side chain makes it a symmetric molecule.
The chirality of amino acids means there exists both left-handed and right-handed amino acids (Figure 6 below). Oddly, while either configuration is possible, life on Earth only uses left-handed amino acids.
Studies have been done to investigate how the chirality of protein affects how it is made and performs. Synthesis of both left-handed and right-handed amino acids is not only possible, it is chemically equivalent. From an energy standpoint, protein that is composed entirely of right-handed amino acids should function just as well as proteins made of left-handed amino acids. The only difference is that using only one type of chirality could add an extra layer of regulation in biochemical reactions that may help to reduce synthesis errors.
How did life come to pick left-handed proteins over right-handed ones? There are many competing theories as to the origins of this inequality. One idea is that left-handed amino acids are slightly more water soluble (i.e., easier to dissolve in water), which could have made them easier to incorporate into early life. Amino acids may also have been affected by the polarization of light.
Want to know more: Polarization
The polarization of light defines how the wave component of light oscillates relative to the direction in which the light is moving. Figure 7 shows light traveling from the bottom-right corner to the top-left corner. It shows how the polarization of light can be (1) incoherent, as in the right-most third of Figure 7, (2) oscillate back and forth in only one direction, i.e., linearly polarized as in the center of Figure 7, or (3) circularly polarized as is shown in the first third of Figure 7. Different types of filters (shown in Figure 7 as blue squares) help give rise to these types of polarization. In the early Solar System, it is thought that dust grains could have caused all light to be circularly polarized.
It is possible that this circularly polarized light might have been more damaging to right-handed amino acids or more favorable to left-handed ones. Amino acids found in space, for example on meteorites, also exhibit an excess of left-handed molecules. If polarized sunlight gave rise to this imbalance, it could have tipped the scales to the left for life on Earth. Regardless of what established the original inequality, biological processes probably accentuated the imbalance.
Nucleic Acids to Genes
Nucleic acids are used throughout life on Earth to transfer genetic information during cell replication. This genetic information defines the nature and structure of organisms.
Genes that are shared through cell replication and reproduction is why offspring look like their parents. Differences in genetic information can give rise to differences in the traits of an organism. For example, a change in genetic information may result an organism that is taller/shorter or fur color that is lighter/darker.
The process of gene replication---specifically gene mutation, which describes the errors that occur during gene replication---allow for different traits to arise. Some traits may allow an organism to survive better in a given environment. Lighter fur may be useful to blend in with a snowy environment; darker fur may be more helpful in a dark forest.
Organisms with these advantageous traits are more likely to be able to reproduce and pass on their favorable traits. This process of natural selection allows organisms to adapt and evolve to different environments. This ability to grow better equipped to surviving in an environment, also known as Darwinian evolution, is thought to be a key aspect of all living things.
Nucleotides
The nucleic acids found in all known living things on Earth take two forms: ribonucleic acid (RNA) and deoxyribonucleic acid (DNA). Nucleic acids are long, complex chains made up of nucleotides, a specific kind of molecule as diagramed in Figure 8. Nucleotides consist of three components: (1) a central sugar, (2) an interchangeable base, and (3) a phosphate group.
RNA and DNA differ by the central sugar of the nucleotides that makes them up. RNA uses ribose sugar while DNA uses deoxyribose sugar, which has one less oxygen molecule (note the atoms bonded to the 2nd carbon atom of each nucleotide shown in Figure 8).
The base of a nucleotide changes depending on the specific nucleotide, much like how different amino acids have different side chains. In living things on Earth, five different bases are used. RNA uses adenine, cytosine, guanine, and uracil (ACGU). DNA also uses adenine, cytosine and guanine, but uses thymine in place of uracil (ACGT). These bases bond to each other in specified ways. Cytosine always binds to guanine. Adenine bonds to the thymine in DNA and the uracil in RNA.
The structural formula for the five different bases are drawn in Figure 9. Nucleotide bases fall into two categories: double-ringed purines (A,G) and single-ring pyrimidines (C, T, U). Some of these bases were named after the material where they were first discovered. For instance, guanine was first discovered from guano, a fancy name for bird poop.
A phosphate group consists of a phosphorus atom bound to four oxygen atoms. This configuration contains many high energy bonds. The energy stored in this phosphate group allows nucelotides to undergo the reaction that links nucleotides together to form the long-chain nucleic acids that are RNA and DNA. These nucleic acids have a specific structure that was revealed only in the 1950s.
Want to know more: ATP - Cellular Energy Banks
An influx of energy is required to carry out many of the processes necessary for life. You eat to enable your body to create stores of energy to use for these reactions. You eat to create adenosine triphosphate, or ATP.
ATP, shown in Figure 10, is the most widely used energy carrier in all living organisms on Earth. ATP is also a nucleotide consisting of (1) a ribose sugar, (2) an adenine base, and (3) three phosphate groups bonded in a chain. When energy is needed for a chemical reaction, one of the high-energy phosphate to oxygen bonds in the chain is broken. This converts ATP to ADP, adenosine diphosphate, where only two phosphate groups remain.
Phosphate groups are used across living organisms on Earth to supply the energy for necessary reactions. Can you think of reasons why having a common source of energy across reactions would be beneficial? (Hint: would you rather have different charging cables for each of your devices, or one common charging cable?)
How do we know: DNA's structure
The exact structure of DNA was revealed through a series of insights that built on one another. When DNA was broken up into its constituent nucleotides, it was discovered that certain bases always appeared in the same proportions. The number of adenine and thymine nucleotides was always equal, and the number of cytosine nucleotides was always equal to the number of guanine nucleotides. In 1949, Erwin Chargoff, an Austro-Hungarian-born American biochemist, sought to explain this observation with the idea of base pairing---the idea that in DNA adenine is always bonded to thymine and cytosine is always bonded to guanine.
Observations of DNA using x-ray crystallography further revealed the structure of the molecule. X-ray crystallography is a complicated technique akin to shining a flashlight into a hall of mirrors and determining where the mirrors are placed based on the way that the light bounces around.
Rosalind Franklin, a British chemist, had a background in physical chemistry that she used to improved on x-ray crystallography techniques in the mid 1900s. Franklin produced unprecedentedly precise x-ray crystallography images (see Figure 11) while working in the lab of Maurice Wilkins. Her most famous photo, known as "Photo 51", held the key to DNA's structure. This photo was heralded by J.D. Bernal, the father of x-ray crystallography in biochemistry, as "among the most beautiful x-ray photographs of any substance ever taken.
The theoretical biochemists James Watson and Francis Crick used the idea of base pairing and Franklin's images to reveal the double-helix structure of DNA. Watson discovered that the adenine-thymine bond was exactly the same length as the cytosine-guanine bond, which helped him form the picture of each base pair as rungs of a ladder. Crick helped to develop a mathematical model for the pattern that a helical structure would produce with x-ray crystallography.
In 1951, Crick and Watson began to work together. When Maurice Wilkins showed them Rosalind Franklin's Photo 51, they were able to piece together the double-helix model of DNA (see Figure 12).
The double-helix backbone of DNA is composed of the sugar and phosphate components of nucleotides. The bases stick out from this backbone and bind to their appropriate counterpart through weak hydrogen bonds. In the most common form, the bases appear parallel to each other, like a well-designed stairwell. The double-stranded nature of DNA affords a rigid, stable, and long-lived structure. During DNA replication, each strand is checked against the other to reduce copying errors or accidental mutations.
Translating the Genetic Code
The genetic code in DNA is translated into instructions for how to manufacture proteins with the help of RNA. Messenger RNA (mRNA) transcribes the code from where DNA is located in the cell and carries this information to the ribosome. Ribosomes are the molecules responsible for fabricating proteins in a cell.
A ribosome can read the genetic code from mRNA and translate it to the necessary amino acids to build a protein. Ribosomes themselves are made up in part of RNA, known as ribosomal RNA (rRNA). Each amino acid is specified by different codons, a sequence of three base pairs. Transfer RNA (tRNA) matches up each codon with the appropriate amino acid. These different amino acids are bonded together into a polypeptide chain that can then be folded into the needed proteins.
The Genetic Code
DNA encodes and stores genes, which describe a unit of genetic information. Together, all the genes stored in DNA provide a very lengthy instruction manual for all living creatures on Earth. If you took the entire chain of DNA in one human cell and completely stretched it out, it would measure roughly 2 meters, the average height of an NBA player. If you took all of the DNA from all of the cells in a human body and joined them end-to-end, they would cross the diameter of the Solar System twice.
Different segments of DNA are known as chromosomes. An organism's genome is the complete collection of chromosomes. Humans have 23 pairs of chromosomes, encoding roughly 25,000 genes using about 3 billion base pairs. A mosaic of the entire human genome was sequenced between 1990 and 2008. This monumental effort brought together twenty different institutions in six different countries. This remains one of the most impressive collaborative projects in science.
Want to know more: My, What Big Genomes You Have
All the better to encode with...or is it? Intuitively, it might seem that a larger genome would correspond to more complex organisms. A larger genome would allow for more genes, meaning more genetic traits, meaning more complexity. This is wrong.
An example of different genome sizes is given by the table below. Various species are ordered by increasing genome size as defined by the number of base pairs in the organism's complete genome.
| Species | Base Pairs | Genes |
| Virus | 170,000 | ? |
| E. Coli | 4,600,000 | 3,200 |
| Fruit Fly | 180,000,000 | 13,600 |
| Chicken | 1,000,000,000 | 23,000 |
| Corn | 2,500,000,000 | 59,000 |
| Human | 3,000,000,000 | 25,000 |
| Lily | 100,000,000,000 | ? |
| Grasshopper | 180,000,000,000 | ? |
| Amoeba | 670,000,000,000 | ? |
Not only does genome size not scale with perceived organism complexity, it also does not scale with the number of genes. Humans have longer genomes than chickens, but we lose out to grasshoppers. Humans also have a longer genome than corn, but less genes.
One reason for this is that most DNA is noncoding DNA, which does not translate directly to genes. Noncoding DNA may instead be used to signal the start of a gene, to help with DNA coiling, and/or potentially carry out several other functions that we have yet to discover.
Remarkably, more than 98% of the human genome is non-coding. In contrast, only 20% of the DNA in bacteria is noncoding DNA. The bladderwort plant currently holds the record for most efficient genome with only 3% noncoding DNA.
DNA encodes important instructions for life, but it can become damaged when base pairs or whole segments of DNA are deleted, inverted, duplicated, or moved around. Mutations can be damaging, for example, causing cells to become cancerous. Damage sustained to the phosphate-sugar backbone of DNA is one of the primary causes of mutations. This type of damage is a common result of exposure to UV radiation, such as from the Sun (never skimp on sunscreen).
However, mutations can also occur naturally, resulting in expressed altered genes that give rise to new characteristics. This is the mechanism for Darwinian evolution: beneficial traits arising from mutation will be preferentially selected when mating and propagated through succeeding generations.
Natural mutations arise at measurable rates for different species. This mutation rate allows us to measure the genetic distance between species. This value is obtained by determining the statistical number of mutations required to change one species' genome into another's. For example, deer and giraffes are close in genetic difference, the genome of a deer requires relatively few differences to change into the genome of a giraffe when compared to, say, the genome of sunflowers.
Concept Check
Key Concepts and Summary
Two classes of molecules are common to every form of life on Earth: amino acids and nucleic bases. Understanding the fundamental and relatively simple structure of these molecules allows us to see the more complex patterns of biochemistry. Amino acids are the units for building proteins. While there are hundreds of possible amino acid chains, life on Earth uses only a common set of twenty and some amino acids have been detected with radio telescopes in giant molecular clouds - the star-forming regions of space. The nucleic bases adenine, guanine, thymine and cytosine are components of DNA (and in RNA with a substitute of uracil for thymine). In addition to nucleic bases, the nucleotides in RNA and DNA contain a central sugar and a phosphate group. DNA encodes the genetic information for every organism in a collection of chromosomes. DNA transcription errors result in mutations that occur naturally, but the mutation rate can increase with exposure to ultraviolet light or carcinogenic chemicals.
Review Questions
Exercises
- It is fairly easy to extract DNA from a strawberry using household materials. See the step-by-step instructions here. In a formal laboratory setting or on your own, follow the steps to extract DNA and take detailed notes of the challenges or successes in your endeavor. What do you observe about the characteristics of the DNA you extracted?
Summary Questions
- What is an amino acid and how do amino acids form proteins?
- What functions do proteins have in living things?
- What is a nucleic acid? How do the two main nucleic acids used by life, RNA and DNA differ?
- What is the chemical structure of DNA?
- How are nucleic acids and genes related?
- What causes genetic mutations?
Once life formed on Earth, over time it became more complex...eventually leading to humans capable of pondering their own existence. All life on Earth descends from the very first instance of life. Natural selection drove species to form and adapt to new environments and ecological niches. The rise of oxygen in the atmosphere about 2.5 billion years ago caused a proliferation of new life forms that had more efficient metabolic pathways. We will look at some of the milestones in the formation of more complex life throughout Earth's 4.5 billion year history.
Learning Objectives
By the end of this chapter, you will be able to:
- Describe the three different domains of the tree of life
- Explain the difference between prokaryotes and eukaryotes
- Explain how endosymbiosis leads to more complex cells
- Describe how cyanobacteria increased the amount of oxygen in the Earth’s early atmosphere
- Explain how aerobic respiration is more efficient than anaerobic respiration
The Last Universal Common Ancestor
The Last Universal Common Ancestor (LUCA) on Earth is a concept, rather than an actual organism. Any universal characteristics of life on Earth are universal either because they are inherited or because they are truly fundamental to life in general. Without a second example of life we are unable to understand how common these features will be on other worlds.
LUCA represents the earliest shared qualities of ancestral life and likely appeared on Earth between 3.5 to 4 Gya and seeded our planet with life. All of the features of life today would have been inherited from LUCA. From what we know about terrestrial biology, this means that LUCA would have been carbon-based, dependent on water, incorporated left-handed amino acids, and used ATP for energy transport. LUCA would have used DNA or RNA to encode genes and translate them into proteins. Significantly, the codons that translate for specific amino acids are the same in every known organism. This code must have been passed down from a common ancestor from which every other species has since evolved. LUCA might not have even been as sophisticated as a single celled organism.
The Tree of Life
The first instance of life was likely very simple and single-celled. Today, life is fantastically varied and complex. We separate the life we see today into three domains based on shared cellular structure and genetic material. The three domains of life, archaea, bacteria, and eukaryotes, are a diversification of the Last Universal Common Ancestor (LUCA).
- Bacteria make up the largest domain with both the greatest number of individual species and a biomass that exceeds the combined biomass of all plants and animals. Bacteria were one of the earliest forms of life on our planet and they are found in most habitats. Bacteria can rapidly recombine their genes with other bacteria to allow for genetic innovations, such as resistance to antibiotics.
- Archaea are genetically distinct from bacteria with their own, separate domain. Archaea are known to generate energy in a variety of ways and have been found in some of the most extreme environments on Earth. Halophiles, for example, exist in extremely salty conditions.
- Eukaryotes are distinct from prokaryotes in containing a central nucleus enclosed in a membrane and also contain other membrane-bound organelles. Examples of eukaryote organelles include chloroplast, the site of photosynthesis in plants and some algae, and mitochondria, where energy is generated in a cell. Eukaryotes can be uni- or multi-cellular, allowing for larger and more complex organisms.
Both bacteria and archaea are prokaryotes: single-celled microbes that do not contain membrane-bound organelles. However, the membranes in archaea incorporate a different type of lipid than either bacteria or eukaryotes. Genetic analysis reveals that archaea are closer to eukaryotes in an evolutionary sense than they are to bacteria. Archaea and eukaryotes use many of the same enzymes for DNA translation.
The Diversification of Life
Endosymbiosis
Eukaryotic cells have gained membrane-bound organelles and increased complexity through the process of endosymbiosis. Endosymbiosis is a process whereby primitive organisms benefited by living inside other organisms. Chloroplasts and mitochondria are examples of highly complicated organelles in eukaryotes that have their own membrane. They retained the DNA, messenger RNA, transfer RNA, and ribosomes of their bacterial ancestors before they were symbiotically incorporated into larger eukaryotic cells. The larger cell presumably provided protection and easy access to organic molecules while the chloroplast and mitochondria provided energy to the larger cell. This beneficial relationship led to the creation of larger, more efficient cells.
Want to know more: Mother's Mitochondria
With sexual reproduction, the offspring ends up with a combination of the mother's and father's DNA. However, the DNA found in mitochondria is exclusively the mother's DNA. When cells are replicated, the mitochondria split themselves as needed and so maintain a self-consistent set of DNA. With mammals, the egg destroys most of the mitochondria in sperm when they merge. In addition, most of the sperm's mitochondria is positioned in the tail to provide energy and does not make it into the egg.
This preservation of maternal mitochondrial DNA is often used to trance ancestries. Because it is contained only in the mitochondria and is infrequently used, mitochondrial DNA also suffers fewer mutations. It is therefore also helpful in determining the ancestry of different species and how they fit onto the tree of life.
Cyanobacteria
The rise of oxygen likely began with organisms known as cyanobacteria, an early type of photosynthetic bacteria thought to be the first organism to produce oxygen as a byproduct. Photosynthesis is the process by which organisms can harness the energy of the sun to generate energy for their own use. Cyanobacteria are the only know prokaryotes to produce oxygen, and this adaptation brought about the destruction of many other organisms.
Want to know more: Oxidation Reactions and the Free Radicals
Oxidation describes a chemical process in which a molecule, atom, or ion loses an electron. Oxygen is a particularly good oxidizing agent because its nucleus strongly attracts electrons to fill its valence shell. Oxidation often produces free radicals, which are very reactive. They can attack and break apart bonds in other molecules, inciting a chain reaction that is damaging for biochemical reactions.
Antioxidants are compounds that inhibit oxidation and thereby prevent the formation of free radicals. Plants and animals have many natural antioxidant systems in place to guard against this or use antioxidant vitamins such as vitamin A, vitamin C, and vitamin E. A certain amount of antioxidants is required in a well-balanced diet. However, clinical studies have been unable to prove benefits of artificially increasing antioxidant intake or antioxidant supplements.
The rise in atmospheric oxygen was far from smooth and steady (see Figure 3 below). Cyanobacteria slowly became more abundant, but there was still a significant delay in the build up of oxygen. There are several processes that would have hindered the rise in oxygen. Oxygen would have reacted with various chemicals, mainly iron, in the oceans, and these reactions would trap oxygen, prevent it from building up the atmosphere.
 Oxygen may also have been taken up by microbes in metabolic pathways that generate energy. Organisms that used the oxygen to oxidize ammonia appear to have been plentiful at the time and could have been effective in the reduction of free-floating oxygen.
Other organisms produced methane as a byproduct that could have acted as a sink for atmospheric oxygen. However, organisms that are known to produce methane require nickel to carry out the necessary reactions, and concentrations of nickel were dropping. The decrease of nickel would mean less excreted methane, and would allow oxygen to begin accumulating.
The increase of oxygen in the atmosphere was poisonous for anaerobic organisms. Most life before the Great Oxidation Event was anaerobic, so the rise of atmospheric oxygen surely resulted in one of the most significant extinction events in Earth's history. The fossil record shows a mass extinction of anaerobic life around 2.4-1.6 billion years ago, coincident with the rise of aerobic life.
Anaerobic vs Aerobic Life
The rise of atmospheric oxygen coincided with the appearance of far more complicated life forms. There is every reason to believe that the rise in oxygen would have been responsible since aerobic metabolisms are more efficient.
Respiration, in biological terms, describes the process by which organisms convert nutrients into usable energy by forming ATP bonds. Respiration begins with glycolysis, wherein glucose, a sugar, is broken down to form two molecules of a compound called pyruvate along with two molecules of ATP. Without oxygen, organisms have no choice but to undergo anaerobic respiration, or fermentation. Anaerobic respiration of yeast is what makes bread rise and beer bubbly. In this scenario, pyruvate is shuttled down a pathway which produces just two molecules of ATP.
Side Note: A byproduct of anaerobic respiration is a molecule called lactic acid. Lactic acid should be very familiar to any athlete or any student who has been very late to class and had to make a run for it. When our bodies overexert themselves, we begin to use up more oxygen than we can take in. In order to produce the energy needed to keep running, the body switches to anaerobic respiration, which leads to a build up of lactic acid. Lactic acid can damage muscle cells and hinder recovery. The process of producing this lactate is also the cause of next-day muscle soreness.
In the presence of oxygen, aerobic respiration becomes possible. With the help of oxygen, pyruvate can be broken down and enters a more complicated pathway known as the Krebs cycle or the citric acid cycle (note that organisms exhibit an enormous variety of metabolic pathways; the citric acid cycle merely represents one of the more common and well understood pathways). Through the citric acid cycle, organisms can produce from 30--36 ATP from just one molecule of glucose. Though more complicated to assemble, and therefore likely taking longer to evolve, this process can be up to 18-fold more efficient than anaerobic respiration. With more energy, it is possible to carry out more biochemical processes. This may have allowed cells to become increasingly complex and trend towards the more varied, multicellular life we see today.
Want to know more: Viruses
Viruses are even more abundant than bacteria. A virus consists of three functional parts: (1) genetic material, (2) protein coat, and typically (3) an envelope of lipids outside the protein coat. For genetic material, viruses have been discovered to use both DNA and RNA. The protein coat, also known as the capsid, encases and protects this genetic material. The envelope of lipids adds an additional layer of protection.
However, the question of whether viruses can be considered life is hotly debated. Viruses have their own genetic material and are even capable of evolving through natural selection. Viruses survive and replicate by infecting a host cell. After attaching to a cell, the virus injects its DNA into the host cell. Now, the virus is capable of taking over the host cell's replication mechanisms. In doing so, the virus can now create copies of itself until it has exhausted the cell's resources. Millions of viruses can be made in this period before the cell dies and viruses escape to infect new host cells. Because viruses require the metabolism of a host cell to produce energy and reproduce, they can not be called self-sustaining. In this way, viruses fail the NASA definition of life.
Despite their differences, evidence of viruses appear wherever life does, suggesting that viruses and life evolved together. The history of viruses is traced through their DNA or RNA and has given rise to three theories on how viruses came to be.
Regressive evolution theory proposes that viruses were once components of small, parasitic cells. Similar to the idea of endosymbiosis, viruses may have begun as small structures within larger cells that over time became separated. In fact, there exist today some bacteria that, like viruses, can only reproduce in a host cell. As they evolved, these small parasitic structures regressed further from cell-like characteristics, becoming the viruses we see today. However, there is no evidence of types of cells today that could serve as an intermediary between early and present day viruses. Even the smallest cellular parasites fail to really resemble viruses at all.
Another theory is the escaped gene theory, which proposes that viruses got their start as DNA or RNA that escaped from the genome of a larger organism. Surprisingly mobile DNA has recently come to play a large role in biology. Plasmids (Figure below) are circular units of DNA and separate from the genome of an organism. They are most commonly found in bacteria and have been known to move between cells. Scientists have also recently discovered transposons, or "jumping genes," which are large segments of DNA that can move around within a cell's genome. While either of these mechanisms could have provided the genetic material for viruses, it remains unclear where the complicated capsids enclosing these genes arose from.
The exact origin of viruses, much like the origin of life, remains an open question. This vein of research is being pushed forward through analysis of viral and host DNA sequences. What we can say is that genetic comparisons show that the origins of viruses may have predated life splitting into the three different domains. Perhaps the precursors to viruses evolved from the self-replicating molecules that dominated the RNA world. Similar to RNA, viruses are capable of self-assembling in host cells.
Viruses are now well enough understood to be used as tools in biomedical research. In a process called gene therapy, researchers use viruses to inserting genes into specific cells, offering possible treatments for diseases like cystic fibrosis. Some viruses will seek out and destroy cancer cells, while leaving healthy cells alone, allowing for a highly targeted and effective treatments.
Key Concepts and Summary
All life on Earth shares common characteristic: it is carbon-based, dependent on water, has left-handed amino acids, uses ATP for energy storage and transport and has an inherited genetic code for building proteins to carry out processes in the living cell. These shared attributes are distilled into the concept of the Last Universal Common Ancestor at the root of the Tree of Life. There are three phylogenic branches on the Tree of Life: bacteria, archaea, and eukaryotes. The most complex organisms are eukaryotes, which evolved in part by the process of endosymbiosis to incorporate compartmentalized prokaryotic cells. The first cells were anaerobic - using chemical gradients for energy - and mutated into cells that used the energy of the sun for aerobic respiration. Aerobic respiration is 18 times more efficient in producing ATP than anerobic processes. Photosynthesizing cyanobacteria produce oxygen as a byproduct and are thought to be responsible for the rise of an oxygen-rich atmosphere on Earth.
Review Questions
- What are the three domains on the tree of life and how do scientists distinguish between them?
- What are the main differences between prokaryotes and eukaryotes?
- Give an example of endosymbiosis and explain what advantages and disadvantages were gained by organisms that evolved from such situations.
- How did cyanobacteria cause one of Earth's mass extinctions?
- What causes aerobic metabolism to be more efficient than anaerobic metabolism?
Exercises
- Four examples of eukaryotic organelles that evolved from endosymbiosis include (1) choloroplasts, (2) mitochondria, (3) nitroplasts, and (4) diazoplasts. Conduct the necessary research to construct a table that compares these four examples in separate rows with three different columns: (1) the kinds of organisms that contains these organelles, (2) the approximate timeframes for when the incorporation of these organelles occurred, and (3) explanations of the function of these organelles.
Once life formed on Earth, over time it became more complex...eventually leading to humans capable of pondering their own existence. All life on Earth descends from the very first instance of life. Natural selection drove species to form and adapt to new environments and ecological niches. The rise of oxygen in the atmosphere about 2.5 billion years ago caused a proliferation of new life forms that had more efficient metabolic pathways. We will look at some of the milestones in the formation of more complex life throughout Earth's 4.5 billion year history.
Learning Objectives
By the end of this chapter, you will be able to:
- Describe the three different domains of the tree of life
- Explain the difference between prokaryotes and eukaryotes
- Explain how endosymbiosis leads to more complex cells
- Describe how cyanobacteria increased the amount of oxygen in the Earth’s early atmosphere
- Explain how aerobic respiration is more efficient than anaerobic respiration
The Last Universal Common Ancestor
The Last Universal Common Ancestor (LUCA) on Earth is a concept, rather than an actual organism. Any universal characteristics of life on Earth are universal either because they are inherited or because they are truly fundamental to life in general. Without a second example of life we are unable to understand how common these features will be on other worlds.
LUCA represents the earliest shared qualities of ancestral life and likely appeared on Earth between 3.5 to 4 Gya and seeded our planet with life. All of the features of life today would have been inherited from LUCA. From what we know about terrestrial biology, this means that LUCA would have been carbon-based, dependent on water, incorporated left-handed amino acids, and used ATP for energy transport. LUCA would have used DNA or RNA to encode genes and translate them into proteins. Significantly, the codons that translate for specific amino acids are the same in every known organism. This code must have been passed down from a common ancestor from which every other species has since evolved. LUCA might not have even been as sophisticated as a single celled organism.
The Tree of Life
The first instance of life was likely very simple and single-celled. Today, life is fantastically varied and complex. We separate the life we see today into three domains based on shared cellular structure and genetic material. The three domains of life, archaea, bacteria, and eukaryotes, are a diversification of the Last Universal Common Ancestor (LUCA).
- Bacteria make up the largest domain with both the greatest number of individual species and a biomass that exceeds the combined biomass of all plants and animals. Bacteria were one of the earliest forms of life on our planet and they are found in most habitats. Bacteria can rapidly recombine their genes with other bacteria to allow for genetic innovations, such as resistance to antibiotics.
- Archaea are genetically distinct from bacteria with their own, separate domain. Archaea are known to generate energy in a variety of ways and have been found in some of the most extreme environments on Earth. Halophiles, for example, exist in extremely salty conditions.
- Eukaryotes are distinct from prokaryotes in containing a central nucleus enclosed in a membrane and also contain other membrane-bound organelles. Examples of eukaryote organelles include chloroplast, the site of photosynthesis in plants and some algae, and mitochondria, where energy is generated in a cell. Eukaryotes can be uni- or multi-cellular, allowing for larger and more complex organisms.
Both bacteria and archaea are prokaryotes: single-celled microbes that do not contain membrane-bound organelles. However, the membranes in archaea incorporate a different type of lipid than either bacteria or eukaryotes. Genetic analysis reveals that archaea are closer to eukaryotes in an evolutionary sense than they are to bacteria. Archaea and eukaryotes use many of the same enzymes for DNA translation.
The Diversification of Life
Endosymbiosis
Eukaryotic cells have gained membrane-bound organelles and increased complexity through the process of endosymbiosis. Endosymbiosis is a process whereby primitive organisms benefited by living inside other organisms. Chloroplasts and mitochondria are examples of highly complicated organelles in eukaryotes that have their own membrane. They retained the DNA, messenger RNA, transfer RNA, and ribosomes of their bacterial ancestors before they were symbiotically incorporated into larger eukaryotic cells. The larger cell presumably provided protection and easy access to organic molecules while the chloroplast and mitochondria provided energy to the larger cell. This beneficial relationship led to the creation of larger, more efficient cells.
Want to know more: Mother's Mitochondria
With sexual reproduction, the offspring ends up with a combination of the mother's and father's DNA. However, the DNA found in mitochondria is exclusively the mother's DNA. When cells are replicated, the mitochondria split themselves as needed and so maintain a self-consistent set of DNA. With mammals, the egg destroys most of the mitochondria in sperm when they merge. In addition, most of the sperm's mitochondria is positioned in the tail to provide energy and does not make it into the egg.
This preservation of maternal mitochondrial DNA is often used to trance ancestries. Because it is contained only in the mitochondria and is infrequently used, mitochondrial DNA also suffers fewer mutations. It is therefore also helpful in determining the ancestry of different species and how they fit onto the tree of life.
Cyanobacteria
The rise of oxygen likely began with organisms known as cyanobacteria, an early type of photosynthetic bacteria thought to be the first organism to produce oxygen as a byproduct. Photosynthesis is the process by which organisms can harness the energy of the sun to generate energy for their own use. Cyanobacteria are the only know prokaryotes to produce oxygen, and this adaptation brought about the destruction of many other organisms.
Want to know more: Oxidation Reactions and the Free Radicals
Oxidation describes a chemical process in which a molecule, atom, or ion loses an electron. Oxygen is a particularly good oxidizing agent because its nucleus strongly attracts electrons to fill its valence shell. Oxidation often produces free radicals, which are very reactive. They can attack and break apart bonds in other molecules, inciting a chain reaction that is damaging for biochemical reactions.
Antioxidants are compounds that inhibit oxidation and thereby prevent the formation of free radicals. Plants and animals have many natural antioxidant systems in place to guard against this or use antioxidant vitamins such as vitamin A, vitamin C, and vitamin E. A certain amount of antioxidants is required in a well-balanced diet. However, clinical studies have been unable to prove benefits of artificially increasing antioxidant intake or antioxidant supplements.
The rise in atmospheric oxygen was far from smooth and steady (see Figure 3 below). Cyanobacteria slowly became more abundant, but there was still a significant delay in the build up of oxygen. There are several processes that would have hindered the rise in oxygen. Oxygen would have reacted with various chemicals, mainly iron, in the oceans, and these reactions would trap oxygen, prevent it from building up the atmosphere.
Oxygen may also have been taken up by microbes in metabolic pathways that generate energy. Organisms that used the oxygen to oxidize ammonia appear to have been plentiful at the time and could have been effective in the reduction of free-floating oxygen.
Other organisms produced methane as a byproduct that could have acted as a sink for atmospheric oxygen. However, organisms that are known to produce methane require nickel to carry out the necessary reactions, and concentrations of nickel were dropping. The decrease of nickel would mean less excreted methane, and would allow oxygen to begin accumulating.
The increase of oxygen in the atmosphere was poisonous for anaerobic organisms. Most life before the Great Oxidation Event was anaerobic, so the rise of atmospheric oxygen surely resulted in one of the most significant extinction events in Earth's history. The fossil record shows a mass extinction of anaerobic life around 2.4-1.6 billion years ago, coincident with the rise of aerobic life.
Anaerobic vs Aerobic Life
The rise of atmospheric oxygen coincided with the appearance of far more complicated life forms. There is every reason to believe that the rise in oxygen would have been responsible since aerobic metabolisms are more efficient.
Respiration, in biological terms, describes the process by which organisms convert nutrients into usable energy by forming ATP bonds. Respiration begins with glycolysis, wherein glucose, a sugar, is broken down to form two molecules of a compound called pyruvate along with two molecules of ATP. Without oxygen, organisms have no choice but to undergo anaerobic respiration, or fermentation. Anaerobic respiration of yeast is what makes bread rise and beer bubbly. In this scenario, pyruvate is shuttled down a pathway which produces just two molecules of ATP.
Side Note: A byproduct of anaerobic respiration is a molecule called lactic acid. Lactic acid should be very familiar to any athlete or any student who has been very late to class and had to make a run for it. When our bodies overexert themselves, we begin to use up more oxygen than we can take in. In order to produce the energy needed to keep running, the body switches to anaerobic respiration, which leads to a build up of lactic acid. Lactic acid can damage muscle cells and hinder recovery. The process of producing this lactate is also the cause of next-day muscle soreness.
In the presence of oxygen, aerobic respiration becomes possible. With the help of oxygen, pyruvate can be broken down and enters a more complicated pathway known as the Krebs cycle or the citric acid cycle (note that organisms exhibit an enormous variety of metabolic pathways; the citric acid cycle merely represents one of the more common and well understood pathways). Through the citric acid cycle, organisms can produce from 30--36 ATP from just one molecule of glucose. Though more complicated to assemble, and therefore likely taking longer to evolve, this process can be up to 18-fold more efficient than anaerobic respiration. With more energy, it is possible to carry out more biochemical processes. This may have allowed cells to become increasingly complex and trend towards the more varied, multicellular life we see today.
Want to know more: Viruses
Viruses are even more abundant than bacteria. A virus consists of three functional parts: (1) genetic material, (2) protein coat, and typically (3) an envelope of lipids outside the protein coat. For genetic material, viruses have been discovered to use both DNA and RNA. The protein coat, also known as the capsid, encases and protects this genetic material. The envelope of lipids adds an additional layer of protection.
However, the question of whether viruses can be considered life is hotly debated. Viruses have their own genetic material and are even capable of evolving through natural selection. Viruses survive and replicate by infecting a host cell. After attaching to a cell, the virus injects its DNA into the host cell. Now, the virus is capable of taking over the host cell's replication mechanisms. In doing so, the virus can now create copies of itself until it has exhausted the cell's resources. Millions of viruses can be made in this period before the cell dies and viruses escape to infect new host cells. Because viruses require the metabolism of a host cell to produce energy and reproduce, they can not be called self-sustaining. In this way, viruses fail the NASA definition of life.
Despite their differences, evidence of viruses appear wherever life does, suggesting that viruses and life evolved together. The history of viruses is traced through their DNA or RNA and has given rise to three theories on how viruses came to be.
Regressive evolution theory proposes that viruses were once components of small, parasitic cells. Similar to the idea of endosymbiosis, viruses may have begun as small structures within larger cells that over time became separated. In fact, there exist today some bacteria that, like viruses, can only reproduce in a host cell. As they evolved, these small parasitic structures regressed further from cell-like characteristics, becoming the viruses we see today. However, there is no evidence of types of cells today that could serve as an intermediary between early and present day viruses. Even the smallest cellular parasites fail to really resemble viruses at all.
Another theory is the escaped gene theory, which proposes that viruses got their start as DNA or RNA that escaped from the genome of a larger organism. Surprisingly mobile DNA has recently come to play a large role in biology. Plasmids (Figure below) are circular units of DNA and separate from the genome of an organism. They are most commonly found in bacteria and have been known to move between cells. Scientists have also recently discovered transposons, or "jumping genes," which are large segments of DNA that can move around within a cell's genome. While either of these mechanisms could have provided the genetic material for viruses, it remains unclear where the complicated capsids enclosing these genes arose from.
The exact origin of viruses, much like the origin of life, remains an open question. This vein of research is being pushed forward through analysis of viral and host DNA sequences. What we can say is that genetic comparisons show that the origins of viruses may have predated life splitting into the three different domains. Perhaps the precursors to viruses evolved from the self-replicating molecules that dominated the RNA world. Similar to RNA, viruses are capable of self-assembling in host cells.
Viruses are now well enough understood to be used as tools in biomedical research. In a process called gene therapy, researchers use viruses to inserting genes into specific cells, offering possible treatments for diseases like cystic fibrosis. Some viruses will seek out and destroy cancer cells, while leaving healthy cells alone, allowing for a highly targeted and effective treatments.
Key Concepts and Summary
All life on Earth shares common characteristic: it is carbon-based, dependent on water, has left-handed amino acids, uses ATP for energy storage and transport and has an inherited genetic code for building proteins to carry out processes in the living cell. These shared attributes are distilled into the concept of the Last Universal Common Ancestor at the root of the Tree of Life. There are three phylogenic branches on the Tree of Life: bacteria, archaea, and eukaryotes. The most complex organisms are eukaryotes, which evolved in part by the process of endosymbiosis to incorporate compartmentalized prokaryotic cells. The first cells were anaerobic - using chemical gradients for energy - and mutated into cells that used the energy of the sun for aerobic respiration. Aerobic respiration is 18 times more efficient in producing ATP than anerobic processes. Photosynthesizing cyanobacteria produce oxygen as a byproduct and are thought to be responsible for the rise of an oxygen-rich atmosphere on Earth.
Review Questions
- What are the three domains on the tree of life and how do scientists distinguish between them?
- What are the main differences between prokaryotes and eukaryotes?
- Give an example of endosymbiosis and explain what advantages and disadvantages were gained by organisms that evolved from such situations.
- How did cyanobacteria cause one of Earth's mass extinctions?
- What causes aerobic metabolism to be more efficient than anaerobic metabolism?
Exercises
- Four examples of eukaryotic organelles that evolved from endosymbiosis include (1) choloroplasts, (2) mitochondria, (3) nitroplasts, and (4) diazoplasts. Conduct the necessary research to construct a table that compares these four examples in separate rows with three different columns: (1) the kinds of organisms that contains these organelles, (2) the approximate timeframes for when the incorporation of these organelles occurred, and (3) explanations of the function of these organelles.
How did the first life emerge on Earth? At some point, abiogenesis -- the transition from chemicals to living cells -- occurred. Since there is no direct evidence of this first life, scientists must rely on experiments that try to recreate the conditions on the early Earth to see how easily the building blocks of life can assemble.
Learning Objectives
By the end of this chapter, you will be able to:
- Describe the Miller-Urey experiment and how it contributes to our understanding of how life formed on Earth
- Discuss the main ideas of the RNA World hypothesis for how life formed on Earth
- Discuss how synthetic biology informs the study of the emergence of life on Earth
- Describe how vesicles can form spontaneously from prebiotic chemistry
- Discuss how the first protocells formed and could plausibly replicate
The Building Blocks of Life
What were the conditions on the early Earth like? After the Earth formed and the period of heavy bombardment ended, chemical reactions occurred between simple molecules, leading to more complex molecular structures. How far can natural processes go toward the formation of the first biological cell? How can the non-living suddenly become alive? The study of prebiotic chemistry has yielded some important insight into these questions.
The Miller-Urey Experiment
Once biochemists understood some of the important chemistry in living organisms, a new field of synthetic biology was born. Biochemists tried to replicate the pathway for the evolution - or the complexification - of simple chemistry. Could chemicals on the early Earth provide a pathway to the formation of the first living cells?
In 1953, Stanley Miller and Harold Urey published the results of their now famous experiment: they spontaneously produced amino acids from simple elements under conditions that they believe emulated early Earth. Given the importance of amino acids and proteins for life, this experiment was viewed as an important step toward understanding the origin of life.
The experimental setup, depicted in Figure 1 above, consisted of two large flasks. One flask contained gases thought to be present in the primitive atmosphere (methane, ammonia, and hydrogen) and the other contained water, representing the ocean. Electrodes were inserted into the atmosphere flask to produce electrical sparks that would emulate lightning.
The ocean flask was heated, producing water vapor that traveled throughout the setup and interacted with gases in the atmosphere and simulated lightning. The enriched vapor then traveled through a condenser and cooled to a liquid state in a u-bend at the bottom of the setup where samples could be collected. Within a day of running the experiment, the liquid at the bottom of this u-bend had turned pink. The inaugural run of the experiment lasted for a week. From these results, Miller was able to identify five different amino acids that had been created from this simple set up of atmospheric gases, lightning, and water alone. As expected, the chirality of these amino acids included both left- and right-handed molecules, even though only left-handed amino acids are incorporated into biology as we know it today. Recent reanalysis of sealed vials have detected more than 20 different amino acids that were actually formed during that one-week experiment.
Since 1953, there have been many additional experiments that aim to synthesize the building blocks of life. Longer chains of amino acids and polypeptides have been synthesized. An impressive experiment was carried out by John Sutherland's lab in 2009. Sutherland began with a compound called 2-amino-oxazole, and using phosphorus as a catalyst, he was able to synthesize some of the nucleotides used in RNA and DNA.
Want to know more: The Murchison Meteorite - amino acids in space
On September 28, 1969, two months after Apollo 11 landed on the moon, a huge meteorite soared through the sky and landed near Murchison, Victoria, in Australia. The Murchison Meteorite is one of the most valuable and well-studied meteorites. Importantly, the incoming meteorite was highly visible. It flew through the atmosphere as a fireball and caused a noticeable tremor when it landed. This allowed for rapid recovery of the meteorite, preventing terrestrial contamination. A piece of the Murchison meteorite is shown below.

In total, more than 100 kg (the average weight of an NFL linebacker) of the Murchison Meteorite was recovered over an area of 13 square kilometers. This meteorite contained more than 70 amino acids, many of which are not known to exist naturally on Earth. There is a slight over-abundance of left-handed amino acids, which suggests that there may be a cosmic origin to the dominance of left-handed amino acids that are used by life on Earth. Every amino acid discovered on the Murchison Meteorite has since been successively synthesized using a Miller-Urey-like setup with gases, water, and simulated lightning, demonstrating that these amino acids can spontaneously form under fairly simple conditions. The Murchison Meteorite is proof that amino acids can easily form in space. Amino acids: so easy to synthesize that a rock can do it!
Even more complex organic molecules have been detected in interstellar space, a testament to how easily complex, carbon-based structures can form and remain stable. Some of these molecules have carbon ring-structures called polycyclic aromatic hydrocarbons and are similar to the organic molecules found in biological organisms. This confirms that carbon is a good base for forming complex molecules structures, including amino acids. While this gives a hint that carbon-based life may also exist on other planets, there are still many steps we don't yet understand about how to go from prebiotic chemistry to life.
Abiogenesis
Keep in mind that just because we discover processes that can create the chemicals we have identified as vital to living things does not answer the question of how life emerges. The transition from such chemicals to lifeforms and biotic systems is a process generally called abiogenesis. Many mysteries remain in the study of this question.
Once amino acids are formed, they can link together through peptide bonds to form chains (see the section on "amino acids to proteins" for a review). These polypeptide chains can fold into proteins, which perform functions essential for life. Thus, we see a natural increase in the chemical complexity of simple molecules, leading from monomers to polymers. Just as amino acids polymerize to form proteins, another crucial step in the origin of life involves the polymerization of nucleotides to form RNA (see "nucleic acids to genes"). Let's explore how the RNA world hypothesis provides insights into the early development of self-replicating systems and the foundation of genetic information.
RNA World
Proteins are needed to catalyze chemical reactions critical to the survival of cells. But, it is difficult to imagine how proteins could have been the precursor to living cells because DNA is required to manufacture proteins, presenting a "chicken-and-egg" problem. A breakthrough came when Sidney Altman and Thomas Cech discovered a class of RNA molecules called ribozymes that could catalyze their own replication. Ribozymes show that RNA, which can encode genetic information, can also act as an enzyme. This discovery was awarded the Nobel prize in Chemistry in 1989 and supported a hypothesis called the Early RNA world, where ancient life used RNA for storing genetic information and catalyzing chemical reactions. This hypothesis had been suggested in the 1960's by Carl Woese, Frances Crick and Leslie Orgel.
https://youtu.be/K1xnYFCZ9Yg?feature=shared
After watching this video, answer the following questions:
- What are three reasons why RNA is thought to have given rise to the first life?
- Explain how mutations contribute to the evolution of RNA strands.
- How can a single strand of RNA become a ribozyme? Draw a sketch of this process.
Video source: @StatedClearly
According to this hypothesis, the instability of RNA promoted mutations and natural selection eventually evolved a more stable, double-stranded DNA molecule as ribozymes were phased out. A fascinating "smoking gun" for this hypothesis is the fact that the ribosome, which assembles proteins in cells today, is a ribozyme! While the current day ribosome incorporates some proteins, none of the proteins are anywhere near the active site where chemical reactions take place. They appear to exist largely for structural support for the ribosome.
While the capabilities of RNA seem to make it the perfect candidate to explain the origin of life, RNA is a far more complicated structure and not as easy to make as amino acids. Miller-Urey experiments have been capable of synthesizing a series of smaller, very reactive molecules. When enough of these molecules are made, detectable amounts of purine and pyrimidine bases, which are essential components of nucleotides needed for RNA, can be detected. Components of nucleotides have also been discovered on meteorites like the Murchison Meteorite. However, no complete extraterrestrial nucleotides or nucleic acid chains have been discovered yet.
A breakthrough came in 2009 from British chemist John Sutherland along with Matthew Powner and Beatrice Gerland (read more here about their experiment and results). Sutherland's group determined a chemically efficient pathway for nucleotides to form that is plausible in a prebiotic environment. Rather than form each component of the nucleotide individually, which would require separate and unlikely chemical environments, they proposed a method that formed and attached a purine and a ribose sugar in the same reaction. Phosphate is used to help catalyze the reaction and incorporated into the nucleotide later. This work showed that the building blocks of RNA could form naturally on the early Earth.
Knowing that RNA nucleotides can form under prebiotic conditions, how can these nucleotides assemble into self-replicating RNA molecules? In 2009, Drs. Tracey Lincoln and Gerald Joyce created an RNA enzyme that was capable of self-sustained replication indefinitely (read their paper in Science).
Dr. Gerald Joyce discusses research in his lab on the self-replication of RNA.
After watching the video, consider the following discussion questions:
- Why are scientists interested in creating self-replicating systems?
- According to the timeline of events on Earth that Dr. Joyce shows, when did abiogenesis most likely occur on Earth?
- What is the "Replicator" that Dr. Joyce refers to?
- What biological process do these synthetic systems mimic? (cell division)
- Summarize the first method that Dr. Joyce discusses on how to build a replicating system using just prebiotic chemistry.
Video source: @MoleCluesTV
Understanding how nucleotides can assemble into self-replicating RNA molecules explains part of the puzzle of how biological life began. But how did these complex molecules organize into structures resembling the first living cells? Next, we examine the spontaneous formation of protocells, or vesicles, from fatty acids, providing a protective environment where these RNA molecules could further evolve and function.
Encapsulation and Protocells
Now that we have complex RNA molecules that can makes copies of themselves, what's the next step for forming life? Encapsulation, the action of capturing and surrounding something within a container or membrane (which is a wall made out of chemicals) is suggested by astrobiologists as being an important process in forming primitive life. Cells today are bound and regulated by membranes, which are composed of of phospholipids. It is not clear how the first phospholipids formed, but it is possible that the earliest membranes in protocells were first composed of a less complicated lipid connected to hydrocarbon chains.
Protocells can be thought of as simple cell-like structures that form spontaneously from molecules such as fatty acids that were present in the prebiotic environment. For a protocell to form, it requires that it can encapsulate all the molecules needed for that cell to function. However, if you've ever heard the old saying "oil and water" don't mix, you'll know that certain molecules don't generally dissolve in water, making them hard to encapsulate within a protocell. So, how do we get different types of molecules to all cooperate together in one protocell?
A type of molecule called an amphiphile may be the solution to our "non-mixing molecules" problem. Amphiphiles are molecules that have a water "loving" head (i.e. part of the molecule that can dissolve in water) and an oil "loving" tail (i.e. part of the molecule can dissolve in oil). This allows it to interact with both oils and waters, helping them co-exist to form protocells. Detergents such as dish soaps are amphiphilic. The hydrophilic head of dish soap will bond with water molecules and the hydrophobic tail will bond with the oils (for example, grease on a pan), therefore allowing the grease to mix with the water and be removed from the pan.
The first protocells developed from even simpler compartments which are composed of a type of molecule called lipids. An early form of protocells, called vesicles, can form naturally and can randomly encapsulate different molecules at different concentrations. Vesicles can be made in a lab!

Vesicles can form in a natural environment due to what is known as wet/dry cycling (Figure 2). When an environment is dry, the lipids form sheets (Step 1), however when they get wet again (like after it rains) the sheets can slowly bud off (Steps 2-4) and eventually form vesicles (Step 5) and encapsulate whatever material was between the lipid sheets. This material can include molecules important to the origin of the first life!
Clays like montmorillonite can also catalyze the formation of longer RNA chains by providing a surface upon which lipid molecules can become concentrated, react and polymerize. Chains of up to 50-60 nucleotides have been formed experimentally in this way.
Key Concepts and Summary
The biochemistry for life first emerged on Earth 3-4 billion years ago. Since the fossil evidence of this chemistry has long been erased, some scientists have tried to recreate the process in their labs. One of the most famous experiments was carried out by Miller and Urey in the 1950's and resulted in spontaneous synthesis of five different amino acids. More studies point to an early RNA world that evolved a molecular code - a precursor of our genetic code - to adapt to environmental conditions.
Review Questions
Summary Questions
- What was the Miller-Urey experiment? How was it set up?
- What did the results of the Miller-Urey experiment imply about the formation of the building blocks of life on the early Earth?
- What does abiogenesis mean? Is there direct evidence for abiogenesis on Earth? Explain your answer.
- What are ribozymes?
- How does the RNA World hypothesis explain how ribozymes could be a pathway to the first life on Earth?
- How has experimental work on synthetic self-replicating systems informed our ideas on the first life on Earth?
- How can protocells naturally form on the early Earth, without the need for proteins?
- How can clay minerals, like montmorillonite, facilitate the process of forming protocells?
Exercises
- Check out the Exploring Origins Project, created in collaboration with Jack Szostak's lab in 2006.
Billions of years ago the Earth was a very different place. Life seems to have emerged almost as soon as conditions were favorable after the planet had cooled and the environment allowed for the prebiotic chemistry to happen. As life proliferated, it had a profound effect on our planet affecting the environment, climate, and composition of our atmosphere while leaving behind a fossil record of its presence. In this chapter, we will explore the development of life and what evidence we have for how these changes occurred across geologic time.
Learning Objectives
By the end of this chapter, you will be able to:
- Discuss the evidence for where and when the first life on Earth may have arisen
- Describe hydrothermal vent communities
- Explain how oxygen became a key component of the Earth's atmosphere and life processes.
- Describe the different geological timeframes and how they relate to the development of life on Earth
- Describe the five major mass extinction events in Earth's history
Where did life arise on Earth?
It is unclear whether the transition from chemistry to biology occurred on the land surface of Earth or in the oceans. Those intermediate species on our planets - entities that are more than chemistry, but less than life - no longer seem to exist.
In the mid-1960s, Alexander Graham Cairns-Smith proposed that complex prebiotic molecules may have first organized around the regular crystal patterns found in minerals in clay. Cairns-Smith hypothesized that electrostatic forces in mineral crystals would help to concentrate and align specific molecules to their surface. With the help of this clay, precursors of RNA could have assembled, triggering the start of an RNA world. Tide pools have also been proposed as the site where chemistry developed the complexity needed for life. The cycles of evaporation and subsequent addition of water in tide pools might have concentrated the organic materials necessary to form life. Higher concentrations increase the likelihood that these organic materials will react and form RNA or lipids.
It is possible that, far from the rocky surface of Earth, life originated deep in the oceans when our planet was a frozen world. During the phases where Earth was covered by a thick mantle of ice, the ice may have protected organic compounds beneath the ice from the damage of impacting asteroids or ultraviolet radiation from the sun.
Deep-sea hydrothermal vents are hot spots that release gas from the Earth's interior. DNA sequencing suggests that LUCA was a thermophilic microbe and deep sea vents might have been ideal locations for nurturing that early life. At first glance, this seems an inhospitable place for life. These vents are located in some of the darkest, highest pressure environments on our world. However, the gas that is released from hydrothermal vents creates a natural chemical gradient that can be used by living cells to generate the energy needed for metabolism. In deep hydrothermal vents, this chemical gradient flows around the rocks surrounding the vent and creates nooks where organic compounds can collect and reach higher concentrations. Minerals that are capable of acting as catalysts have been found in deep sea vents. Therefore, hydrothermal vents seem to provide the needed ingredients: high concentrations of organic compounds, natural catalysts, and a powerful energy source in the absence of sunlight. Today, extremely varied ecosystems are found around these vents.

When did life arise on Earth?
The evidence for timing the initial rise of life on our planet is ambiguous. The most ancient evidence has been destroyed as the first forms of life would have been single-celled organisms that did not leave behind fossil remains. However, suggestive evidence from biology, chemistry, and geology supports estimates that life arose on Earth between 3 to 4 billion years ago. Since the Earth formed about 4.56 billion years ago, the early appearance of life hints that the evolution from chemistry to life may be statistically probable. If so, this greatly increases the odds that life has also evolved elsewhere.
Carbon isotopes
The earliest line of evidence for timing the rise of life comes from carbon isotopes. Carbon naturally occurs in three isotopes, always with 6 protons, but with either 6, 7, or 8 neutrons, which are annotated 12C, 13C, and 14C respectively. The superscripts indicate the atomic mass number, or the total number of protons and neutrons in an element. Of these isotopes, 14C will undergo radioactive decay with a half life of 5730 years. However, 12C and 13C do not decay and therefore, the ratio of 12C to 13C is constant over time on the Earth. However, life preferentially incorporates the lighter 12C, rejecting 13C. Therefore, a low ratio of 13C to 12C offers a tentative suggestion that organic material existed and that isotopic imbalance can be incorporated into the metamorphic structure of the rock.
Why does life prefer to use 12C? While the chemical reactivity of an atom is predominantly driven by the electron configuration, more massive isotopes tend to have slightly slower reaction rates. That slight edge in the speed of reaction rates is enough of an advantage to favor the uptake of carbon-12 over carbon-13 in organic biochemistry.
Zircon crystals are commonly used to assess ages in very ancient geological records because they are very durable minerals, resistant to both heat and corrosion. Trapped minerals can be preserved when zircons form. A group of scientists from the University of California, Los Angeles studied 10,000 zircons gathered from western Australia. Of these ten thousand zircons, one contained a graphite inclusion, a compound composed entirely of carbon atoms.

Radiometric dating showed that this zircon crystal was 4.1 Gyr old and the carbon inclusion exhibited a larger ratio of 12C to 13C. Was this the chemical stain of primordial life, dating back to 4.1 Gya? On Earth today, this would be a good indicator of organic material. But, interpreting this result from so long ago is more controversial.
Stromatolites
Ancient stromatolites offer a more secure timeline for the emergence of life. These fossilized structures are found in shallow waters and look like modern structures formed by cyanobacteria. The oldest stromatolites have been found in South Africa and Australia and date back to the early Archean Period between 3.2 - 3.5 Gya. By the end of the Archean and throughout the Proterozoic geological periods, stromatolites appear to have been abundant and formed the first reefs.

Stromatolites today are composed of layers of microbial mats of photosynthesizing cyanobacteria, as shown in the YouTube video below. Photosynthesis depletes carbon dioxide in the water, precipitating calcium carbonate deposits, which along with other sandy sediments, is trapped in the sticky bacterial film. The bacterial colonies grow upward towards better exposure to the sun, and over time the layers of bacterial film and mineral precipitates build up to form distinctive layered stromatolites.Similar stromatolite structures are formed today.
We guess that ancient stromatolites were formed through biological processes, since we observe this behavior in microbes today. The processes required to make these structures seem to require microbes that are already quite complex and capable of photosynthesis. Actual first life then, likely to be a more primitive organism, would have existed even earlier than these ~3.5 Gyr old structures.
Microfossils
The most direct evidence for life comes in the form of microfossils, fossils preserving micro-organisms that may have been among the first living creatures on Earth. The most convincing microfossils date back to approximately 3 billion years ago. However, these are difficult to identify both because rocks undergo erosion over time and because the structures that resemble microfossils might actually be formed by nonbiological processes. Many supposed microfossils turn out to be false positives after careful chemical analysis. Though the discovery of a microfossil is an unmistakable mark of life, it is easy to be fooled. The Figure below gives you a good idea of the scant information content in microfossils.

The Age of Life
Evolution and Extinction
On geological time scales, time is organized into eons, eras, and periods. There are four main eons subdivided into different eras. The eras are in turn split into different periods. The current eon, the Phanerozoic Eon (541 Mya through today), is known as "The Age of Life." The Cambrian Period is the earliest period of the Phanerozoic eon, lasting from 540 to 500 Mya. The events leading up to this period set the stage for an explosion of complex life. Changing atmospheric oxygen concentration allowed for more efficient aerobic metabolism and increasingly complex life forms.
The transitions between different geologic periods are defined by changes in the fossil record with many of the most dramatic changes occurring during mass extinction events, defined as a period of time when the rate of species going extinct is increasing with respect to the rate at which new species arise. Throughout the Phanerozoic era, there were 15 documented major extinction events. Five of these were major mass extinction events where more than half of all species on Earth at the time were lost. While mass extinctions are devastating, they do serve to encourage diversity. Had the dinosaurs not been eliminated 65 Mya, there may never have been such a successful emergence of mammals. The frequency of life in the Universe is a function of how often it arises, how often it survives, and how long it endures after evolving. In this way, the frequency and intensity of mass extinctions control the frequency of life.

Precambrian Life
The Proterozoic Eon began 2.5 billion years ago and set the stage for Phanerozoic life. From the geologic record, we know that oxygen levels were low before the Proterozoic. Therefore, microbes from the start of this era would have primarily been anaerobic chemotrophs, producing energy through chemical pathways.
Want to know more: Metabolic Lifestyles
Organisms can be identified according to the source of carbon they use for metabolism as well as their energy source. The prefixes auto- (“self”) and hetero- (“other”) refer to the origins of the carbon sources various organisms can use. Organisms that convert inorganic carbon dioxide (CO2) into organic carbon compounds are autotrophs. Plants and cyanobacteria are well-known examples of autotrophs. Conversely, heterotrophs rely on more complex organic carbon compounds as nutrients; these are provided to them initially by autotrophs. Many organisms, ranging from humans to many prokaryotes, including the well-studied Escherichia coli, are heterotrophic. All pathogens are heterotrophic because their carbon source is their host.
Organisms can also be identified by the energy source they use. All energy is derived from the transfer of electrons, but the source of electrons differs between various types of organisms. The prefixes photo- (“light”) and chemo- (“chemical”) refer to the energy sources that various organisms use. Those that get their energy for electron transfer from light are phototrophs, whereas chemotrophs obtain energy for electron transfer by breaking chemical bonds. There are two types of chemotrophs: organotrophs and lithotrophs. Organotrophs, including humans, fungi, and many prokaryotes, are chemotrophs that obtain energy from organic compounds. Lithotrophs (“litho” means “rock”) are chemotrophs that get energy from inorganic compounds, including hydrogen sulfide (H2S) and reduced iron. Lithotrophy is unique to the microbial world.
The strategies used to obtain both carbon and energy can be combined for the classification of organisms according to nutritional type. Most organisms are chemoheterotrophs because they use organic molecules as both their electron and carbon sources. Table 1 below summarizes this and the other classifications.
| Classifications | Energy Source | Carbon Source | Examples | |
|---|---|---|---|---|
| Chemotrophs | Chemoautotrophs | Chemical | Inorganic | Hydrogen-, sulfur-, iron-, nitrogen-, and carbon monoxide-oxidizing bacteria |
| Chemoheterotrophs | Chemical | Organic compounds | All animals, most fungi, protozoa, and bacteria | |
| Phototrophs | Photoautotrophs | Light | Inorganic | All plants, algae, cyanobacteria, and green and purple sulfur bacteria |
| Photoheterotrophs | Light | Organic compounds | Green and purple nonsulfur bacteria, heliobacteria | |
Source: LibreTexts Biology
The Proterozoic Eon was likely a time of rapid diversification of life. Today, there are systems of proteins that run checks during the replication of DNA to minimize transcription errors. However, these types of proteins are less common in prokaryotic microbes, which were common during the Proterozoic Era. A higher rate of mutations would have accelerated natural selection and driven a greater diversification of organisms. One of those mutations enabled photosynthesis, a more efficient process of respiration, resulting in an explosion of complex multi-cellular organisms that appeared at the start of the geologic era known as the Cambrian Explosion.
The Cambrian Explosion
At the time of the Cambrian explosion, there was an exponential increase in the number and complexity of organisms. Complex organisms likely preferred living in the oceans at first, where there was easy mobility and easy access to nutrients. Even very shallow levels of water provide protection from damaging UV radiation.
The earliest evidence of complex, land-based life comes from early land plants that begin to appear in the fossil record around 475 Mya. DNA evidence suggests that these plants evolved from algae, a general term for aquatic, photosynthetic organisms. It is a likely transition given that many breeds of algae prefer growing in shallow water to begin with. Algae adapted protections, such as thicker cell wells in order to survive dry spells, that would have been beneficial in the transition from water to land.

With other organisms still constrained to the water, land plants flourished and grew large in size. The lack of competition further allowed for increasing complexity: the development of root systems and tubes to transport water and nutrients throughout the plant. Photosynthesizing land-based plants had abundant energy from the Sun.
The Carboniferous Period
Forests began to cover the lands and dead organic matter began to pile up and decompose among the plants. Millions of years later, this organic matter would be compressed into coal, earning this period the name "carboniferous," which means "coal carrying'' in Latin.
The Carboniferous period began roughly 360 Mya and lasted about 60 million years. It was marked by an era of giantism. The fossil record from early in this period is rich in ocean and fresh water organisms. Land-based organisms appeared in the middle to later part of the period. The first terrestrial organisms were supersized insects and amphibians. By the middle of the Carboniferous period, adult amphibians were up to 6 meters long and developed the scaly skin typical of lizards by the end of the period. The Arthropleura, which resembles a 2.6-meter long millipede, proliferated during the late Carboniferous period and remains the largest-known land invertebrate ever discovered.
The Carboniferous period also gave rise to the largest-known flying insect: the Bolsover dragonfly. The Bolsover dragonfly looks nearly identical to the dragonflies common today, but with a wingspan of 30 cm - six times larger than a modern dragonfly. With a wingspan this large, the Bolsover dragonfly would not be able to fly in today's atmosphere, with 21% oxygen. This has been used to suggest that atmospheric oxygen levels may have been as high as 30% during the Carboniferous period. Increased levels of oxygen as well as a generally moister environment would explain the large size of organisms at the time. Respiration was likely more efficient so that organisms could produce more energy and sustain their larger sizes.

As life continued to evolve and diversify, ecosystems began to resemble the types of settings we are familiar with today. This penchant for giantism continued into the Mesozoic era, which spanned from 252 to 66 Mya and is known as "the Age of the Dinosaurs.'' The Cenozoic era that followed saw the emergence of mammals. The end of each period during the Phanerozoic Eon was marked by mass extinction events that completely upended the biological landscape of the time.
Great Oxidation Event
The Great Oxidation Event is alternatively called the Oxygen Catastrophe depending on whether you ask aerobes or anaerobes. It marks a drastic change in the Earth's atmospheric composition that occurred about 2.5 Gya.
An increase in atmospheric oxygen is seen in the geological record as a sudden onset of oxidation of iron occurred. Iron oxidation coincides with the geological evidence for glaciation 2.5 billion years ago. Oxygen is not a greenhouse gas, but it is a highly reactive species that would have interacted with the primitive methane atmosphere produced by volcanic outgassing. Methane is a powerful greenhouse gas. As oxygen levels rise, oxygen would react with methane to form carbon dioxide and water. This mechanism for removing methane would have produced the significant cooling and widespread glaciation. An outcrop of ancient Canadian rocks shows evidence of a glaciation event between different rock layers. Below (and therefore older than) this glaciation event, the rocks are consistent with low levels of atmospheric oxygen. Younger rock above the glaciation layer show significantly higher oxidation. Radiometric dating of the rock show that the increase in atmospheric oxygen, or the Great Oxidation Event, occurred 2.45 billion years ago.
The addition of oxygen to the atmosphere is believed to be the result of photosynthesis from cyanobacteria. Oxygen did not accumulate immediately because of the enormous number of sinks, including reduced gases and minerals that would have overwhelmed its production. Those sinks for oxygen are now largely saturated; respiration of anaerobic organisms (including us) and decay of organic material take up most of the oxygen produced today.
As the atmosphere cooled, a positive feedback loop ensued. Water vapor, which is another important greenhouse gas, would have condensed out of the atmosphere. The Earth eventually froze over and became what is known as ''snowball Earth." Volcanic activity would have continued during this phase, releasing internal heat along with carbon dioxide into the air. With a sufficient amount of CO2, the greenhouse warming would have melted the ice, allowing the Earth to recover from its frozen state. Assuming present rates of volcanism, the necessary build up of CO2 would take 10 million years. Evidence in the rock record suggests that one snowball Earth event occurred around 2.2 billion years ago and another series of snowball Earths that happened just prior to the Cambrian Explosion.

Mass Extinctions
Though organisms change and evolve, the most dramatic changes occur during mass extinction events, defined as a period of time when the rate of species going extinct is increasing with respect to the rate at which new species arise. Throughout the Phanerozoic era, there were 15 documented major extinction events. Five of these were major mass extinction events where more than half of all species on Earth at the time were lost.
Mass extinctions can be either gradual or sudden. The process of extinction follows five different phases:
- First is the extinction phase, which features a rapid decrease in biotic diversity.
- The second phase is the survival phase. Diversity is at a minimum here, but there is little further extinction. Organisms that survive past the second phase are known as the holdover taxa.
- Third is the rebound phase. Diversity begins to slowly increase again as ecosystems recover from the extinction event. The term progenitor taxa is used to describe species that have survived and now provide the evolutionary seeds for future organisms.
- The fourth phase, the expansion phase, is marked by a rapid increase in diversity due to the evolution of new species. The increase in diversity is helped in part by the opportunities and voids left by the many species lost during the first phase.
- The last phase, a recovery interval, is marked by a long period of environmental stability as diversity continues to rise. Disaster taxa describe species that proliferate most successfully following an extinction event. They are typically small and simple, hardy rather than complex and therefore capable of surviving extinction events.
Evidence for extinction events come from sweeping changes in the fossil records at different geological changes. However, fossils provide an incomplete and often confused record of past life. Roughly one third of organisms feature calcified parts that could be turned into fossils. The erosion of sedimentary rock may also obscure how old a fossil really is. Our understanding of mass extinctions is therefore inversely proportional to their age (older events have less certain evidence), and is proportional to the extent of the extinction. Extinction events that caused a greater loss in diversity are easier to categorize.
While mass extinction events threaten the very presence of life on Earth, they also lead to enhanced evolutionary diversity. It is important to understand these ubiquitous pressures on life, as similar events are likely to occur on every planet. If life is easily and regularly eliminated through frequent extinction events, then it may make finding surviving life in the Universe much harder.
The Ordovician-Silurian (O-S) Extinction
The Ordovician-Silurian (O-S) extinction, which occurred 450-440 Mya, describes two events that together resulted in the loss of nearly 70% of the worlds species at the time, making this the second-largest mass extinction event. The extinction event had a global effect and particularly affected marine life, where it is estimated that nearly 85% of species were lost.
The event was most likely caused through sudden climate changes. The timeline matches up with a shift in the then super-continent, Gondwana, into the south pole. As Gondwana passed over the south pole, it began to form ice caps across its surface. This shift also exposed more land, causing a drop in CO2 levels through weathering and cooling the planet.The cooling of the Earth led to the formation of glaciers, which locked up waters from the ocean. This, in turn, caused sea levels to drop, exposing and destroying shallow-water habitats along continental shelves. Evidence for glaciation during this time period has been found in the Sahara Desert. The combination of glaciation and cooling is thought to be the main causes of the O-S extinction.
The event ended when volcanic out-gassing of greenhouse gases increased the atmospheric temperatures enough to melt the glaciers and stabilize sea levels. The rebound phase of the O-S extinction resulted in increased biodiversity on the re-flooded continental shelves. However, recovery species in the ocean and land plants of the time were initially less complex.
The Late Devonian Extinction
At least 70% of all species were also lost during the Late Devonian extinction, which lasted from 375-360 Mya. There is some evidence that this extinction event was actually a series of seven,distinct extinction pulses. As with the O-S extinction, marine life was particularly hard hit.
The Late Devonian extinction is thought to have been caused by changes in the sea level, triggered by global cooling combined with acidification and oxygen depletion in the oceans similar to the O-S extinction, changing sea levels, or oceanic volcanism.
The rapid evolution of more complex plants from 30 cm up to 30 m during this period likely contributed to the oxygen depletion in the ocean. The increase in plant mass required the development of extended root and vascular systems in plants. These roots would have stabilized increasingly deeper layers of soil, causing a change in the chemical composition of which nutrients were run off into rivers, lakes, and eventually the ocean. This effect could have decreased the amount of oxygen in the oceans as well as reduced CO2 levels, which would have contributed to global cooling.
Less oxygen in oceans also caused organic matter to be better preserved, preventing organisms from decomposing and recycling their nutrients. Instead, many organisms formed into oil, which was absorbed by the porous reef rocks common in the area. These oil deposits remain a major source of oil in America today.
The End Permian Extinction
The End Permian extinction (or Permian-Triassic or P-T extinction) occurred about 252 mya and is the single largest mass extinction event ever recorded. It is nicknamed the "The Great Dying." Approximately 96% of all marine life was lost along with over 70% of land species, including everyone's favorite prehistoric creature, the trilobite.

The cause of such a large extinction was most likely the final stages of the break up of Pangea. The shifting of continents caused molten rock to be exposed and increased volcanic activity, releasing volatile carbon, methane, and SO2. The effect is actually quite similar to that of burning fossil fuels today. The Earth began to heat up under this new blanket of greenhouse gasses; it is thought that the temperature of the entire ocean increased by 2°C.

Warm ocean water transported heat to the poles, which in turn began to melt and release more greenhouse gases that had been frozen before. As the amount of CO2 increased in the atmosphere, it likewise began to dissolve and accumulate in the oceans, causing oceans to acidify. Furthermore, the warmer ocean water was unable to hold as much oxygen. The combination of increasing acidity and decreasing oxygen likely gave rise to the grievous destruction of marine life during the P-T extinction.
The End Triassic Extinction
The End Triassic extinction occurred 200 Mya, with 70-75% of all species becoming extinct. Most of the large amphibians common at the time were eliminated, and dinosaurs were left with little competition, allowing them to flourish in the following Jurassic period.
The end Triassic extinction event was sudden, lasting less than 10,000 years. Many causes have been proposed, but none are definitive. Gradual climate change can explain some of the observed properties of the extinction. An asteroid impact could also explain some of the properties of the extinction, but a crater of the appropriate size and age has yet to be found. The extinction may also have been caused by an unlucky sequence of volcanic eruptions increasing the release of carbon dioxide and sulfur and triggering climate change. Increased amounts of volcanic compounds can be found in the rock layers from this period.
The Cretaceous-Paleogene (K-T) Extinction
The Cretaceous-Paleogene (K-T) extinction occurred 66 Mya, and 75% of species became extinct, including all land-bound dinosaurs. Dinosaur fossils are only ever present before this time in the rock records. The extinction had a surprisingly variable impact, with dinosaurs being greatly affected while mammals and birds survived to ultimately become the predominate life forms on the planet.

The rock record from this time exhibits an unusual amount of iridium with gold, osmium, and platinum. These elements are relatively rare on Earth, but are commonly found in meteorites. The amounts of these rare metals could have been contained in an asteroid that was 10-15 km in diameter. The energy from such an asteroid would be equivalent to the force of 100 million hydrogen bombs. Other evidence includes shocked quartz and spherical rock droplets, which require both high temperatures and great pressure to form. Widespread soot deposits also suggest enormous fires across land masses.
The Chicxulub crater, buried beneath the Yucatán Peninsula in Mexico has both the appropriate age and size that are expected of the asteroid that could have caused the devastation seen during the P-T extinction event. The crater stretches 150 km across and is approximately 20 km deep.
Extinctions and Life
While mass extinctions are devastating, they do serve to encourage diversity. Had the dinosaurs not been eliminated 65 Mya, there may never have been such a successful emergence of mammals. The frequency of life in the Universe is a function of how often it arises, how often it survives, and how long it endures after evolving. In this way, the frequency and intensity of mass extinctions control the frequency of life. On Earth, there have been 15 major mass extinctions in the last 500 million years. Five of those 15 eliminated more than half of all species on the planet.
Key Concepts and Summary
The deep oceans may have been one of the most stable environments on Earth, immune to the wild swings of conditions on the surface of the planet. This has led to speculation that the first life may have emerged in deep-sea thermal vents with strong chemical gradients to energize biochemistry. The evidence for life has been captured in the geologic record and unsurprisingly is more ambiguous the farther back in time we go. There is circumstantial evidence for life in the ratio of carbon isotopes in outcroppings of rocks and in zircon crystals that are about four billion years old. Fossilized layered structures date back to about 3.2 billion years ago and are reminiscent of stromatolite mats that are abundant today. Microfossils that are 2 - 3 billion years old and have structures that appear to be imprints of microbial life. After the Cambrian explosion 540 million years ago, the geologic record becomes clear, recording the rise and fall of species at different spatial depths that correspond to different look-back times. This evolution is punctuated by five major mass extinction events, each of which eliminated more than half of all species on the planet.
Review Questions
Summary Questions
Exercises
A unit of power (or luminosity) equal to 1 Joule per second
A Sixth Mass Extinction: The Anthropocene
The geological record contains information about the dramatic changes that have occurred on our planet. The lessons from the five known mass extinctions show that the impact to climate and life is greatest when change is more sudden.
During the middle to late Cretaceous period the overall temperature of the Earth increased by 5°C. However, this change took place slowly, over the course of millions of years. The warming is thought to have been caused by the steady release of greenhouse gases from volcanic eruptions. Because the rate was so slow, the oceans were able to absorb the greenhouse gases without causing significant acidification. As a result, most life was able to adapt or migrate and survive.
In contrast, during the Palocene-Eocene thermal maximum (PETM) temperatures rose by 0.025°C every 100 years. In just a few thousand years, the temperature had increased by 5°C. The warming was caused by a combination of volcanoes, methane release from the seafloor, and peat/coal fires. As heating progressed, the permafrost began to thaw, leading to the release of even more greenhouse gases. The oceans began to acidify, leading to the extinction of many organisms living on the seafloor.
Today, humans are exerting a pressure on the Earth system so extreme that it is triggering the start of a new geological epoch: the Anthropocene. Modern-day global warming appears to be occurring at a rate of 1-4°C per 100 years, orders of magnitude faster than the rate during the PETM. The Earth is expected to gain 2-10°C in the next 100 years. There have been times in the history of the Earth when there was as much - or perhaps more - carbon in the atmosphere. There has probably never been a time in the past 4.5 billion years when the rate of change of carbon in the atmosphere has been so rapid. We have pulled coal from the carboniferous period out of the ground and we are burning it to fuel our industrial revolution. Like it or not, our mark will be left in the geological record of out planet; the first stage of a mass extinction, a rapid decrease in biodiversity, has already started.
Side Note: Sixth Extinction
Since the industrial revolution, we have had a front-row seat to the sixth major mass extinction. Human activity has led to widespread habitat loss, climate change, pollution, and rising ocean acidity. Vertebrates are dying out at a rate estimate to be a hundred times faster than they would be without human interference. Amphibians that interact with polluted land and water are most impacted, with a current extinction rate tens of thousands times greater than the background extinction rate. Rising temperatures are threatening most species with changes that are now happening on the timescale of generations rather than thousands of millions of years as before.
The Energy Budget for Earth climate
An "airless Earth" will absorb higher energy photons from the Sun in the top 1-meter of soil and then re-radiate that energy back into space in the form of infrared radiation. The incoming energy comes from a 5500 K black body - the Sun - and an airless Earth would radiate as a blackbody with a temperature of about 253 K .

However, it is more difficult for the incoming solar energy to escape when the Earth has an atmosphere. Molecules with three atoms are particularly effective at absorbing the infrared radiation released from the surface of the Earth. The absorbed energy is transformed into energy for vibrating and bending the molecular bonds of these greenhouse gases. Ultimately, energy is re-emitted and adds heat into the atmosphere. The energy budget (incoming higher frequency solar energy and absorbed-released lower frequency energy) is summarized in the image below. Not all of what comes in is released again.

The solar flux above the Earth's atmosphere is 1360 Watts per square meter. However, only one hemisphere of the Earth faces the Sun. Furthermore, the surface of the Earth is curved not flat, so there is a geometric reduction, such that an average of 340 Watts per square meters is intercepted above the atmosphere over the entire surface of the Earth. Without greenhouse warming from the Earth's atmosphere, our planet would be a frozen world. The presence of methane, water, carbon dioxide, and other natural greenhouse gases transformed the Earth to a habitable world with oceans of liquid water.
Anthropogenic climate change
In 1896, the Swedish scientist Svante Arrhenius calculated that the burning of coal by humans would add carbon dioxide to the atmosphere causing a small amount of warming. This was a curiosity, but it was hard to imagine that the then-world population of 1.6 billion people would have much impact. By the 1930s, the precise monitoring of climate for military purposes provided data that showed that the global mean temperature on Earth was indeed rising. Some people speculated that changes in the solar irradiance would also affect the temperature of Earth. Whatever the underlying reason, by the 1960s scientists estimated that the planet would warm by a few degrees over the coming century. Even though the physical feedback was poorly understood, scientists in the 1980s agreed that increasing the amount of carbon dioxide would increase the temperature of our planet. Data from ancient ice cores showed that a doubling of carbon dioxide (CO2) was correlated with a 3 degree rise in the global average temperature. Climate research intensified. With faster computers, it is now possible to carry out sophisticated simulations of the effect of rising carbon dioxide on the temperature of Earth.
There are some effects of greenhouse gases outlined in the 2018 U.S. National Climate Report that are undisputed by scientists.
- The concentration of carbon dioxide (CO2) has increased from pre-industrial levels to 391 ppm in 2012 and is now rising at a rate of 1.8 ppm per year.
- The present level of CO2 is higher now than at any time in the last 15 million years. This information comes from paleoclimatic and geological evidence.
- Global mean temperature is about 1 degree C above pre-industrial levels and increasing.
- The oceans have also been warming; 90% of the excess heat from increased greenhouse gases is stored in the oceans.
- The loss of sea ice has tripled in the past 20 years.
- Sea levels have risen by about 20 centimeters around the world and are now increasing at a rate of about 3 cm per decade. Melting from the continents of Greenland and Antarctica could add another 15 cm by the end of the 21st century.
- There has been a tenfold increase in extreme heat waves since the 1950s.
The consequence of 2-4 degrees of warming
Projecting the risks forward in time, every degree of warming exacerbates the stress on our planet and on civilization. The greatest warming occurs over land, bringing extreme heat waves, widespread drought, and increasing fires and deforestation. The resulting large-scale displacement of populations threatens security and economic systems. The higher temperatures and flooding of low-lying delta areas reduce crop yields and increase malnutrition and disease. Increasing carbon dioxide results in acidification that threatens marine life and ecosystems. A large-scale loss of biodiversity is already occurring with the loss of ecosystems. The predictions are unacceptably dire if the global temperature increases by four degrees Celsius, as predicted for 2100 if we continue business as usual. Despite decades of warnings by climate scientists, we continue to miss our targets for reducing the use of the fossil fuels that are directly responsible for increasing greenhouse gases (carbon dioxide and methane).
The global climate data are unequivocal. We know what to do to mitigate climate change. But, this is a problem that we have to solve together. Will humanity answer this call to action?
Much of astrobiology is motivated by a desire to understand the origin of things: to find at least partial answers to age-old questions of where the universe, the Sun, planets, the first life on Earth, and we ourselves came from. On Earth, chemicals on the early surface at some point made the transition from non-living to living -- the process of abiogenesis. We can take a step back and ask how the solar system formed and why the terrestrial and jovian planets ended up with their initial compositions. Then we can see if the model for how our solar system formed can describe exoplanetary systems as well.
Learning Objectives
By the end of this chapter, you will be able to:
- Explain how stars are formed in giant molecular clouds.
- List the main properties of the planets in our solar system.
- Describe the main steps in forming the solar nebula.
- Discuss how the solar nebula theory explains all of the properties observed in our solar system
- Discuss evidence that supports the nebular theory for forming solar systems.
Star Formation
At the heart of our solar system is a star. Stars of any type can host a planetary system and the most common type of stars in our galaxy are small, cool red dwarfs. The ultimate fate of a star, from birth to death, are determined by its initial mass. Where does this mass of material that forms a star come from? The answer is from huge clouds of gas and dust called Giant Molecular Clouds (GMCs).
Spiral galaxies like the Milky Way contain about 1000 GMCs, most located in the spiral arms of the galaxy. GMCs are among the largest objects in galaxies, with physical dimensions spanning 10 light years up to 1,000 light years. GMCs are cold enough for molecules to remain stable and are made of hydrogen (mostly H2), helium and other molecules as well as dust particles made of carbon, iron and silicates. All of the main building blocks for life -- carbon, hydrogen, oxygen and nitrogen (CHONs) -- were present in the cloud that collapsed to form our solar system. Ultimately, this concentration of gas and dust collapses to form hundreds of thousands of new stars and planets.

Side Note. Roughly half of the stars in our galaxy emerge from a GMC gravitationally bound to another star. Such stars are called "binary" stars and they can have orbital periods as short as an hour or as long as thousands of years. The O and B type stars are exceedingly rare. However, roughly 75% of these massive stars are gravitationally bound in binary star systems. In contrast, about 60% of stars like our Sun have a gravitationally-bound stellar buddy and fewer than 40% of the smallest stars - the low mass M dwarfs - have binary stellar companions.
A GMC is stable when the force of gravity, which tries to collapse the cloud, is balanced by the pressure from random motions of molecules in the cloud. Gravity is a force that pulls objects together and only depends on the mass of the objects and how far away from each other they are; the closer the objects, the stronger the gravity. A shock wave from a nearby star exploding as a supernova or some other event that compresses the density of the cloud can cause the cloud to collapse and fragment into smaller clumps. These smaller clumps are the seeds of solar systems, and it is the mass of these individual clumps that determines the fate of the star that forms at its center.
As a clump contracts, the density and the collision rate between particles increases so that the core of the cloud begins to heat up. At this point, the core of the cloud is a protostar with a temperature of a few thousand degrees, embedded in an obscuring shroud of cooler gas. As the clump contracts, it spins up and flattens and the object becomes a protoplanetary disk, or proplyd.
Want to know more - star formation in spiral arms of the Milky Way
It is interesting to map out the location of star formation. Stars are distributed nearly uniformly in the disks of spiral galaxies, but you would never know it looking at the composite image of the Whirlpool galaxy. The bright spiral arms are regions of enhanced density where new star formation is triggered. Because the massive stars are the most luminous, they light up the arms during their relatively short lives and are never seen far from the molecular clouds. The youngest stars are born in clusters located along the spiral arms of the galaxy and the giant molecular clouds are seen as dark dust lanes along the trailing edge of the spiral arms. The spiral density waves that cause turbulence and large scale coherent structure are observed only in flattened galaxies but the forcing mechanism that causes the spiral density waves is complicated and still controversial.

The Whirlpool Galaxy presents a view of dust lanes and massive stars tracing out spiral arms. Would you guess that there are more stars along the spiral arms? If so, you would be wrong... so what is going on? The spiral structure is a region of higher gas density, where bright, young stars are forming.
Solar System Observations
Any theory of solar system formation must be able to explain all of the properties of existing solar systems. This includes not only our solar system but the properties of exoplanetary systems in our galaxy. We will stay focused on first explaining the properties of our own solar system, via the solar nebula model. The video below was made when astronomers had only detected about 500 exoplanets (now there are more than 5000) and summarizes the properties of objects in our solar system.
Video credit: @NatGeo
https://youtu.be/libKVRa01L8?feature=shared
After watching the video clip above or doing some research, make a list of similarities in the properties of the planets in our solar system. For example, do all planets orbit around the Sun in the same direction?
Now list any unusual patterns that you observe. Are comets and asteroids found at random distances or in specific locations?
Show Answer
- There are two types of planets: small, rocky planets (terrestrial) and large gas giants (jovians)
- Terrestrial planets are located in the inner part of the solar system; jovian planets in the outer part of the solar system
- Terrestrials are denser than jovians
- All of the planets revolve around the Sun in the same direction and the rotation ("spin") of the Sun has the same direction as the orbital revolution of planets.
- The orbital planes of the planets are inclined by only a few degrees with respect to each other. In other words, planets all revolve around the Sun in approximately the plane of the Sun’s own rotation.
- All planets rotate on their axes with different tilts
- The solar system contains large numbers of asteroids and comets that are at specific distances
- All jovian planets have moons and rings; no terrestrial planets have rings and only Earth and Mars have moons.
We can organize the properties into three main categories: motion constraints, size and chemical constraints, and distance constraints. We call them constraints because they place restrictions on our theories; unless a theory can explain the observed facts, it will not survive in the competitive marketplace of ideas that characterizes the endeavor of science. Let’s take a look at these constraints one by one.
There are many regularities to the motions in the solar system. All eight planets revolve around the Sun in the same direction and approximately in the plane of the Sun’s own rotation (the blue orbits in Figure 3). If looking down at the solar system from a vantage point above it, this direction is counterclockwise. With the exception of the comets and other objects orbiting beyond Neptune, such as dwarf planets, the motions of the system members define a flattened disk or pancake shape.

Side Note: Pluto was reclassified from a planet to a dwarf planet in 2006. The reason for Pluto's "demotion" is that it has not cleared the neighborhood around its orbit, meaning it is orbiting the Sun with a lot of other material in the Kuiper Belt.
Most of the planets rotate in the same direction as they revolve, with the exception of Venus which rotates clockwise. Some planets have no tilt to their rotation axes while other are tilted at seemingly random angles: the Earth's axis is tilted by 23.5°, for example. Figure 4 summarizes the different tilts.

There are two main types of planets: rocky terrestrials (Mercury, Venus, Earth and Mars) and gas giants (Jupiter, Saturn, Uranus and Neptune). The terrestrials are smaller in both mass and radius than the jovians. By chemical constraints, we mean that the different types of objects in the solar system -- terrestrial planets, jovian planets, asteroids, and comets -- all have different chemical compositions. The four terrestrial planets are rocky worlds with a solid crust made of rocks containing mostly silicate minerals (e.g., granite and slate). Although the jovian planets have rocky cores, they are vastly dominated by the very light gases hydrogen (H) and helium (He). These chemical differences are reflected in the relatively high densities of the terrestrial planets compared with the jovians. There are sub-trends within the trends as well that need to be explained. For example, the Moon and Earth have some similarities in their chemical compositions but some differences, too.
The terrestrial and jovian planets are at different locations in the solar system: the terrestrial planets are in the inner solar system while the jovians are in the outer solar system. In general, asteroids are found in a belt in between Mars and Jupiter, and comets are found out past Neptune in the Kuiper Belt.
In the next section, we describe the solar nebular theory for how our solar system formed, and explain how each of the constraints described above are successfully explained by this theory.
The Solar Nebula Model
The cloud of gas and dust that collapsed to became our solar system is called the solar nebula. Our solar system was formed from this cloud beginning 4.6 billion years ago. The figure below shows an artist's sketch of material in the solar nebula orbiting the protosun: many collisions occurred during this time and eventually material clumped together into larger objects: gas and dust grains stick together via first electrostatic forces and then gravity to form clumps, these clumps accrete more material through their increased gravitational pull and become planetesimals, and these planetesimals further grew to become protoplanets and eventually planets.
As the solar nebula collapsed under its own gravity, material fell toward the center, where things became more and more concentrated and hot. Increasing temperatures in the shrinking nebula vaporized most of the solid material that was originally present. At the same time, the collapsing nebula began to rotate faster through the conservation of angular momentum, which tells us that a rotating object will spin faster as it gets smaller (or spin more slowly as it gets larger). Like a figure skater pulling their arms in to spin faster, the shrinking cloud spun more quickly as time went on. Now, think about how a round object spins. Close to the poles, the spin rate is slow, and it gets faster as you get closer to the equator. In the same way, near the poles of the nebula, where orbits were slow, the nebular material fell directly into the center. Faster moving material, on the other hand, collapsed into a flat disk revolving around the central object (Figure 6).

It eventually gets hot enough at the center of the disk (10 million K) for the protosun to begin fusing hydrogen into helium; this marks the beginning of the Sun's life as a star. In the last stage (4) shown in Figure 6, material is clumping together within the lanes that formed in the solar nebula, and planetesimals accrete more material to become protoplanets and then the planets.
How do we know?
Protoplanetary disks had long been theorized to exist in star forming regions and evidence of their existence began with the detection of a circumstellar disk around the star β Pictoris in 1984 with the Infrared Astronomy Satellite. The images of the protoplanetary disks in the Orion Nebula in the figure below were taken with the Hubble Space Telescope (HST), which launched in 1990. The bright points at the center of the proplyds in Figure 7 are young protostars that are surrounded by dusty disks. Many other proplyds were observed in the Orion Nebula by the same team using HST, and this was a very significant finding in 1992. This is the same year that the first exoplanet was detected orbiting a pulsar and there was still much speculation on how common other solar systems were in our galaxy. Finding a large number of proplyds in just one nearby star forming region strongly suggested that the process of planet formation could be common, and perhaps other planets could host life.

The temperature within the disk decreases with increasing distance from the Sun, much as the planets’ temperatures vary with position today. As the disk cooled, the gases interacted chemically to produce compounds; eventually these compounds condensed into liquid droplets or solid grains. This is similar to the process by which raindrops on Earth condense from moist air as it rises over a mountain.
Closer to the disk, it was too hot for hydrogen compounds to solidify into ices; at these higher temperatures, only rocks and metals could condense into solids. Eventually, at a certain distance away from the star, it is cool enough for the hydrogen compounds to also condense into ice. This idea is shown in Figure 8 below, where the line beyond which it is cold enough for hydrogen compounds to freeze is indicated as the frost line or snow line. The location of the frost line depends on the mass of the star that is forming at the center. For a star like the Sun, the frost line is 2.7 AU from the center. It will be closer for a low mass star and further our for a more massive star.

This very intuitive idea -- that temperature decreases as you get further from the star -- goes a long way in explaining the chemical differences as well as size and density differences between the terrestrial and jovian planets. The jovian planets are much more massive than the terrestrial planets, while the terrestrial planets have a higher density than the jovians. The terrestrial planets are rocky and have average densities of 5.0 g/cm3, while the jovian planets have an average density of 1.2 g/cm3 (for reference, at STP, hydrogen gas has a density of 0.089 g/cm3, water has a density of 1.0 g/cm3, silicon has a density of 2.3 g/cm3, and iron has a density of 7.9 g/cm3).
Let's start with the mass differences. The terrestrial planets are made of rock and metal, and the jovians are made of rock, metal, and ices. Ice has mass, so the jovians grew more massive as they accumulated ice on top of the rock. The higher mass from the ice meant that gravity was stronger for these planets and hence more material could be pulled in. More material means more mass and stronger gravity...this self-reenforcing process continued until the jovians had pulled in all of the hydrogen and helium gas. This explains the mass differences.
As for density, since the additional ice and gases that the jovians pulled in have very low densities, this brought the overall densities of the jovians down to values that are much lower than rock. The density of Jupiter is 1.3 g/cm3 and this is the average density for the entire planet. While Jupiter has a dense metal core, the planet is vastly dominated by the light gases helium and hydrogen so the average density is much lower than the values for metals and rock. Without these additional ice and gas layers, the terrestrial densities remain higher, with values matching those of rocks and metals.
The solar nebula model explains why planets should be expected to orbit in the same direction as the spin of the star: the planets and star all formed from the same spinning disk of material. Therefore, the Sun rotates in the same direction as the spinning disk and the planets all orbit the Sun in the same direction. The planetary orbits would also stay in the plane of the flattened disk, which explains why the orbits of the planets are coplanar (recall Figure 3).
The different locations of the terrestrials and jovians are also explained by the temperature in the disk where they formed. Asteroids and comets are left over planetesimals that were not swept up into a planet. Their compositions are also related to the conditions where they formed in the disk. Asteroids formed inside the frost line and are made of rocky materials. Comets formed outside the frost line, and are consequently rocks covered in a layer of ice.
The unusual features that we observe, such as the sideways tilt of Uranus or Venus' upside-down rotation, can be explained by the solar nebula model as the result of collisions during the planet-building phase. What about all the moons and rings around the jovians? This relates back to the high masses of the jovian planets. Since these planets are so massive, their strong gravity pulls in some of the dust and gas from the solar nebula, thus becoming "mini solar nebulas" as they form. This swirling disk of material around the jovians is the material that forms their moons and rings. The terrestrial planets were not massive enough to pull in material from the solar nebula, so the terrestrial moons are thought to be the result of early collisions with planetesimals. Our Moon, for example, is believed to have formed from the debris of a collision between the early Earth and another large body (Figure 9). Evidence to support this formation scenario for the Moon comes from lunar rocks brought back to Earth by astronauts on the Apollo missions between 1969 and 1972. These rocks confirmed that the composition of the Moon is similar to that of the Earth's crust and mantle.

How do we know?
Dramatic evidence supporting the separation of material into distinct lanes or rings within the solar nebula came from this image shown to the right (Figure 10), which was taken in 2014 with the Atacama Large Millimeter Array (ALMA) of radio telescopes in the Chilean desert. This picture of the young star HL Tauri looks like an artists's sketch of a solar system forming; in fact, it looks quite similar to how panel 3 of Figure 6 would look if sketched face-on rather than edge-on.
")
Comparison with other solar systems
Over 4,000 exoplanetary systems have been detected to date. Do they resemble our solar system, with four inner rocky planets and four outer gas giants. In a word, No. The animation below shows what the multi-planet systems detected by the Kepler Mission look like. Only the planets are shown and not the host stars and the planets are color-coded according to their temperature: the hottest "lava" planets are red and comparatively cooler planets, like Earth, Mars, and the gas giants, are colored blue. Planets that are analogues of Venus, with its hot rocky surface that could melt lead, are colored white. Watch the animation a few times and pause it to really take in how different all of these planetary systems are from our own.
Animation of multi-planet systems.
Video credits: Ethan Kruse/NASA Goddard, CC BY 3.0
https://youtu.be/5I_FOEh47RY?feature=shared
There are some biases for the planetary systems shown in this animation, as the transit method that Kepler uses to detect planets will preferentially find planets that are orbiting close to their host star. We can still make the general conclusion that solar systems show an immense amount of variation. As we explore in Exoplanets: Statistics and Discoveries, the vast majority of exoplanets detected to date are different from the terrestrial and jovian planets in our solar system. In some cases, gas giants like Jupiter are found orbiting extremely close to their host stars. These "hot Jupiters" seem inconsistent with a formation scenario in which they formed so close to their stars. Computer simulations are being used to explore if perhaps these planets formed where expected but somehow migrated closer in to their star.
From the evidence we see of proplyds in our galaxy, we have confidence that the main idea of the solar nebula model -- that solar systems form when a cloud of gas and dust collapses and forms a swirling disk of material with a protostar at its center -- is correct.
Solar System Stability
Planets are kept in their orbits primarily through gravitational interactions between the planet and their host star. However, planets also feel a much smaller but non-negligible gravitational pull from the other planets in the system. Though the planets in our Solar System are relatively well separated, this is not always the case in other Solar Systems, and may not even always be the case for our own system. The closer two bodies are to each other, the stronger their gravitational pull will be on each other.
Close encounters between planets can affect their orbits' eccentricities, semi-major axes, and relative inclination. These effects are accentuated in the case of resonant systems. Resonance describes the situation in which two planets have periods that form an integer ratio. For example, if one planet has a period of two years and a second planet has a period of four years, these two planets are said to be in resonance. Today, we can use computer simulations to determine what will happen to different systems of planets as they evolve through time that will expose these types of interactions.
Planets may also move around during formation. This may push smaller, more-likely rocky planets into the host star, or send debris like asteroids and comets into the path of other planets. Such motion in our Solar System is thought to have caused the period of late heavy bombardment, which left its mark on our Moon. This type of mechanism may have caused the strange position of hot Jupiters, which are commonly found and much closer in than where they could have formed.

In 2008, a paper by Batygin and Laughlin showed that on million-year time scales, planetary orbits may evolve in random, but ultimately stable ways. However, on longer timescales, orbits can rapidly and spontaneously evolve into chaotic states hard for even the best computer simulations to predict. Subtle interactions between the different planets and objects with mass in the solar system are capable of enacting significant change over the dynamical state of a system of planets. Close encounters will amplify these changes, rearrange orbits, and eject small bodies out of the Solar System. Resonant affects could even depopulate entire areas in a planetary system. The architecture and stability of a planetary system are important contributors to a planet's potential habitability.
Key Concepts and Summary
Stars form when high density regions in giant molecular clouds begin to gravitationally collapse. As the protostar is collapsing, conservation of angular momentum forces it to spin faster and a disk of gas and dust settles around the equator of the star. This is the protoplanetary disk, where clumps of material collide and grow to form planetesimals, which collide and grow to form planets. In our solar system, there are two types of planets that formed: smaller rocky planets with thin atmospheres and gas giant planets. The solar nebula model describes formation of the solar system and describes the main features that we observe: the rocky planets orbit more closely to the Sun and gas giants formed and orbit beyond the ice line. The process of planet formation takes almost a million years, far beyond the lifetime of human astronomers. However, the discovery of young stars with protoplanetary disks and the structure of exoplanetary systems have helped to confirm and extend our understanding of star and planet formation.
Review Questions
Summary Questions
- What are giant molecular clouds? How do star systems form within GMCs?
- List the main observed properties of the planets in our solar system.
- What is the solar nebular theory?
- What properties are different for terrestrial and jovian planets?
- How does the solar nebular theory explain each of the properties observed in our solar system?
- How do comets and asteroids differ from planets? Where are comets and asteroids found in our solar system?
- What evidence do we have that the solar nebula model explains the formation of other solar systems in our galaxy?
- How did Earth's moon form? What evidence supports this claim?
- Do other solar systems have the same layout as our own? What evidence supports your answer?
Exercises
We cannot understand the history of the Earth or the evolution of life without measuring time. In this chapter we'll see how scientists use different types of rocks to measure both relative and absolute ages, and ultimately the age of the Earth itself.
Learning Objectives
By the end of this chapter, you will be able to:
- identify the three major types of rocks and understand how they transform into one another in the rock cycle
- understand how relative dating with layers of sedimentary rocks is used to construct a geological timeline
- explain how radiometric dating is used to determine the absolute ages of rocks
- calculate the age of a sample given fractions of parent and daughter isotopes
- explain how we determine the age of the Earth
The Rock Cycle
Geologists classify into three major groups according to how they form.
- Igneous rocks are made from molten magma or lava that solidifies into rock. The chemical compositions of the magma and the rate at which it cools determine the type of rock formed. Igneous rocks include granite and basalt.
- Sedimentary rocks are layered rocks formed when sand and silt collect on the surface or in bodies of water and cement together to form new rock. Examples include sandstone and shale.
- Metamorphic rocks form when rocks undergo temperatures and/or pressures that are high enough to cause structural or chemical transformations without melting them entirely. Marble and slate are metamorphic rocks.
Over geological time, different types of rocks can transform into one another, in a process called the rock cycle (Figure 1). For example, metamorphic or sedimentary rocks can be melted and transformed into igneous rocks, and all three rock types can be eroded into sediments that form new sedimentary rocks. Heat and pressure can transform igneous and sedimentary rocks into metamorphic rocks. Sedimentary and igneous rocks are most useful for measuring ages, as we'll see below.

Relative Dating with Sedimentary Rocks
Because sedimentary rocks are gradually deposited in layers over time, most fossils are preserved in sedimentary rocks. The presence sof fossils and the process of gradual deposition makes these rocks particularly valuable for the study of the history of the Earth. Sedimentary layers (called strata) enable relative dating: the process of determining if one rock or geologic event is older or younger than another, without knowing their actual ages.
Relative dating is based on a number of principles, the most fundamental of which is that in an undisturbed sequence of sedimentary strata, the oldest layers are on the bottom and the layers above are younger. This is a consequence of the deposition of sediments over time. Fossils can then be used to align sedimentary strata from different locations. Unlike (most) types of rock, living organisms appear for a while in the fossil record and then go extinct, so fossils of the same type in rocks from different regions have roughly the same ages. By matching layers with the same fossils, scientists can combine strata from many locations to construct a relative sequence. This is how the geological timescale was initially constructed.
Radiometric Dating
As we've seen, sedimentary rocks are extremely valuable for determining relative ages and constructing a timeline, but they can't tell us how many millions or billions of years ago a rock was formed. To figure that out, we take advantage of the process of radioactive decay.
Radioactive Decay
The absolute ages of certain types of rocks can be determined by a process known as radiometric dating. First described in 1907 by Bertram Boltwood, this method is now widely used for dating specimens throughout geology and uses known properties of atomic physics.
Recall that all the matter that we interact with every day is made up of protons, neutrons and electrons, and that atoms can exist as several different isotopes, which contain different numbers of neutrons in their nucleus. Not all nuclei are stable. Generally, heavier isotopes with an unbalanced number of neutrons relative to protons will undergo radioactive decay. For example, all carbon atoms have 6 protons, but different numbers of neutrons are possible: carbon-12 and carbon-13 are stable isotopes, but carbon-14 is an unstable isotope. The unstable isotopes (here, carbon-14) are known as parent isotopes, and they spontaneously decay into a different element or isotope, known as the daughter isotope.
There are two different types of statistically predictable spontaneous decay. The first is known as alpha decay (Figure 3 below), so named because the process emits an alpha particle (two protons and two neutrons). Alpha decay can only occur with very large nuclei. The parent isotope is left with a reduction of four in atomic mass. The loss of two protons means that the parent isotope has been converted to a lighter element in the periodic table.

A second type of spontaneous decay is beta decay. The atomic mass (total number of protons + neutrons) remains the same, but the atomic number (number of protons) changes. A proton or neutron may change into the other by flipping the charge of one quark (protons and neutrons are made of quarks). With [latex]\beta ^-[/latex] decay, a neutron decays into a proton plus an electron (to maintain charge balance) and an electron antineutrino to carry away energy. This changes the atom to a heavier element (it gains one proton). An example of [latex]\beta ^-[/latex] decay is the conversion of 14C (6 protons) to 14N (7 protons):
[latex]^{14}_6C \rightarrow \ ^{14}_7 N + e^- + \nu_e[/latex]
With [latex]\beta ^+[/latex] decay, the proton becomes a neutron, absorbing an electron, and the atom is changed to a lighter element (it loses one proton). And example of [latex]\beta ^-[/latex] decay is conversion of magnesium (12 protons) to sodium (11 protons):
[latex]^{23}_{12} Mg \rightarrow ^{23}_{11}Na + e^+ + \nu_e[/latex]
It is impossible to say for sure when a decay event will happen, but we can categorize the rate at which a sample of atoms will decay. If we know the amount of parent and daughter isotope, then knowing the rate of decay allows us to solve for how much time it must have taken for the parent isotope to decay into that much daughter isotope. This rate is characterized by the half-life, or the amount of time it takes for half of the parent isotope to decay into the daughter isotope. Different elements have different half-lives, and so are useful for dating different age ranges. The table below lists decay information for common isotopes.

Half-lives and the ages of rocks
Imagine a bag of microwave popcorn kernels. We can think of the popcorn kernels as unstable parent isotopes. The process of popping will symbolically represent spontaneous radioactive decay and the resulting popped popcorn will be the daughter isotopes. Though it is impossible to say when a specific kernel of popcorn is going to pop, we know how long it takes for most of the kernels to pop. There exists a relationship between number of popped kernels and amount of time passed, known as the radioactive half-life. The half-life is the amount of time it takes for half of the sample to decay. After one half-life, 50% of the sample will have decayed (50% of the kernels will have popped). After two half-lives, the sample will be cut in half again, so that 1/4 or 25% remains. After three half-lives, 1/8 of the sample remains. This process is shown in Figure 4.

If we know the rate at which an isotope decays, we can calculate the age of a specimen given the fraction of parent and daughter isotopes in the sample. The percentage of the daughter isotope increases at the same rate as the parent isotope decreases, as shown in Figure 5.

For example, suppose we analyze a rock and find that it contains 0.125 micrograms of potassium-40 and 0.875 micrograms of argon-40. What does this tell us? Potassium-40 decays into argon-40 with a half-life of 1.3 billion years, so we infer that all of the argon-40 was once potassium-40, and we started with 1 microgram: the 0.875 micrograms that is now argon-40, plus the 0.125 micrograms that remain. We know that after one half-life, 50% of the potassium-40 decays, leaving 0.5 micrograms of potassium-40 and 0.5 micrograms of argon-40. After two half-lives, another 50% decays, so 0.25 micrograms of potassium-40 remain and 0.75 micrograms have become argon-40. After three half-lives, 1/8 of the sample has decayed, leaving 0.125 micrograms of potassium-40. 7/8 of the sample is now argon-40, or 0.875 micrograms. Our rock is therefore three half-lives old: 3 [latex]\times[/latex] 1.3 billion years = 3.9 billion years.
When dating rocks, the use of many different radioactive isotopes gives even more information about the age of a specimen. The choice of isotopes depends largely on what is present in the rock sample and what is a sensible choice, given the relative half-lives of the different isotopes. Half-lives can range from fractions of a second to billions of billions of years. Elements with longer half-lives are more useful for dating older rocks. Isotopes with half-lives comparable to the age of the substance being dated are ideal.
Want to Know More: The Mathematics of Radioactive Decay
Rates of radioactive decay can be determined in a laboratory setting. It is known that radioactive decay is an exponential process given by:
[latex]N(t) = N_0 e^{\frac{-y}{t_{\rm mean}}}[/latex]
- where [latex]N(t)[/latex] is the amount of the parent isotope that remains,
- [latex]N_0[/latex], or sometime also written more explicitly as [latex]N(t=0)[/latex], is the initial amount the parent isotope that a sample started out with,
- [latex]t[/latex] is the amount of time that has passed,
- and [latex]t_{\rm mean} = \sqrt{2} \times t_{\rm half}[/latex] is the half-life of the element in question.
Taking the natural logarithm of both sides of the equation above and solving for [latex]t[/latex], we get an equation for the amount of time that has passed:
[latex]t = - \ln \left( \frac{N}{N_0} \right) \times \sqrt{2} \times t_{\rm half}[/latex]
As an example, let us imagine a classroom of 150 students who exhibit some very radioactive behavior. At the beginning of class, all 150 students are awake and attentive. Though we certainly hope this is never the case, suppose the students are falling asleep at an exponential rate, similar to the way that radioactive isotopes decay. After thirty minutes, half of the students have already fallen asleep! How much time has passed when only 30 students, or 20%, remain awake?
Using the equation above for time, the number of "surviving" (i.e., awake - no students were harmed in this thought experiment) 30 students is [latex]N[/latex], the initial 150 awake students is [latex]N_0[/latex], and 30 minutes was the half-life, [latex]t_{half}[/latex]. Because the half-life is in units of minutes, the answer will also be in minutes.
[latex]t = - \ln \left( \frac{30}{150} \right) \times \sqrt{2} \times 30 \approx 68[/latex] minutes
So, an hour and 8 minutes into the class, only 30 students remain awake in this completely hypothetical classroom.
Statistical uncertainty
The accuracy of radiometric dating can be hard to ensure because the method depends on knowing both how much of the parent isotope was initially present, and how much of the daughter product is the result of decay. It is possible that the daughter isotope will preferentially escape from a sample, or a contaminating source will add more of either the parent or the daughter isotope.
There are ways to improve accuracy. For example, multiple samples can be analyzed from different locations in the same rock in case one area suffered contamination. It is also helpful to calculate the age using several different isotopes to check for consistent results. This offers some insurance against potential loss of daughter isotopes since contamination or loss of daughter isotopes should behave differently. Counting accuracy is improved when there is a relatively high concentration of both the parent and daughter isotope.
Even with the best laboratory practices, radiometric dating depends inherently on the type of rock. Sedimentary rocks and metamorphic rocks are not good for radiometric dating. Sedimentary rock is made up of a conglomeration of the particles eroded from different types and ages of rock. Metamorphic rock undergoes too much change. Radiometric dating is only secure for igneous rocks that remain stable. Even so, radiometric dating of igneous rocks gives only the time since they last melted.
How Old is the Earth?
Radiometric dating has enabled us to date rocks that are nearly 4 billion years old. However, the Earth itself is older than this: the early Earth was in a molten state, and no rocks from this time have survived unchanged. To determine the age of the Earth and the other planets, we use radiometric dating of meteorites. Recall from the nebular model for the formation of the solar system that these are the unprocessed debris left over from planet formation. Their ages are therefore the age of the solar system itself. From radiometric dating of the oldest meteorites, we find that the solar system began to form 4.567 billion years ago. By dating moon rocks, we find that the Earth and Moon had formed by about 4.5 billion years ago.
Key Concepts and Summary
Rocks are grouped into three categories according to how they are formed. Sedimentary rocks, formed by the gradual deposition of sand and silt, can be used to construct a geological timeline with relative dating, the ordering of samples as older or younger than one another. Fossils are found in sedimentary rocks and are used to align sedimentary layers from different locations in time. To determine absolute ages of samples, we use radiometric dating based on the process of radioactive decay. By measuring the quantities of parent and daughter isotopes in a sample, we can calculate how many half-lives have passed and therefore determine the age of the sample. The age of the Earth and the solar system is determined by radiometric dating of meteorites that have not changed since the formation of the solar system. This technique tells us that the solar system began to form 4.567 billion years ago, and that the Earth had formed by about 4.5 billion years ago.
Review Questions
Summary Questions
Radioactive Decay
The different ages of these rocks is determined by a process known as radiometric dating. First described in 1907 by Bertram Boltwood, this method is now widely used for dating specimens throughout geology and uses known properties of atomic physics. All the baryonic matter that we interact with every day is made up of protons, neutrons and electrons. Protons and neutron are made up of quarks and have three "valence" quarks (Figure 1 below). Quarks are elementary particles and, as such, cannot be broken down any further. They possess intrinsic properties (some of which include charge and mass) and transfer these properties to the hadrons they make up. Hadrons is simply the term for something composed of quarks. Hadrons come in two types: mesons, which consist of a quark and an anti-quark, and our familiar baryons, which consist of three quarks. Quarks are studied by analyzing the way hadrons interact. As far as we have been able to tell, the electron is an elementary particle itself that cannot be broken down any further.

Recall that atoms can exist as several different isotopes, which contain different numbers of neutrons in their nucleus. Not all nuclei are stable. Generally heavier isotopes with an unbalanced number of neutrons relative to protons will undergo radioactive decay. For example, all carbon atoms have 6 protons, but additional neutrons are possible: carbon-12 and carbon-13 are stable isotopes, but carbon-14 is an unstable isotope. The unstable isotopes (here, carbon-14) are the parent isotope and they spontaneously decay into a different element or isotope, known as the daughter isotope.
There are two different types of statistically predictable spontaneous decay. The first is known as alpha decay (Figure 2 below), so named because the process emits an alpha particle (two protons and two neutrons). Alpha decay can only occur with very large nuclei. The parent isotope is left with a reduction of four in atomic mass. The loss of two protons means that the parent isotope has been converted to a lighter element in the Periodic Table.
A second type of spontaneous decay is beta decay. The atomic mass (total number of protons + neutrons) remains the same, but the atomic number (number of protons) changes. A proton or neutron may change into the other by flipping the charge of one quark. These changes are possible because protons and neutrons are not elementary particles. With $\beta ^-$ decay, a neutron decays into a proton plus an electron (to maintain charge balance) and an electron antineutrino to carry away energy. This changes the atom to a heavier element (plus one proton). An example of $\beta ^-$ decay is the conversion of 14C (6 protons) to 14N (7 protons):
$^{14}_6C \rightarrow \ ^{14}_7 N + e^- + \nu_e$
With $\beta ^+$ decay, the proton becomes a neutron, absorbing an electron, and the atom is changed to a lighter element (minus one proton). And example of $\beta ^-$ decay is conversion of magnesium (12 protons) to sodium (11 protons):
$^{23}_{12} Mg \rightarrow ^{23}_{11}Na + e^+ + \nu_e$
It is impossible to say for sure when a decay event will happen, but we can categorize the rate at which a sample of atoms will decay. If we know the amount of parent and daughter isotope, then knowing the rate of decay allows us to solve for how much time it must have taken for the parent isotope to decay into that much daughter isotope. This rate is characterized by the half-life, or the amount of time it takes for half of the parent isotope to decay into the daughter isotope. Different elements are useful for dating different age ranges. The Table below lists information for common isotopes.
Half life
Imagine a bag of microwave popcorn kernels. We can think of the popcorn kernels as unstable parent isotopes. The process of popping will symbolically represent spontaneous radioactive decay and the resulting popped popcorn will be the daughter isotopes. Though it is impossible to say when a specific kernel of popcorn is going to pop, we know how long it takes for most of the kernels to pop. There exists a relationship between number of popped kernels and amount of time passed, known as the radioactive half life. If we know the rate at which an isotope decays, we can calculate the age of a specimen given the fraction of parent and daughter isotopes in the sample.
Rates of radioactive decay can be determined in a laboratory setting. It is known that radioactive decay is an exponential process given by:
$N(t) = N(t=0) e^{\frac{-y}{t_{mean}}}$
- where $N(t)$ is the amount of the parent isotope that remains,
- $N(t=0)$, or sometime also written $N_0$, is the initial amount the parent isotope that a sample started out with,
- $t$ is the amount of time that has passed,
- and $t_{mean} = \sqrt{2} \times t_{half}$ is the half-life of the element in question.
Taking the natural logarithm of both sides of the equation above and solving for $t$, we get an equation for the amount of time that has passed:
$t = - \ln \left( \frac{N}{N_0} \right) \times \sqrt{2} \times t_{half}$
As an example, let us imagine a classroom of 150 students who exhibit some very radioactive behavior. At the beginning of class, all 150 students are awake and attentive. Though we certainly hope this is never the case, suppose the students are falling asleep at an exponential rate, similar to the way that radioactive isotopes decay. After thirty minutes, half of the students have already fallen asleep! How much time has passed when only 30 students, or 20%, remain awake?
Using the equation above for time, the number of "surviving" (i.e., awake - no students were harmed in this thought experiment) 30 students is $N$, the initial 150 awake students is $N_0$, and 30 minutes was the half-life, $t_{half}$. Because the half-life is in units of minutes, the answer will also be in minutes.
$t = - \ln \left( \frac{30}{150} \right) \times \sqrt{2} \ times 30 \approx 68$ minutes
So, an hour and 8 minutes into the class, only 30 students remain awake in this completely hypothetical classroom.
In the example above was a simple case of misbehaving students. When dating rocks, the use of many different radioactive isotopes gives even more information about the age of a specimen. The choice of isotopes depends largely on what is present in the rock sample and a sensible choice, given the relative half-lives of the different isotopes. Half-lives can range from fractions of a second to billions of billions of years. Elements with longer half-lives are more useful for dating older rocks. Isotopes with half-lives comparable to the age of the substance being dated are ideal.
Atomic elements can also be changed by fission, which splits massive atomic elements into less massive elements. Spontaneous fission releases substantial amounts of energy. Elements can also be changed by fusion of lighter elements to form heavier elements. As discussed before, this process takes place in the cores of stars where hydrogen undergoes nuclear fusion to form helium. This process requires the input of a substantial amount of energy.
Statistical uncertainty
The accuracy of radiometric dating can be hard to ensure because the method depends on knowing both how much of the parent isotope was initially present, and how much of the daughter product is the result of decay. It is possible that the daughter isotope will preferentially escape from a sample, or a contaminating source will add more of either the parent or the daughter isotope. Returning back to the fictitious classroom example, this would happen if different students left and entered the room during the class. Then, someone observing the room an hour after the start of class would be uncertain about how many students were initially in the room.
There are ways to improve accuracy. For example multiple samples can be analyzed from different locations in the same rock in case one area suffered contamination. It is also helpful to calculate the age using several different isotopes to check for consistent results. This offers some insurance against potential loss of daughter isotopes since contamination or loss of daughter isotopes should behave differently. Counting accuracy is improved when there is a relatively high concentration of both the parent and daughter isotope.
Even with the best laboratory practices, radiometric dating depends inherently on the type of rock. Rocks are classified into three groups. Igneous rocks are made from molten magma or lava that solidifies into rock. Sedimentary rocks are layered rocks formed when sand and silt collect on the surface or in bodies of water and cement together to form new rock. Metamorphic rocks form when rocks undergoes intense temperature and/or pressure and transform into a different type of rock altogether. Through various processes, different types of rocks can transform into one another, as depicted in Figure 4 below.
Sedimentary rocks and metamorphic rocks are not good for radiometric dating. Sedimentary rock is made up of a conglomeration of the particles eroded from different types and ages of rock. Metamorphic rock undergoes too much change. Radiometric dating is only secure for igneous rocks that remain stable. Even so, radiometric dating of igneous rocks gives only the time since they last melted. Radiometric data has helped date rocks that are billions of years old going back almost to almost 4 Gya. The age of the Earth can be determined by radiometric dating of meteorites, the unprocessed specimens of planet formation.
We think of the atmosphere as essential for life because it provides oxygen for us to breathe, but without it, Earth would not be habitable at all: without an atmosphere, our planet would be about 30°C colder than it is, and completely frozen over. In this chapter we will explore the combined roles of the atmosphere and plate tectonics in regulating Earth's climate.
Learning Objectives
By the end of this chapter, you will be able to:
- describe the contents of Earth's atmosphere
- explain how the greenhouse effect warms the Earth
- describe the inorganic carbon cycle and its relationship to plate tectonics
- explain how the greenhouse effect and the carbon cycle work together to stabilize Earth's climate
Composition of the Atmosphere
Earth's temperature depends on the composition of the atmosphere. The primary components are nitrogen (N2, 78%) and oxygen (O2, 21%), and the remainder is argon (Ar, about 1%) and trace amounts of other gases. Among those other gases are the greenhouse gases that make Earth habitable. The most common greenhouse gases are water vapor (H2O), carbon dioxide (CO2), methane (CH4), and nitrous oxide (N2O), as shown in Figure 1. Note that they all contain at least three atoms.
Water vapor is the most abundant greenhouse gas, but its atmospheric abundance does not change much over time. Carbon dioxide is much less abundant than water vapor, but it is currently being added to the atmosphere by human activities such as burning fossil fuels, land-use changes, and deforestation. Carbon dioxide stays in the atmosphere for hundreds of years. Although there is much less methane than carbon dioxide in the atmosphere, it is 30 times more effective as a greenhouse gas. It is also removed from the atmosphere much more quickly.
What makes a gas a greenhouse gas?
The dominant gases of the atmosphere are nitrogen (as N2) and oxygen (as O2). These gas molecules have only two atoms each, and are not greenhouse gases. In contrast, water vapor (H2O), carbon dioxide (CO2), and methane (CH4) all have more than two atoms, and they are greenhouse gases. Why does the number of atoms matter?
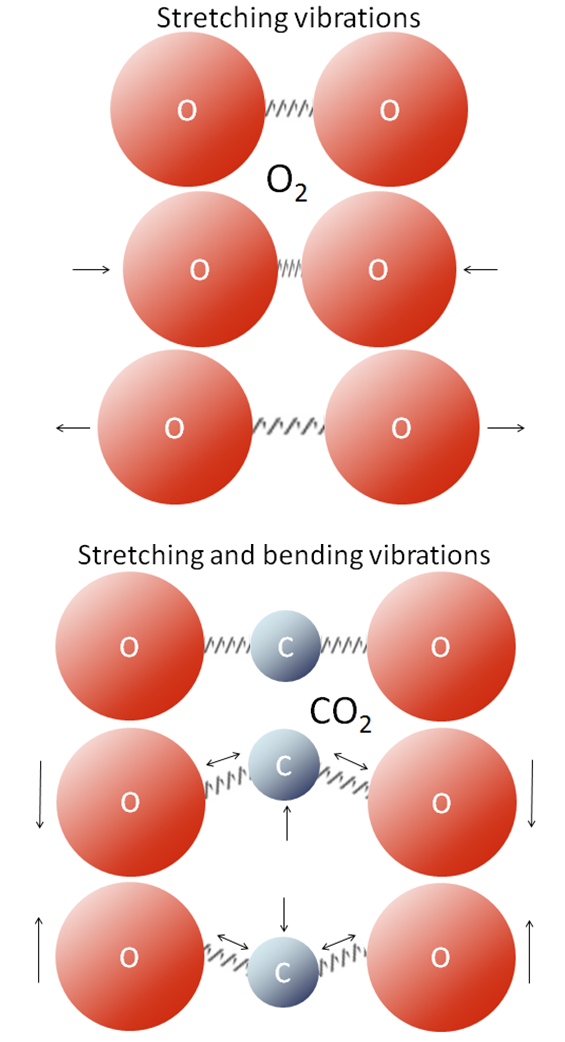
All molecules vibrate at various frequencies and in various ways, and some of those vibrations take place at frequencies within the range of the infrared (IR) radiation that is emitted by Earth’s surface. Gases with two atoms, such as O2, can only vibrate by stretching (back and forth; Figure 2 top), and those vibrations are much faster than the frequencies of IR radiation. Gases with three or more atoms (such as CO2) vibrate by stretching as well, but they can also vibrate in other ways, such as by bending (Figure 2 bottom). Those vibrations are slower and allow the molecules to absorb and release infrared radiation.
When infrared radiation interacts with CO2 or with one of the other greenhouse gases, the molecular vibrations are enhanced because there is a match between the wavelength of the IR light and the vibrational frequency of the molecule. This makes the molecule vibrate more vigorously, heating the surrounding air in the process. These molecules also emit IR radiation in all directions, some of which reaches Earth’s surface. The heating caused by the more vigorous vibrations of greenhouse gases and their emission of IR radiation is called the greenhouse effect. Water molecules (H2O), and methane molecules (CH4) also interact with infrared radiation when they vibrate, so they are greenhouse gases as well.
Greenhouse gases trap heat in the atmosphere and warm the planet by absorbing some of the infrared radiation that is emitted by the Earth, thus keeping that heat from being lost to space. More greenhouse gases in the atmosphere absorb more heat and make the planet warmer.
The Greenhouse Effect
The greenhouse effect is named after the process that warms a greenhouse or a car on a hot summer day: sunlight passes through the glass of the greenhouse or car, reaches the interior, and is absorbed and reradiated as heat. The heat radiates upward, but gets trapped by the glass windows instead of escaping. On Earth, greenhouse gases in the atmosphere play the role of the windows. The greenhouse effect can be explained in three steps.
Step 1: Radiation from the Sun strikes the Earth. This radiation is composed of mostly ultraviolet (UV), visible, and infrared (IR) light. Part of the radiation is directly reflected by Earth's surface or atmosphere, and part is immediately absorbed by greenhouse gases in the atmosphere. About half of the solar radiation is absorbed by the Earth’s surface.
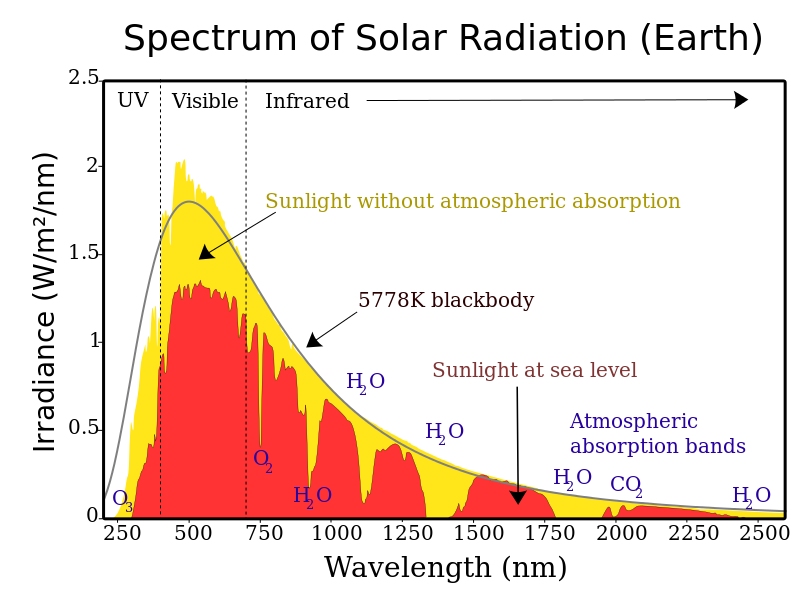
Step 2: The visible, UV, and IR radiation that reaches the surface is converted to into heat. You have probably experienced sunlight warming a surface such as pavement, a patio, or deck. When this happens, the warmed surface then emits thermal IR radiation: heat. In this way, the visible, UV, and IR light absorbed by Earth's surface is converted to only IR, and reradiated by the surface.
Step 3: The energy absorbed by the Earth's surface radiates back into the atmosphere, but now only at IR wavelengths. If there were no atmosphere, this IR radiation would simply escape into space. Instead, it encounters greenhouse gas molecules in the atmosphere, is absorbed by those molecules, and is finally reemitted once again. The IR radiation emitted by the greenhouse gas molecules provides the additional source of heat that warms the Earth. The gases that are mostly responsible for this process include carbon dioxide, water vapor, methane, and nitrous oxide. The presence of more greenhouse gases in the atmosphere results in more thermal IR being trapped, and more heating. The animation below shows a simplified version of the greenhouse effect.
Earth’s Energy Budget
The solar radiation that reaches Earth is relatively uniform over time. Earth is warmed, and energy or heat radiates from the Earth’s surface and lower atmosphere back to space. This flow of incoming and outgoing energy is Earth’s energy budget. For Earth’s temperature to be stable over long stretches of time, incoming energy and outgoing energy have to be equal on average, balancing the energy budget at the top of the atmosphere. About 29% of the incoming solar energy arriving at the top of the atmosphere is reflected back to space by clouds, atmospheric particles, or reflective ground surfaces like sea ice and snow. About 23% of incoming solar energy is absorbed in the atmosphere by water vapor, dust, and ozone. The remaining 48% passes through the atmosphere and is absorbed at the surface. Thus, about 71% of the total incoming solar energy is absorbed by the Earth system (Figure 4).
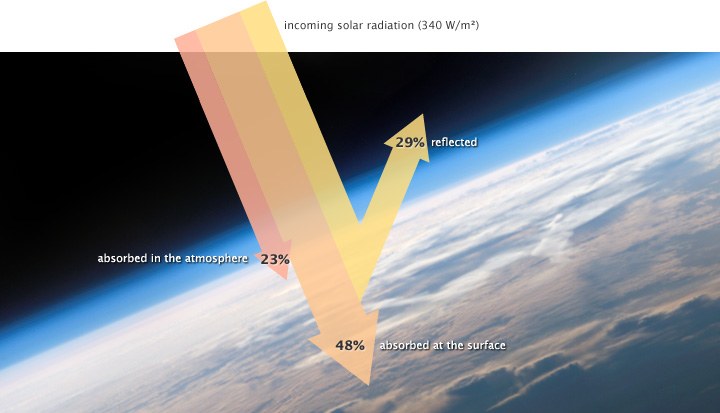
When this energy reaches Earth, the atoms and molecules that make up the atmosphere and surface absorb the energy, and Earth’s temperature increases. If this material only absorbed energy, then the temperature of the Earth would continue to increase and eventually overheat. For example, if you continuously run a faucet in a stopped-up sink, the water level rises and eventually overflows. However, temperature does not infinitely rise because the Earth is not just absorbing sunlight; it is also radiating thermal energy or heat back into the atmosphere. If the temperature of the Earth rises, the planet emits an increasing amount of heat to space. This is the primary mechanism that prevents Earth from continually heating.
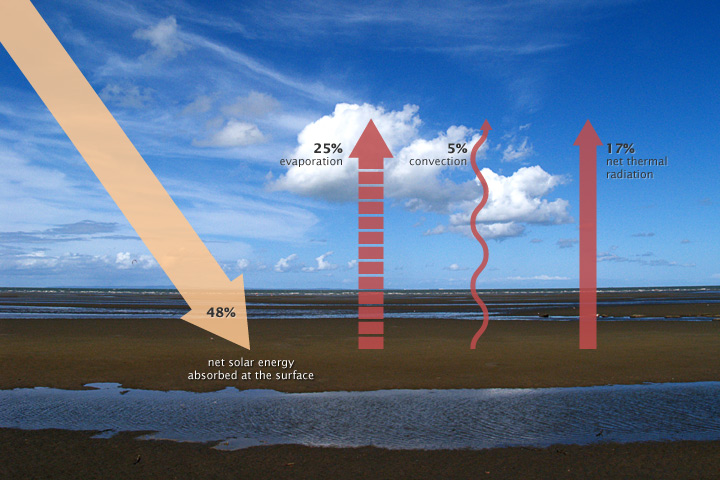
Some of the thermal infrared heat radiating from the surface is absorbed and trapped by greenhouse gases in the atmosphere, which act like a giant canopy over Earth. The more greenhouse gases in the atmosphere, the more outgoing heat Earth retains and the less thermal infrared heat dissipates to space.
Factors beyond greenhouse gases can affect the Earth’s energy budget. Increasing or decreasing solar energy will change the energy Earth receives. Such changes can be due to long term evolution of the Sun, as it grows brighter with age, or to changes in the orbit of the Earth that alter the distance to the Sun. Orbital variations are largely responsible for Earth's recent ice ages. These changes due to the Sun are very small over time. In addition, land and water will absorb more sunlight when there is less ice and snow to reflect the sunlight back to the atmosphere. For example, the ice covering the Arctic Sea reflects sunlight back to the atmosphere. Furthermore, aerosols (dust particles) produced from burning coal, diesel engines, and volcanic eruptions can reflect incoming solar radiation and actually cool the planet.
The Carbon Cycle
Most of Earth's carbon dioxide is not in the atmosphere. Instead, it is locked in carbonate rocks, sedimentary rocks such as limestone that are rich in carbon. Plate tectonics plays a key role in both locking carbon in rocks and in regulating the carbon dioxide content of the atmosphere. The inorganic or geological carbon cycle stabilizes our climate thanks to plate tectonics and chemical interactions between surface rocks and the atmosphere (this is also called the slow carbon cycle because it takes place over geological time---the fast or biological carbon cycle involves the flow of carbon between the atmosphere and Earth's ecosystems).
As shown in Figure 6, carbon dioxide in the atmosphere dissolves in rainwater, creating carbonic acid. This weak acid reacts with rocks, slowly breaking them down and carrying the dissolved minerals to the oceans. Over time, carbon dioxide in the oceans reacts with the dissolved minerals to create new carbonate rocks on the ocean floor. These rocks are then transported into the deep mantle in subduction zones, where they eventually melt, releasing CO2. The CO2 is released back into the atmosphere by volcanoes, completing the cycle. In summary, plate tectonics on Earth allows carbon to be cycled from the atmosphere, down to carbonate rocks on the ocean floor, and back into the atmosphere through volcanism.
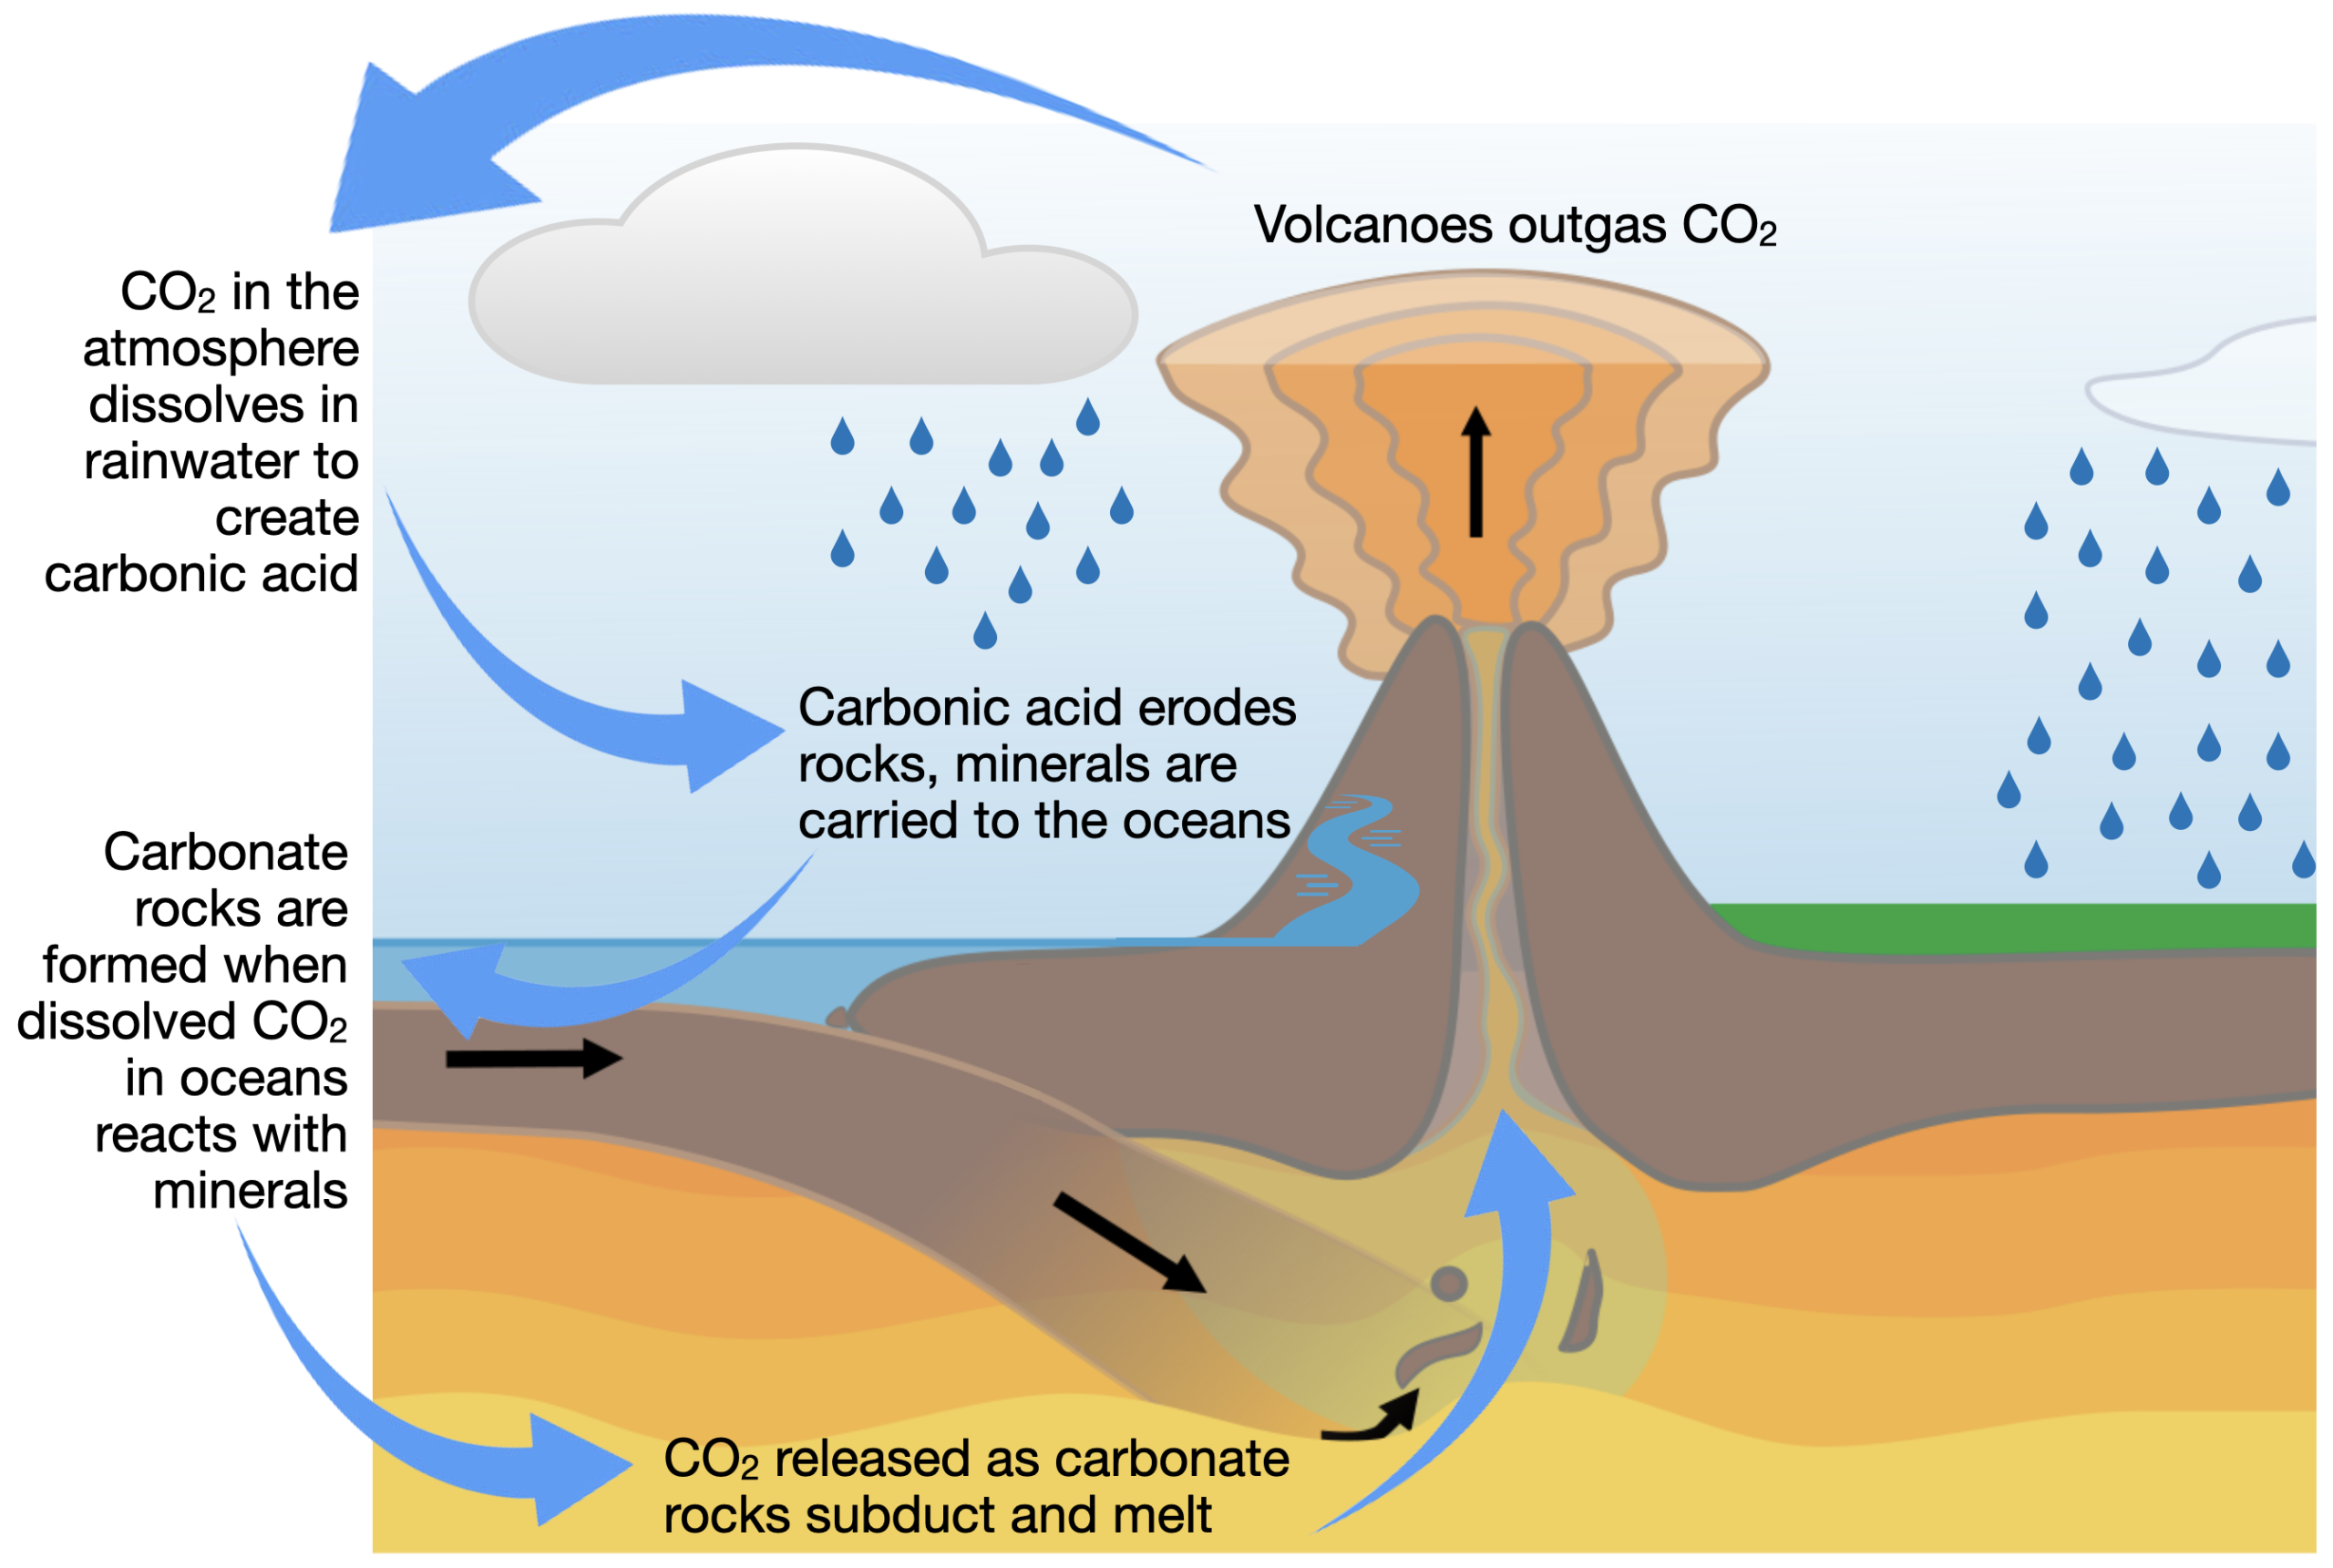
This carbon cycle is an essential part of maintaining a hospitable atmosphere on Earth, and it would not be possible without liquid water and plate tectonics. Other planets in our solar system experience tectonic stresses, but plate tectonics – with the active movement of crustal and oceanic plates – is unique to Earth. When exploring exoplanets that may be conducive to life, the presence of plate tectonics would be a favorable condition, at least based on our experience on Earth.
Climate Regulation
The greenhouse effect and the carbon cycle work together in a negative, stabilizing feedback loop that maintains Earth's temperature. To see how this works, we can imagine raising Earth's temperature. This change will increase evaporation from the oceans, thus increasing the amount of CO2 that is removed from the atmosphere by dissolution in rainwater. An increase in temperature also increases the rate of the reactions that break down rocks. The result is a decrease in CO2 in the atmosphere and a weakening of the greenhouse effect. A weakened greenhouse effect cools the planet and stabilizes the temperature. Similarly, a decrease in temperature reduces evaporation and slows the removal of CO2 from the atmosphere, strengthening the greenhouse effect and counteracting the decrease in temperature.
In combination, the greenhouse effect and the carbon cycle have regulated Earth's temperature for billions of years. However, this does not mean that the temperature has always been about the same as it is today. Hundreds of millions of years ago, for example, the CO2 content of the atmosphere was much higher than it is now, and the dinosaurs enjoyed a tropical climate with trees in Antarctica.
There have also been large excursions away from stability. Some of the most dramatic are known as the Snowball Earth episodes of about 700-650 million years ago, when the Earth became almost entirely frozen over. With the planet covered in ice, sunlight was reflected back into space by the bright surface instead of being absorbed, leading to further cooling. The carbon cycle and the greenhouse effect provided the eventual escape from the snowball phase, as volcanic outgassing released CO2 into the atmosphere while the absence of evaporation and rainfall kept it there.
Intense volcanic activity has also released massive amounts of CO2 into the atmosphere, at rates much faster than the rest of the carbon cycle can keep up with. Climate change caused by one of these episodes was responsible for the largest mass extinction in Earth's history, about 250 million years ago. We'll learn more about this event in the chapter on geological and biological coevolution. Today, the release of CO2 from the burning of fossil fuels again threatens the stability of Earth's climate.
Key Concepts and Summary
Earth's atmosphere contains a small fraction of greenhouse gases such as water vapor, carbon dioxide, nitrous oxide, and methane. These gases absorb and reradiate infrared radiation (heat) that would otherwise escape to space, warming Earth by about 30°C and making it habitable. Over long timescales, the CO2 content of Earth's atmosphere is regulated by the inorganic carbon cycle, in which CO2 in the atmosphere is dissolved in rainwater which then erodes rocks. Sediments from the rocks are carried to the oceans, combining again with CO2 to form new carbonate rocks. The conveyer belt of plate tectonics carries these rocks to subduction zones where they are melted, releasing CO2 to be outgassed by volcanoes. The greenhouse effect and the carbon cycle work together in a negative feedback loop to stabilize Earth's temperature.
Review Questions
- What is the compositions of Earth's atmosphere? What are the primary greenhouse gases?
- How do greenhouse gases interact with light from the Sun to warm the Earth?
- How do the greenhouse effect and the carbon cycle work together to stabilize Earth's temperature?
- How does plate tectonics contribute to Earth's habitability?
- Can a planet without plate tectonics be habitable?
The atmosphere and greenhouse effect sections of this chapter are remixed from Introduction to Earth Science, Second Edition and Physical Geology under a CC BY-NC-SA 4.0 license.
Although it is dry and seemingly barren today, our next-door neighbor Mars may have once been a habitable planet. Finding any life on Mars, even a microbe, would represent a leap in our understanding of life in the universe, as it would mean that life existed in two separate locations in one solar system. Humans have been exploring the Red Planet with unmanned spacecraft since the 1960s and a great deal of evidence has emerged in support of a warmer and wetter Mars in the past. In this chapter, we review some of the key findings that point toward a once habitable Mars.
Learning Objectives
By the end of this chapter, you will be able to:
- Discuss findings from early missions in the 20th century to explore Mars
- Describe the terrain and geological features of Mars
- Discuss several lines of evidence that suggest Mars had liquid water on its surface in the past
- Describe the various rover space missions to Mars and what they have found so far
History and Early Missions
The possibility that Mars hosts, or has hosted, life has a rich history dating back to at least the middle of the nineteenth century. William Herschel observed Mars in 1783 and noted that Earth and Mars share some commonalities, such as having an atmosphere and going through seasonal cycles. By 1840, the length of a day on Mars was known to be very similar to that for the Earth, at just over 24 hours. These similarities between Earth and Mars fueled speculation that Mars, too, could harbor life. The Italian astronomer Giovanni Schiaparelli made detailed sketches of the Martian surface in 1877 and he labeled some straight line features as "canali," an Italian word that can be translated to mean channels or canals, where channels are a natural geological feature and canals are manmade. That same year, 1877, American astronomer Asaph Hall discovered two small moons orbiting Mars; Hall named these moons Phobos and Deimos, meaning fear and panic, after the sons of Ares (the Greek counterpart of Mars).

The American astronomer Percival Lowell, the brother of the poet Amy Lowell, was intrigued by the possibility of life on Mars suggested by Schiaparelli's straight line "canali" features. Lowell, who came from a wealthy Boston family, built an observatory in Flagstaff, Arizona, called Lowell Observatory, in 1894 to undertake his observations of the surface of Mars. Lowell also published several books about the possibility of life on Mars, including Mars As The Abode Of Life and Mars And Its Canals. Not all scientists subscribed to Lowell's view that Mars was inhabited, and in 1894 Edward Barnard made his own observations and did not see the straight line canals observed by Schiaparelli and Lowell. To add to the public's imagination, H.G. Wells published his sci-fi novel The War of the Worlds in 1897.
The idea that Mars was inhabited by advanced life persisted throughout a good deal of the 20th century. The book Intelligent Life in the Universe, written by I.S. Shklovskii and Carl Sagan in 1966, includes a chapter dedicated to the possibility that the two moons of Mars are not natural but were artificially created by inhabitants of Mars. This was one year after the first images of Mars came in from the Mariner 4 mission. English artist David Bowie chimed in in 1971 with his hit song "Life on Mars?". In 1976, prior to the Viking missions landing on Mars, Carl Sagan and Joshua Lederberg published the article "The prospects for life on Mars: A pre-Viking assessment" in the journal Icarus. In the abstract, they note:
"Large organisms, possibly detectable by the Viking lander cameras, are not only possible on Mars; they may be favored."
Mariner and Viking Missions

A global view of Mars emerged after images from the Mariner flyby and orbiter missions were transmitted back to Earth. The first visitor was the US Mariner 4, which flew past Mars in 1965 and transmitted 22 photos to Earth. These pictures showed an apparently bleak planet with abundant impact craters. In those days, craters were unexpected; some people who were romantically inclined still hoped to see canals or something like them. In any case, newspaper headlines sadly announced that Mars was a “dead planet.” In 1971, NASA’s Mariner 9 became the first spacecraft to orbit another planet, mapping the entire surface of Mars at a resolution of about 1 kilometer and discovering a great variety of geological features, including volcanoes, huge canyons, intricate layers on the polar caps, and channels that appeared to have been cut by running water. Mariner 9 also collected data about the Martian atmosphere using two spectrometers on board. Geologically, Mars didn’t look quite so dead after all. The data from Mariner 9 allowed the Viking 1 and 2 missions to launch in 1975 and successfully land on Mars in 1976.

The Viking camera's did not reveal any large organisms on Mars (unless they hopped on the cameras to avoid being seen). But it did show a compelling view of the rock-strewn rusty surface of Mars. The Viking landers landed in different regions of Mars: Viking 1 at Chryse Planitia and Viking 2 at Utopia Planitia. Both of these regions are fairly smooth plains in the northern lowlands of Mars and were chosen to help ensure a safe landing, but they also contain features that, from previous images, looked like they could be associated with water. The Viking missions contained the tools to perform soil experiments on Mars, with the goal of looking for evidence of life. These experiments are discussed in detail below.
Extraordinary Claims: The Face on Mars

People like human faces. We humans have developed great skill in recognizing people and interpreting facial expressions. We also have a tendency to see faces in many natural formations, from clouds to the man in the Moon. One of the curiosities that emerged from the Viking orbiters’ global mapping of Mars was the discovery of a strangely shaped mesa in the Cydonia region that resembled a human face. Despite later rumors of a cover-up, the “Face on Mars” was, in fact, recognized by Viking scientists and included in one of the early mission press releases. At the low resolution and oblique lighting under which the Viking image was obtained, the mile-wide mesa had something of a Sphinx-like appearance.
Unfortunately, a small band of individuals decided that this formation was an artificial, carved sculpture of a human face placed on Mars by an ancient civilization that thrived there hundreds of thousands of years ago. A band of “true believers” grew around the face and tried to deduce the nature of the “sculptors” who made it. This group also linked the face to a variety of other pseudoscientific phenomena such as crop circles (patterns in fields of grain, mostly in Britain, now known to be the work of pranksters).
Members of this group accused NASA of covering up evidence of intelligent life on Mars, and they received a great deal of help in publicizing their perspective from tabloid media. Some of the believers picketed the Jet Propulsion Laboratory at the time of the failure of the Mars Observer spacecraft, circulating stories that the “failure” of the Mars Observer was itself a fake, and that its true (secret) mission was to photograph the face.
The high-resolution Mars Observer camera (MOC) was reflown on the Mars Global Surveyor mission, which arrived at Mars in 1997. On April 5, 1998, in Orbit 220, the MOC obtained an oblique image of the face at a resolution of 4 meters per pixel, a factor-of-10 improvement in resolution over the Viking image. Another image in 2001 had even higher resolution. Immediately released by NASA, the new images showed a low mesa-like hill cut crossways by several roughly linear ridges and depressions, which were misidentified in the 1976 photo as the eyes and mouth of a face. Only with an enormous dose of imagination can any resemblance to a face be seen in the new images, demonstrating how dramatically our interpretation of geology can change with large improvements in resolution. The original and the higher resolution images can be seen in Figure 5 below.
After 20 years of promoting pseudoscientific interpretations and various conspiracy theories, can the “Face on Mars” believers now accept reality? Unfortunately, it does not seem so. They have accused NASA of faking the new picture. They also suggest that the secret mission of the Mars Observer included a nuclear bomb used to destroy the face before it could be photographed in greater detail by the Mars Global Surveyor.
Space scientists find these suggestions incredible. NASA is spending increasing sums for research on life in the universe, and a major objective of current and upcoming Mars missions is to search for evidence of past microbial life on Mars. Conclusive evidence of extraterrestrial life would be one of the great discoveries of science and incidentally might well lead to increased funding for NASA. The idea that NASA or other government agencies would (or could) mount a conspiracy to suppress such welcome evidence is truly bizarre.
Alas, the “Face on Mars” story is only one example of a whole series of conspiracy theories that are kept before the public by dedicated believers, by people out to make a fast buck, and by irresponsible media attention. Others include the “urban legend” that the Air Force has the bodies of extraterrestrials at a secret base, the widely circulated report that UFOs crashed near Roswell, New Mexico (actually it was a balloon carrying scientific instruments to find evidence of Soviet nuclear tests), or the notion that alien astronauts helped build the Egyptian pyramids and many other ancient monuments because our ancestors were too stupid to do it alone.
Geology of Mars

After the Viking missions concluded, Mars was not visited by spacecraft again until the 1990s. Beginning with the Mars Pathfinder and Mars Global Surveyor missions in 1997, there have been over a dozen successful missions to explore Mars in the past 25 years. Each mission has contributed in various ways to our global understanding of Mars as a planet. Several missions, which we highlight in the next section, have had a specific goal of assessing the habitability of Mars or looking for signs of life.
The map below (Figure 7) was created using an altimeter -- an instrument that uses lasers to measure the altitude (or height) of different parts of the surface -- onboard the Mars Global Surveyor. The map is color-coded by the height of the surface, where the yellow regions are "ground level" at 0 km, blue/purple regions are at depths of about 5-7 km, and the grey/white regions have the highest altitudes, at over 12 km high for the white circular regions (these white circles are the tops of volcanoes). The Martian volcano Olympus Mons stands at a height of over 22 km, which is more than twice the height of Earth's tallest mountain from base to peak (Mauna Kea in Hawaii, part of which is under water), making Olympus Mons the tallest known mountain in the solar system.

Other notable features are seen on the Martian surface, such as the Valles Marineras (Mariner Valleys, named for the Mariner 9 mission which first revealed them). Valles Marineras is a canyon system that extend for about 5000 kilometers (nearly a quarter of the way around Mars) along the slopes of the Tharsis bulge. If it were on Earth, this canyon system would stretch all the way from Los Angeles to Washington, DC.
Concept Check: the Surface of Mars
Looking at the topographic map above of Mars (Figure 7), which regions are at the highest altitudes (elevation) and which regions are at the lowest altitudes? What do you think created Hellas Basin?
Can you find the Chryse and Utopia Planitia, the landing sites for Viking 1 and 2? Are these regions as deep as the Hellas Basin?
To further explore the terrain of Mars, you can load up Google Mars! Go to https://www.google.com/mars/ and start exploring. For example, you can click on "Spacecraft" at the top and see the locations of different Martian landers and rovers.
Globally, Mars has two distinct regions: the heavily cratered highlands in the southern hemisphere and the smoother low-lying volcanic plains (the "lowlands") in the northern hemisphere. The Moon also has similar surface geology, with the smoother plains (the lunar mare) representing a younger surface that was "re-paved" by lava around 3.5 billion years ago. Based on counting the numbers of craters in different regions and analysis of layered rocks, the geological history of Mars can be broken down into three eons: the Noachian, the Hesperian, and the Amazonian.
General Properties of Mars
We can gain some insight into the current conditions on Mars by considering its size and distance from the Sun. Mars is smaller than the Earth, with a radius about half that of the Earth and a mass of about 10% that of the Earth. The density of Mars is 3.9 g/cm3 (Earth's density is 5.5 g/cm3), which suggests a composition consisting primarily of silicates but with a small metal core. The smaller size of Mars compared to Earth means that Mars loses its internal heat more rapidly than the Earth, since the cooling rate depends on the radius. Mars has a surface gravity that is just 38% the value of Earth's surface gravity, meaning that material can escape more easily from Mars' gravitational pull. Finally, we note that Mars is about 50% further away from the Sun than the Earth is, meaning that Mars receives less energy from the Sun. Venus is closer to the Sun than Earth and consequently experienced a runaway greenhouse effect. Mars, on the other hand, experienced a runaway "icehouse" effect.
Today, Mars has lost almost all of its original atmosphere because of its low surface gravity and stripping by the solar wind (a stream of highly energetic particles emitted by the Sun). Mars also no longer has a protective magnetosphere so, if any life did currently exist on Mars, it would be challenging for it to survive in a high-radiation environment, which includes cosmic rays.
The Search for Life
In the quest to find life on Mars, either in the past or present, we can look evidence of liquid water and for the essential elements that make up all life on Earth -- CHNOPS. Given the commonalities between Mars and Earth noted earlier, such as a similar cycle of seasons and surface geology, we might expect that life could have formed in the same manner around the same time on early Mars as on Earth if there was liquid water in the past.
The Viking Biology Experiments
The earliest missions to Mars provided some hints that liquid water—one of life’s primary requirements—may once have flowed on the surface, and later missions have strengthened this conclusion. The NASA Viking landers, whose purpose was to search directly for evidence of life on Mars, arrived on Mars in 1976.
There were four different experiments that the Viking landers were equipped to conduct to look for byproducts of life in the Martian soil. The experiments were: gas-exchange (GEX), pyrolitic release (PR), labeled release (LR) and the gas chromatograph mass spectrometer (GCMS). The GEX and LR experiments both worked by adding nutrients to the soil and then attempting to detect gases released by organisms that consumed the nutrients. The PR experiment simulated the early Martian atmosphere and looked for signs of photosynthetic organisms. GCMS was slightly different in that its goal was to look for organic materials in the soil. Of the four experiments, only the LR produced positive results. However, the LR results have generally been deemed insufficient evidence for life since the GCMS experiments did not find any organics in the soil. However, some of the scientists who designed the LR experiment still interpret the results as supporting life. Extraordinary claims...
Viking’s onboard instruments found no organic molecules (the stuff of which life is made), and no evidence of biological activity in the martian soils it analyzed. The lack of any biological activity in the Martian soil is not particularly surprising because, despite the evidence of flowing liquid water in the past, liquid water on the surface of Mars is generally not stable today. Over much of the Martian surface, temperatures and pressures are so low that pure water would either freeze or boil away (under very low pressures, water will boil at a much lower temperature than usual). To make matters worse, unlike Earth, Mars does not have a magnetic field and ozone layer to protect the surface from harmful solar ultraviolet radiation and energetic particles. However, Viking’s analyses of the soil said nothing about whether life may have existed in Mars’ distant past, when liquid water was more abundant. Water in the form of ice exists in abundance on Mars, not too deep beneath its surface (for example, at the ice caps). Water vapor is also a constituent of the atmosphere of Mars.
Surface Features
Early evidence for surface features shaped by the presence of water came from the Mariner 9 mission, including the Valles Marineris, ancient river channels, tear-drop shaped islands and the presence of ice caps. Mariner 9 observed valley networks and outflow channels. Figure 8 below shows valleys and channels taken by the Viking Orbiter and the Mars Global Surveyor.

The camera aboard the Mars Global Surveyor provided high-resolution (down to a few meters, which is good enough to see a small truck or bus) images of gullies on Mars. The gullies were found on the steep walls of valleys and craters at high latitudes and appear to be carved by flowing water. These gullies are very young: not only are there no superimposed impact craters, but in some instances, the gullies seem to cut across recent wind-deposited dunes. Perhaps there is liquid water underground that can occasionally break out to produce short-lived surface flows before the water can freeze or evaporate. The Mars Reconnaissance Orbiter, which arrived at Mars in 2006 and is still active today, also took high resolution images of Martian gullies.
Aqueous Minerals
One way to find signs of past water on Mars is to look for minerals that can only form in the presence of water. These are known as aqueous minerals (the word aqueous comes from the Latin word aqua, meaning water) and there are several different types.
Clay minerals are found in sediments on the sea floor on Earth, and clays have been suggested as the original site for the first life on Earth. They have also been found in a few different locations on Mars, such as the Nili Fossae region.

In 2004, the Opportunity rover found jarosite and hematite at Meridiani Planum on Mars; these are both minerals that form in a watery environment. Jarosite is a sulfate that can indicate interactions with acidic water. The hematite was found in the form of small spheres that resemble blueberries and as such have taken on this descriptive name. Figure 9 to the right shows blueberries on Mars seen next to the Opportunity rover's tracks.
The Curiosity rover landed on Mars in 2012 and has now been there for over 4,000 sols (a sol is a Martian day, which is slightly longer than an Earth day). Curiosity landed in Gale Crater, which was selected as the landing site because of evidence that there were clay minerals and sulfates in the sediments on Mt. Sharp. The video below provides some background on Gale Crater and shows Mt. Sharp at its center. Curiosity has been climbing up Mt. Sharp and studying the composition of its layers. As noted in the video clip, the geological layers starting from the bottom provide a way of looking back at the history of the crater and are especially important in understanding when water existed inside the crater in the past.
The strongest evidence of an ancient habitable environment came from analyzing a very fine-grained rock called a mudstone—a rock type that is widespread on Earth but was unknown on Mars until Curiosity found it. The mudstone can tell us a great deal about the wet environments in which they formed. Curiosity has an instrument called CheMin (short for Chemistry and Mineralogy) on board the rover that can analyze soil and rocks and identify what minerals, and in what quantity, are present. The rover first collects a sample and then deposits it into CheMin for analysis. Figure 10 shows the results for ten sites where samples were collected by Curiosity, starting at the bottom of Gale Crater (Yellowknife Bay) and subsequently as the rover moved up Mt. Sharp. For each site, a pie chart shows what minerals were found. The legend shows the colors used for the pie charts -- notice that clay minerals, jarosite and hematite are all found, and their amounts vary as the rover climbs up the mountain. This provides not only confirmation of past liquid water on Mars but also a detailed look back at how the water varied (for example, the clay minerals appear at Yellowknife Bay and then reappear as the rover reaches Murray Buttes).

Ice
There is water on Mars today but it is in the form of ice. This alone is significant, as it is easy to imagine that some of this ice existed as liquid water when Mars had a warmer environment. Today, ice is found at the polar ice caps, inside craters and below the surface. The Phoenix Mission directly detected water ice on Mars in 2008 (Figure 11). The Phoenix spacecraft landed near the north polar cap in summer. Controllers knew that it would not be able to survive a polar winter, but directly measuring the characteristics of the polar region was deemed important enough to send a dedicated mission. The most exciting discovery came when the spacecraft tried to dig a shallow trench under the spacecraft. When the overlying dust was stripped off, they saw bright white material, apparently some kind of ice. From the way this ice sublimated over the next few days, it was clear that it was frozen water. (Sublimation is the process of a solid turning directly into gas when it is heated)
Organic Compounds
Evidence of liquid water flowing in the past clearly points to Mars once being a habitable planet, albeit more than 3 billion years ago. But life as we know it also needs certain chemical elements that are essential to building amino acids, proteins and DNA. The basic building blocks for life are carbon, hydrogen, oxygen, nitrogen, phosphorous and sulfur (CHNOPS). The Perseverance rover, which landed on the surface of Mars in July of 2021 (two other Mars missions, the UAE's Hope orbiter and China's Tianwen 1 mission, also reached Mars around the same time) is taking the search for life on Mars one step further than the Curiosity rover. Curiosity's main goal was to establish if Mars once was habitable, and much evidence from the Curiosity rover described above supports this claim. Perseverance is looking for evidence of potential biosignatures on Mars. If any biosignatures -- meaning signs of life -- are found by Perseverance, they will still need to be analyzed in great detail to rule out the possibility that they formed naturally rather than by life.
Concept Check
Go to the Mars rock samples site at https://mars.nasa.gov/mars-rock-samples and pick one of samples to study. Describe what was collected and how it may contribute to our understanding of life on Mars.
The Perseverance mission is unique -- it is the first Mars mission to collect samples that will eventually be sent back to Earth for analysis and it also has a helicopter, named Ingenuity! Perseverance is collecting rock and soil samples as it moves around the crater and visits areas such as an ancient river delta. The samples are sealed into tubes and these will eventually will be picked up by a future mission to Mars; some estimates put the sample return date to Earth in the 2030s.
Perseverance has an instrument appropriately named SHERLOC (the H in SHERLOC stands for Habitable -- Scanning Habitable Environments with Raman & Luminescence for Organics & Chemicals) that can detect the presence of organic molecules, as well as aqueous minerals. SHERLOC detected organics in Jezero crater, where the rover is exploring. The Curiosity rover also found organics in Gale crater, but the Perseverance detections have added value as they can be correlated with minerals inside the rocks.
The video clip below gives a tour of Jezero Crater, where Perseverance landed and has been collecting rock and soil samples. In the video, notice that there are mudstones in Jezero crater, just as in the Gale crater that the Curiosity rover is exploring.
NASA's Perseverance Rover explores the surface of Mars.
https://youtu.be/yOplTCgnJFQ?feature=shared
Video Credit: @NASAJPL
Martian Climate Change
The most basic measurements of the Earth are its size, mass, and density. Many features of the Earth have been understood since antiquity. Aristotle argued that the Earth had to be round because the Earth cast a circular shadow over the moon during a lunar eclipse. Eratosthenes of Cyrene obtained a clever measurement of the radius of the Earth that was within 20% of the value that we can measure today. To a good approximation, the Earth is spherical in shape and the volume of the spherical Earth is given by \( \frac{4}{3} \pi R^3 \), where \(R\) is the radius of the Earth.
Armed with knowledge about the volume of Earth, we can use the density of rocks to estimate the mass of Earth. Density is simply the ratio of mass to volume, \(\rho = M/V\), and it tells us how tightly material is packed into an object of a given size. A rock that is about a cubic centimeter in size weighs about 3 grams, so the density of that rock is \(\rho\) = 3 g/cm3. We can then turn the density equation around to estimate the mass of the Earth: M = \(\rho\)V. This estimate is off by a factor of about two since the interior of the Earth is compressed and has a higher density than surface rocks. However, this "order of magnitude" estimate is an excellent approximation - a factor of two is a great start when nothing is known before.
In the early 18th century (and with the benefit of insights from Isaac Newton about the laws of gravity) Henry Cavendish “weighed the Earth” in his lab by cleverly measuring the acceleration of gravity on Earth. Gravity is a property of mass and Cavendish calculated a bulk density for the Earth of 5.48 g/cm3, very close to the currently known value of 5.515 g/cm3.
The density of a planet can easily be calculated if the radius and mass are known, quantities that can be measured even for planets orbiting other stars. The density of a planet gives immense insight into that world. All terrestrial planets in our solar system have higher densities than the jovian gas giants. The average density of the terrestrial planets is 5.0 g/cm3, while the average density for the jovian gas giants is 1.2 g/cm3. Exoplanets with densities that fall in between these values are commonly found and point toward intermediate types of planets that are not found in our solar system. For example, the "mini-Neptune" K2-18 b has an estimated density of 2.6 g/cm3.
Worked Example: Calculating the density of a planet
Looking up the mass and radius of the Earth, and using the density equation we find:
\(\rho = M/V = M/\frac{4}{3} \pi R^3\) = (5.97×1024 kg)/(\(\frac{4}{3} \pi\) (6.38×10⁶ m)3) = 5500 kg/m3
This tells us that an average cubic meter of the Earth contains 5500 kg, or 5.5 metric tons of matter. A cubic meter is about the size of a washing machine. If 5.5 tons seems heavier than you would have guessed, it is because the core density of Earth is greater than the dirt and rocks on the surface of our planet.
It can be more convenient to express densities in units of g/cm3 (grams per cubic centimeter). In these units the density of water is 1 g/cm3 and makes an easy reference point to remember. In these units, \(\rho_{Earth}\) = 5.5 g/cm3
Extra: Saturn has the lowest density in our solar system, with a value of $\rho_Saturn$ = 0.7 g/cm3. How many times denser is the Earth than Saturn?
Show Answer
7.9 -- the Earth is almost 8 times more dense than Saturn
Another property that also depends on the mass and radius of a planet is surface gravity. The equation for finding the surface gravity (g) of a world is: \(g=G M/R^2\). Here, \(G\) is the gravitational constant and we can easily make comparisons of the surface gravities of different worlds by taking their ratio relative to Earth. Table 1 lists the densities for the planets in our solar system and their surface gravities relative to the surface gravity of Earth. The surface gravity helps to assess if rocky planets can hold onto their atmosphere.
| Mercury | Venus | Earth | Mars | Jupiter | Saturn | Uranus | Neptune | |
| ρ (g/cm3) | 5.4 | 5.2 | 5.5 | 3.9 | 1.3 | 0.7 | 1.3 | 1.6 |
| g (relative to Earth) | 0.38 | 0.91 | 1 | 0.38 | 2.4 | 0.92 | 0.89 | 1.1 |
The size of a world is also directly related to how fast it cools down. All planets start off in a molten state and over time the energy is radiated away into space. The cooling time of an object depends on the ratio of the surface area to the volume ($\frac{SA}{V}$) of a planet. Since the surface area of a sphere is $SA = 4\pi R^2$ and the volume of a sphere is $V = \frac{4}{3} \pi R^3$, this means that the cooling time is proportional to $\frac{1}{R}$. This means that there is an inverse relationship between the cooling time for a world and its radius, and a smaller world cools off faster than a world with a larger radius. How quickly a world loses its heat (putting aside for a moment the question of what creates the heat inside of a world) can be understood with a simple example from everyday life. Consider a large, hot baked potato and a small piece cut off the larger potato: which cools first? Intuition tells us it is the smaller piece, and this intuition is correct. In our solar system, the worlds with the smallest size indeed have cooled the fastest: the asteroid Ceres, the Moon, and Mercury have all entirely lost their internal heat and are geologically dead.
The fact that smaller worlds lose their internal heat (or cool off) more quickly than larger worlds is a fundamental reason why the Earth is hospitable to life. The Earth still has heat inside that can power geological activities such as plate tectonics that stabilize our atmosphere.
Prospects for Life
Five decades of robotic exploration have allowed us to develop a picture of how Mars evolved through time. Early Mars had epochs of warmer and wetter conditions that would have been conducive to life at the surface. However, Mars eventually lost much of its early atmosphere and the surface water began to dry up. As that happened, the ever-shrinking reservoirs of liquid water on the martian surface became saltier and more acidic, until the surface finally had no significant liquid water and was bathed in harsh solar radiation. The surface thus became uninhabitable, but this might not be the case for the planet overall.
Reservoirs of ice and liquid water could still exist underground, where pressure and temperature conditions make it stable. There is recent evidence to suggest that liquid water (probably very salty water) can occasionally (and briefly) flow on the surface even today. Thus, Mars might even have habitable conditions in the present day, but of a much different sort than we normally think of on Earth.
Our study of Mars reveals a planet with a fascinating history—one that saw its ability to host surface life dwindle billions of years ago, but perhaps allowing life to adapt and survive in favorable environmental niches. Even if life did not survive, we expect that we might find evidence of life if it ever took hold on Mars. If it is there, it is hidden in the crust, and we are still learning how best to decipher that evidence.
Want to know more: Rare Earth?
-
With the discovery of planets orbiting other stars in the 1990s, enthusiasm was mounting for the search for life on other worlds. In 2000, a popular book, "Rare Earth," by Ward and Brownlee, suggested that primitive life is very common but technological life is rare. Without a single other example of life beyond Earth, the book spurred a lot of discussion among scientists and the interested public.
The main premise of the book was that too many random, chance conditions were required for homosapiens to evolve. In addition, once our technological species appeared, there were new threats to the survival of life (nuclear war, climate change, over-population). Some of the essential conditions and circumstances identified by Brownlee and Ward are listed in the Table below.
Essential Characteristic Reasoning Right mass planet Too low mass and the planet could not hang on to its atmosphere; too high mass and the high surface pressure would impede evolution of animals. Right mass star Too high mass and the star would have a very short lifetime and emit most of its energy at damaging ultraviolet wavelengths; too low mass and strong magnetic activity from the star would strip away the planet atmosphere. Habitable zone orbit Too close and the planet would experience runaway greenhouse warming, like Venus; too far and liquid water would be frozen and biochemical reaction rates would be sluggish. Atmosphere An atmosphere is needed to protect life from ultraviolet radiation. Oxygen The invention of photosynthesis was required to produce atmospheric oxygen for efficient aerobic metabolisms. Microbes could be successful organisms in anaerobic conditions, but not complex eukaryotes. Liquid water Some surface water, but not so much as to cover all of the land (hard for technology to develop under water). Plate tectonics To participate in a negative feedback loop and stabilize the climate. Global magnetic field Without a global magnetic field, the wind of charged particles from the surface of the host star will strip away the atmosphere. Large moon To stabilize the tilt of the planet. Mars-like world So prebiotic chemistry and life could get a head start. Gas Giant outer planet To act as a sink for incoming comets. Right location in the galaxy Too close to the galactic center and high energy radiation from massive stars would be a threat; too far out in the galactic disk and there would be less chemical enrichment. Mass extinctions Some mass extinctions to allow for biodiversity, but not too many. The counter point made by many scientists was that the argument was too anthropomorphic. Some characteristics make sense (right mass planet, atmosphere, water) but others seem less relevant, for a few different reasons:
Not a bottleneck: The circumstances that allowed life on our planet might not be a requirement for life elsewhere. Some characteristics do not present a bottleneck. There are hundreds of billions of "right mass stars," and very few OB stars with short lives and peak energy emission of damaging ultraviolet radiation. It now appears that there are also billions of planets similar in mass to the Earth and orbiting in the habitable zone. Many of these stars and planets reside in intermediate regions in the galactic disk.
Redundant: Some of the characteristics are interrelated. In the same way that there is redundancy in the requirement: "you have to have a tree and it has to have leaves and it has to have a trunk and branches," some of the characteristics follow "for free" from others. A large subset of Earth-like planets in the habitable zone will have liquid water, plate tectonics, and global magnetic fields. They will naturally outgas or accrete atmospheres.
Uncertain impact: Other factors in Ward & Brownlee's list have an uncertain impact. Did we really need Mars to jump-start life on Earth? If we didn't have Jupiter, would there be fewer objects trapped in the asteroid belt? Would a few more impacts have been a good thing for life on Earth? Does it matter if the obliquity of the Earth precesses at a faster or slower rate?
Mass extinctions fall on the spectrum of natural selection, which must be fundamental for life. It does seem likely that simple microbial life will be far more common than complex organisms. There is likely a pyramid scheme for life, with single cell organisms at the bottom, and complex organisms like whales, velociraptors, and humans near the top. This is exactly what astrobiologists are trying to learn.
Key Concepts and Summary
Craters on the surface of small bodies like Mars show that erosive processes no longer exist on these objects. The small mass and size of Mars means that this planet has lost most of its atmosphere. However, features on the surface of Mars suggest that this planet once had bodies of surface water, making one of our closest neighbors a key target for exploration with NASA missions. NASA rovers dig beneath the surface and analyze Martian soil for signs of biochemical processes or even simple cellular life.
Review Questions
Summary Questions
- When did the first dedicated experiments to search for life on Mars begin? Discuss some of the ideas about life on Mars that predated these searches.
- What are the main properties of the planet Mars (for example, its density and surface gravity)? How do these properties relate to the possible habitability of Mars?
- How is the geology of Mars similar to that on Earth? How does it differ?
- What molecules make up the atmosphere of Mars?
- Does Mars have a magnetic field today, and did it have one in the past? Explain your answer.
- What are aqueous minerals? How can their presence point toward the conditions for life on Mars?
Exercises
Although it is dry and seemingly barren today, our next-door neighbor Mars may have once been a habitable planet. Finding any life on Mars, even a microbe, would represent a leap in our understanding of life in the universe, as it would mean that life existed in two separate locations in one solar system. Humans have been exploring the Red Planet with unmanned spacecraft since the 1960s and a great deal of evidence has emerged in support of a warmer and wetter Mars in the past. In this chapter, we review some of the key findings that point toward a once habitable Mars.
Learning Objectives
By the end of this chapter, you will be able to:
- Discuss findings from early missions in the 20th century to explore Mars
- Describe the terrain and geological features of Mars
- Discuss several lines of evidence that suggest Mars had liquid water on its surface in the past
- Describe the various rover space missions to Mars and what they have found so far
History and Early Missions
The possibility that Mars hosts, or has hosted, life has a rich history dating back to at least the middle of the nineteenth century. William Herschel observed Mars in 1783 and noted that Earth and Mars share some commonalities, such as having an atmosphere and going through seasonal cycles. By 1840, the length of a day on Mars was known to be very similar to that for the Earth, at just over 24 hours. These similarities between Earth and Mars fueled speculation that Mars, too, could harbor life. The Italian astronomer Giovanni Schiaparelli made detailed sketches of the Martian surface in 1877 and he labeled some straight line features as "canali," an Italian word that can be translated to mean channels or canals, where channels are a natural geological feature and canals are manmade. That same year, 1877, American astronomer Asaph Hall discovered two small moons orbiting Mars; Hall named these moons Phobos and Deimos, meaning fear and panic, after the sons of Ares (the Greek counterpart of Mars).
The American astronomer Percival Lowell, the brother of the poet Amy Lowell, was intrigued by the possibility of life on Mars suggested by Schiaparelli's straight line "canali" features. Lowell, who came from a wealthy Boston family, built an observatory in Flagstaff, Arizona, called Lowell Observatory, in 1894 to undertake his observations of the surface of Mars. Lowell also published several books about the possibility of life on Mars, including Mars As The Abode Of Life and Mars And Its Canals. Not all scientists subscribed to Lowell's view that Mars was inhabited, and in 1894 Edward Barnard made his own observations and did not see the straight line canals observed by Schiaparelli and Lowell. To add to the public's imagination, H.G. Wells published his sci-fi novel The War of the Worlds in 1897.
The idea that Mars was inhabited by advanced life persisted throughout a good deal of the 20th century. The book Intelligent Life in the Universe, written by I.S. Shklovskii and Carl Sagan in 1966, includes a chapter dedicated to the possibility that the two moons of Mars are not natural but were artificially created by inhabitants of Mars. This was one year after the first images of Mars came in from the Mariner 4 mission. English artist David Bowie chimed in in 1971 with his hit song "Life on Mars?". In 1976, prior to the Viking missions landing on Mars, Carl Sagan and Joshua Lederberg published the article "The prospects for life on Mars: A pre-Viking assessment" in the journal Icarus. In the abstract, they note:
"Large organisms, possibly detectable by the Viking lander cameras, are not only possible on Mars; they may be favored."
Mariner and Viking Missions
A global view of Mars emerged after images from the Mariner flyby and orbiter missions were transmitted back to Earth. The first visitor was the US Mariner 4, which flew past Mars in 1965 and transmitted 22 photos to Earth. These pictures showed an apparently bleak planet with abundant impact craters. In those days, craters were unexpected; some people who were romantically inclined still hoped to see canals or something like them. In any case, newspaper headlines sadly announced that Mars was a “dead planet.” In 1971, NASA’s Mariner 9 became the first spacecraft to orbit another planet, mapping the entire surface of Mars at a resolution of about 1 kilometer and discovering a great variety of geological features, including volcanoes, huge canyons, intricate layers on the polar caps, and channels that appeared to have been cut by running water. Mariner 9 also collected data about the Martian atmosphere using two spectrometers on board. Geologically, Mars didn’t look quite so dead after all. The data from Mariner 9 allowed the Viking 1 and 2 missions to launch in 1975 and successfully land on Mars in 1976.
The Viking camera's did not reveal any large organisms on Mars (unless they hopped on the cameras to avoid being seen). But it did show a compelling view of the rock-strewn rusty surface of Mars. The Viking landers landed in different regions of Mars: Viking 1 at Chryse Planitia and Viking 2 at Utopia Planitia. Both of these regions are fairly smooth plains in the northern lowlands of Mars and were chosen to help ensure a safe landing, but they also contain features that, from previous images, looked like they could be associated with water. The Viking missions contained the tools to perform soil experiments on Mars, with the goal of looking for evidence of life. These experiments are discussed in detail below.
Extraordinary Claims: The Face on Mars
People like human faces. We humans have developed great skill in recognizing people and interpreting facial expressions. We also have a tendency to see faces in many natural formations, from clouds to the man in the Moon. One of the curiosities that emerged from the Viking orbiters’ global mapping of Mars was the discovery of a strangely shaped mesa in the Cydonia region that resembled a human face. Despite later rumors of a cover-up, the “Face on Mars” was, in fact, recognized by Viking scientists and included in one of the early mission press releases. At the low resolution and oblique lighting under which the Viking image was obtained, the mile-wide mesa had something of a Sphinx-like appearance.
Unfortunately, a small band of individuals decided that this formation was an artificial, carved sculpture of a human face placed on Mars by an ancient civilization that thrived there hundreds of thousands of years ago. A band of “true believers” grew around the face and tried to deduce the nature of the “sculptors” who made it. This group also linked the face to a variety of other pseudoscientific phenomena such as crop circles (patterns in fields of grain, mostly in Britain, now known to be the work of pranksters).
Members of this group accused NASA of covering up evidence of intelligent life on Mars, and they received a great deal of help in publicizing their perspective from tabloid media. Some of the believers picketed the Jet Propulsion Laboratory at the time of the failure of the Mars Observer spacecraft, circulating stories that the “failure” of the Mars Observer was itself a fake, and that its true (secret) mission was to photograph the face.
The high-resolution Mars Observer camera (MOC) was reflown on the Mars Global Surveyor mission, which arrived at Mars in 1997. On April 5, 1998, in Orbit 220, the MOC obtained an oblique image of the face at a resolution of 4 meters per pixel, a factor-of-10 improvement in resolution over the Viking image. Another image in 2001 had even higher resolution. Immediately released by NASA, the new images showed a low mesa-like hill cut crossways by several roughly linear ridges and depressions, which were misidentified in the 1976 photo as the eyes and mouth of a face. Only with an enormous dose of imagination can any resemblance to a face be seen in the new images, demonstrating how dramatically our interpretation of geology can change with large improvements in resolution. The original and the higher resolution images can be seen in Figure 5 below.
After 20 years of promoting pseudoscientific interpretations and various conspiracy theories, can the “Face on Mars” believers now accept reality? Unfortunately, it does not seem so. They have accused NASA of faking the new picture. They also suggest that the secret mission of the Mars Observer included a nuclear bomb used to destroy the face before it could be photographed in greater detail by the Mars Global Surveyor.
Space scientists find these suggestions incredible. NASA is spending increasing sums for research on life in the universe, and a major objective of current and upcoming Mars missions is to search for evidence of past microbial life on Mars. Conclusive evidence of extraterrestrial life would be one of the great discoveries of science and incidentally might well lead to increased funding for NASA. The idea that NASA or other government agencies would (or could) mount a conspiracy to suppress such welcome evidence is truly bizarre.
Alas, the “Face on Mars” story is only one example of a whole series of conspiracy theories that are kept before the public by dedicated believers, by people out to make a fast buck, and by irresponsible media attention. Others include the “urban legend” that the Air Force has the bodies of extraterrestrials at a secret base, the widely circulated report that UFOs crashed near Roswell, New Mexico (actually it was a balloon carrying scientific instruments to find evidence of Soviet nuclear tests), or the notion that alien astronauts helped build the Egyptian pyramids and many other ancient monuments because our ancestors were too stupid to do it alone.
Geology of Mars
After the Viking missions concluded, Mars was not visited by spacecraft again until the 1990s. Beginning with the Mars Pathfinder and Mars Global Surveyor missions in 1997, there have been over a dozen successful missions to explore Mars in the past 25 years. Each mission has contributed in various ways to our global understanding of Mars as a planet. Several missions, which we highlight in the next section, have had a specific goal of assessing the habitability of Mars or looking for signs of life.
The map below (Figure 7) was created using an altimeter -- an instrument that uses lasers to measure the altitude (or height) of different parts of the surface -- onboard the Mars Global Surveyor. The map is color-coded by the height of the surface, where the yellow regions are "ground level" at 0 km, blue/purple regions are at depths of about 5-7 km, and the grey/white regions have the highest altitudes, at over 12 km high for the white circular regions (these white circles are the tops of volcanoes). The Martian volcano Olympus Mons stands at a height of over 22 km, which is more than twice the height of Earth's tallest mountain from base to peak (Mauna Kea in Hawaii, part of which is under water), making Olympus Mons the tallest known mountain in the solar system.
Other notable features are seen on the Martian surface, such as the Valles Marineras (Mariner Valleys, named for the Mariner 9 mission which first revealed them). Valles Marineras is a canyon system that extend for about 5000 kilometers (nearly a quarter of the way around Mars) along the slopes of the Tharsis bulge. If it were on Earth, this canyon system would stretch all the way from Los Angeles to Washington, DC.
Concept Check: the Surface of Mars
Looking at the topographic map above of Mars (Figure 7), which regions are at the highest altitudes (elevation) and which regions are at the lowest altitudes? What do you think created Hellas Basin?
Can you find the Chryse and Utopia Planitia, the landing sites for Viking 1 and 2? Are these regions as deep as the Hellas Basin?
To further explore the terrain of Mars, you can load up Google Mars! Go to https://www.google.com/mars/ and start exploring. For example, you can click on "Spacecraft" at the top and see the locations of different Martian landers and rovers.
Globally, Mars has two distinct regions: the heavily cratered highlands in the southern hemisphere and the smoother low-lying volcanic plains (the "lowlands") in the northern hemisphere. The Moon also has similar surface geology, with the smoother plains (the lunar mare) representing a younger surface that was "re-paved" by lava around 3.5 billion years ago. Based on counting the numbers of craters in different regions and analysis of layered rocks, the geological history of Mars can be broken down into three eons: the Noachian, the Hesperian, and the Amazonian.
General Properties of Mars
We can gain some insight into the current conditions on Mars by considering its size and distance from the Sun. Mars is smaller than the Earth, with a radius about half that of the Earth and a mass of about 10% that of the Earth. The density of Mars is 3.9 g/cm3 (Earth's density is 5.5 g/cm3), which suggests a composition consisting primarily of silicates but with a small metal core. The smaller size of Mars compared to Earth means that Mars loses its internal heat more rapidly than the Earth, since the cooling rate depends on the radius. Mars has a surface gravity that is just 38% the value of Earth's surface gravity, meaning that material can escape more easily from Mars' gravitational pull. Finally, we note that Mars is about 50% further away from the Sun than the Earth is, meaning that Mars receives less energy from the Sun. Venus is closer to the Sun than Earth and consequently experienced a runaway greenhouse effect. Mars, on the other hand, experienced a runaway "icehouse" effect.
Today, Mars has lost almost all of its original atmosphere because of its low surface gravity and stripping by the solar wind (a stream of highly energetic particles emitted by the Sun). Mars also no longer has a protective magnetosphere so, if any life did currently exist on Mars, it would be challenging for it to survive in a high-radiation environment, which includes cosmic rays.
The Search for Life
In the quest to find life on Mars, either in the past or present, we can look evidence of liquid water and for the essential elements that make up all life on Earth -- CHNOPS. Given the commonalities between Mars and Earth noted earlier, such as a similar cycle of seasons and surface geology, we might expect that life could have formed in the same manner around the same time on early Mars as on Earth if there was liquid water in the past.
The Viking Biology Experiments
The earliest missions to Mars provided some hints that liquid water—one of life’s primary requirements—may once have flowed on the surface, and later missions have strengthened this conclusion. The NASA Viking landers, whose purpose was to search directly for evidence of life on Mars, arrived on Mars in 1976.
There were four different experiments that the Viking landers were equipped to conduct to look for byproducts of life in the Martian soil. The experiments were: gas-exchange (GEX), pyrolitic release (PR), labeled release (LR) and the gas chromatograph mass spectrometer (GCMS). The GEX and LR experiments both worked by adding nutrients to the soil and then attempting to detect gases released by organisms that consumed the nutrients. The PR experiment simulated the early Martian atmosphere and looked for signs of photosynthetic organisms. GCMS was slightly different in that its goal was to look for organic materials in the soil. Of the four experiments, only the LR produced positive results. However, the LR results have generally been deemed insufficient evidence for life since the GCMS experiments did not find any organics in the soil. However, some of the scientists who designed the LR experiment still interpret the results as supporting life. Extraordinary claims...
Viking’s onboard instruments found no organic molecules (the stuff of which life is made), and no evidence of biological activity in the martian soils it analyzed. The lack of any biological activity in the Martian soil is not particularly surprising because, despite the evidence of flowing liquid water in the past, liquid water on the surface of Mars is generally not stable today. Over much of the Martian surface, temperatures and pressures are so low that pure water would either freeze or boil away (under very low pressures, water will boil at a much lower temperature than usual). To make matters worse, unlike Earth, Mars does not have a magnetic field and ozone layer to protect the surface from harmful solar ultraviolet radiation and energetic particles. However, Viking’s analyses of the soil said nothing about whether life may have existed in Mars’ distant past, when liquid water was more abundant. Water in the form of ice exists in abundance on Mars, not too deep beneath its surface (for example, at the ice caps). Water vapor is also a constituent of the atmosphere of Mars.
Surface Features
Early evidence for surface features shaped by the presence of water came from the Mariner 9 mission, including the Valles Marineris, ancient river channels, tear-drop shaped islands and the presence of ice caps. Mariner 9 observed valley networks and outflow channels. Figure 8 below shows valleys and channels taken by the Viking Orbiter and the Mars Global Surveyor.
The camera aboard the Mars Global Surveyor provided high-resolution (down to a few meters, which is good enough to see a small truck or bus) images of gullies on Mars. The gullies were found on the steep walls of valleys and craters at high latitudes and appear to be carved by flowing water. These gullies are very young: not only are there no superimposed impact craters, but in some instances, the gullies seem to cut across recent wind-deposited dunes. Perhaps there is liquid water underground that can occasionally break out to produce short-lived surface flows before the water can freeze or evaporate. The Mars Reconnaissance Orbiter, which arrived at Mars in 2006 and is still active today, also took high resolution images of Martian gullies.
Aqueous Minerals
One way to find signs of past water on Mars is to look for minerals that can only form in the presence of water. These are known as aqueous minerals (the word aqueous comes from the Latin word aqua, meaning water) and there are several different types.
Clay minerals are found in sediments on the sea floor on Earth, and clays have been suggested as the original site for the first life on Earth. They have also been found in a few different locations on Mars, such as the Nili Fossae region.
In 2004, the Opportunity rover found jarosite and hematite at Meridiani Planum on Mars; these are both minerals that form in a watery environment. Jarosite is a sulfate that can indicate interactions with acidic water. The hematite was found in the form of small spheres that resemble blueberries and as such have taken on this descriptive name. Figure 9 to the right shows blueberries on Mars seen next to the Opportunity rover's tracks.
The Curiosity rover landed on Mars in 2012 and has now been there for over 4,000 sols (a sol is a Martian day, which is slightly longer than an Earth day). Curiosity landed in Gale Crater, which was selected as the landing site because of evidence that there were clay minerals and sulfates in the sediments on Mt. Sharp. The video below provides some background on Gale Crater and shows Mt. Sharp at its center. Curiosity has been climbing up Mt. Sharp and studying the composition of its layers. As noted in the video clip, the geological layers starting from the bottom provide a way of looking back at the history of the crater and are especially important in understanding when water existed inside the crater in the past.
The strongest evidence of an ancient habitable environment came from analyzing a very fine-grained rock called a mudstone—a rock type that is widespread on Earth but was unknown on Mars until Curiosity found it. The mudstone can tell us a great deal about the wet environments in which they formed. Curiosity has an instrument called CheMin (short for Chemistry and Mineralogy) on board the rover that can analyze soil and rocks and identify what minerals, and in what quantity, are present. The rover first collects a sample and then deposits it into CheMin for analysis. Figure 10 shows the results for ten sites where samples were collected by Curiosity, starting at the bottom of Gale Crater (Yellowknife Bay) and subsequently as the rover moved up Mt. Sharp. For each site, a pie chart shows what minerals were found. The legend shows the colors used for the pie charts -- notice that clay minerals, jarosite and hematite are all found, and their amounts vary as the rover climbs up the mountain. This provides not only confirmation of past liquid water on Mars but also a detailed look back at how the water varied (for example, the clay minerals appear at Yellowknife Bay and then reappear as the rover reaches Murray Buttes).
Ice
There is water on Mars today but it is in the form of ice. This alone is significant, as it is easy to imagine that some of this ice existed as liquid water when Mars had a warmer environment. Today, ice is found at the polar ice caps, inside craters and below the surface. The Phoenix Mission directly detected water ice on Mars in 2008 (Figure 11). The Phoenix spacecraft landed near the north polar cap in summer. Controllers knew that it would not be able to survive a polar winter, but directly measuring the characteristics of the polar region was deemed important enough to send a dedicated mission. The most exciting discovery came when the spacecraft tried to dig a shallow trench under the spacecraft. When the overlying dust was stripped off, they saw bright white material, apparently some kind of ice. From the way this ice sublimated over the next few days, it was clear that it was frozen water. (Sublimation is the process of a solid turning directly into gas when it is heated)
Organic Compounds
Evidence of liquid water flowing in the past clearly points to Mars once being a habitable planet, albeit more than 3 billion years ago. But life as we know it also needs certain chemical elements that are essential to building amino acids, proteins and DNA. The basic building blocks for life are carbon, hydrogen, oxygen, nitrogen, phosphorous and sulfur (CHNOPS). The Perseverance rover, which landed on the surface of Mars in July of 2021 (two other Mars missions, the UAE's Hope orbiter and China's Tianwen 1 mission, also reached Mars around the same time) is taking the search for life on Mars one step further than the Curiosity rover. Curiosity's main goal was to establish if Mars once was habitable, and much evidence from the Curiosity rover described above supports this claim. Perseverance is looking for evidence of potential biosignatures on Mars. If any biosignatures -- meaning signs of life -- are found by Perseverance, they will still need to be analyzed in great detail to rule out the possibility that they formed naturally rather than by life.
Concept Check
Go to the Mars rock samples site at https://mars.nasa.gov/mars-rock-samples and pick one of samples to study. Describe what was collected and how it may contribute to our understanding of life on Mars.
The Perseverance mission is unique -- it is the first Mars mission to collect samples that will eventually be sent back to Earth for analysis and it also has a helicopter, named Ingenuity! Perseverance is collecting rock and soil samples as it moves around the crater and visits areas such as an ancient river delta. The samples are sealed into tubes and these will eventually will be picked up by a future mission to Mars; some estimates put the sample return date to Earth in the 2030s.
Perseverance has an instrument appropriately named SHERLOC (the H in SHERLOC stands for Habitable -- Scanning Habitable Environments with Raman & Luminescence for Organics & Chemicals) that can detect the presence of organic molecules, as well as aqueous minerals. SHERLOC detected organics in Jezero crater, where the rover is exploring. The Curiosity rover also found organics in Gale crater, but the Perseverance detections have added value as they can be correlated with minerals inside the rocks.
The video clip below gives a tour of Jezero Crater, where Perseverance landed and has been collecting rock and soil samples. In the video, notice that there are mudstones in Jezero crater, just as in the Gale crater that the Curiosity rover is exploring.
NASA's Perseverance Rover explores the surface of Mars.
https://youtu.be/yOplTCgnJFQ?feature=shared
Video Credit: @NASAJPL
Martian Climate Change
The most basic measurements of the Earth are its size, mass, and density. Many features of the Earth have been understood since antiquity. Aristotle argued that the Earth had to be round because the Earth cast a circular shadow over the moon during a lunar eclipse. Eratosthenes of Cyrene obtained a clever measurement of the radius of the Earth that was within 20% of the value that we can measure today. To a good approximation, the Earth is spherical in shape and the volume of the spherical Earth is given by $\frac{4}{3} \pi R^3$, where $R$ is the radius of the Earth.
Armed with knowledge about the volume of Earth, we can use the density of rocks to estimate the mass of Earth. Density is simply the ratio of mass to volume, $\rho = M/V$, and it tells us how tightly material is packed into an object of a given size. A rock that is about a cubic centimeter in size weighs about 3 grams, so the density of that rock is $\rho$ = 3 g/cm3. We can then turn the density equation around to estimate the mass of the Earth: M = $\rho$V. This estimate is off by a factor of about two since the interior of the Earth is compressed and has a higher density than surface rocks. However, this "order of magnitude" estimate is an excellent approximation - a factor of two is a great start when nothing is known before.
In the early 18th century (and with the benefit of insights from Isaac Newton about the laws of gravity) Henry Cavendish “weighed the Earth” in his lab by cleverly measuring the acceleration of gravity on Earth. Gravity is a property of mass and Cavendish calculated a bulk density for the Earth of 5.48 g/cm3, very close to the currently known value of 5.515 g/cm3.
The density of a planet can easily be calculated if the radius and mass are known, quantities that can be measured even for planets orbiting other stars. The density of a planet gives immense insight into that world. All terrestrial planets in our solar system have higher densities than the jovian gas giants. The average density of the terrestrial planets is 5.0 g/cm3, while the average density for the jovian gas giants is 1.2 g/cm3. Exoplanets with densities that fall in between these values are commonly found and point toward intermediate types of planets that are not found in our solar system. For example, the "mini-Neptune" K2-18 b has an estimated density of 2.6 g/cm3.
Worked Example: Calculating the density of a planet
Looking up the mass and radius of the Earth, and using the density equation we find:
$\rho = M/V = M/\frac{4}{3} \pi R^3$ = (5.97×1024 kg)/($\frac{4}{3} \pi$ (6.38×10⁶ m)3) = 5500 kg/m3
This tells us that an average cubic meter of the Earth contains 5500 kg, or 5.5 metric tons of matter. A cubic meter is about the size of a washing machine. If 5.5 tons seems heavier than you would have guessed, it is because the core density of Earth is greater than the dirt and rocks on the surface of our planet.
It can be more convenient to express densities in units of g/cm3 (grams per cubic centimeter). In these units the density of water is 1 g/cm3 and makes an easy reference point to remember. In these units, $\rho_{Earth}$ = 5.5 g/cm3
Extra: Saturn has the lowest density in our solar system, with a value of $\rho_Saturn$ = 0.7 g/cm3. How many times denser is the Earth than Saturn?
Show Answer
7.9 -- the Earth is almost 8 times more dense than Saturn
Another property that also depends on the mass and radius of a planet is surface gravity. The equation for finding the surface gravity (g) of a world is: $g=G M/R^2$. Here, $G$ is the gravitational constant and we can easily make comparisons of the surface gravities of different worlds by taking their ratio relative to Earth. Table 1 lists the densities for the planets in our solar system and their surface gravities relative to the surface gravity of Earth. The surface gravity helps to assess if rocky planets can hold onto their atmosphere.
| Mercury | Venus | Earth | Mars | Jupiter | Saturn | Uranus | Neptune | |
| ρ (g/cm3) | 5.4 | 5.2 | 5.5 | 3.9 | 1.3 | 0.7 | 1.3 | 1.6 |
| g (relative to Earth) | 0.38 | 0.91 | 1 | 0.38 | 2.4 | 0.92 | 0.89 | 1.1 |
The size of a world is also directly related to how fast it cools down. All planets start off in a molten state and over time the energy is radiated away into space. The cooling time of an object depends on the ratio of the surface area to the volume ($\frac{SA}{V}$) of a planet. Since the surface area of a sphere is $SA = 4\pi R^2$ and the volume of a sphere is $V = \frac{4}{3} \pi R^3$, this means that the cooling time is proportional to $\frac{1}{R}$. This means that there is an inverse relationship between the cooling time for a world and its radius, and a smaller world cools off faster than a world with a larger radius. How quickly a world loses its heat (putting aside for a moment the question of what creates the heat inside of a world) can be understood with a simple example from everyday life. Consider a large, hot baked potato and a small piece cut off the larger potato: which cools first? Intuition tells us it is the smaller piece, and this intuition is correct. In our solar system, the worlds with the smallest size indeed have cooled the fastest: the asteroid Ceres, the Moon, and Mercury have all entirely lost their internal heat and are geologically dead.
The fact that smaller worlds lose their internal heat (or cool off) more quickly than larger worlds is a fundamental reason why the Earth is hospitable to life. The Earth still has heat inside that can power geological activities such as plate tectonics that stabilize our atmosphere.
Prospects for Life
Five decades of robotic exploration have allowed us to develop a picture of how Mars evolved through time. Early Mars had epochs of warmer and wetter conditions that would have been conducive to life at the surface. However, Mars eventually lost much of its early atmosphere and the surface water began to dry up. As that happened, the ever-shrinking reservoirs of liquid water on the martian surface became saltier and more acidic, until the surface finally had no significant liquid water and was bathed in harsh solar radiation. The surface thus became uninhabitable, but this might not be the case for the planet overall.
Reservoirs of ice and liquid water could still exist underground, where pressure and temperature conditions make it stable. There is recent evidence to suggest that liquid water (probably very salty water) can occasionally (and briefly) flow on the surface even today. Thus, Mars might even have habitable conditions in the present day, but of a much different sort than we normally think of on Earth.
Our study of Mars reveals a planet with a fascinating history—one that saw its ability to host surface life dwindle billions of years ago, but perhaps allowing life to adapt and survive in favorable environmental niches. Even if life did not survive, we expect that we might find evidence of life if it ever took hold on Mars. If it is there, it is hidden in the crust, and we are still learning how best to decipher that evidence.
Want to know more: Rare Earth?
-
With the discovery of planets orbiting other stars in the 1990s, enthusiasm was mounting for the search for life on other worlds. In 2000, a popular book, "Rare Earth," by Ward and Brownlee, suggested that primitive life is very common but technological life is rare. Without a single other example of life beyond Earth, the book spurred a lot of discussion among scientists and the interested public.
The main premise of the book was that too many random, chance conditions were required for homosapiens to evolve. In addition, once our technological species appeared, there were new threats to the survival of life (nuclear war, climate change, over-population). Some of the essential conditions and circumstances identified by Brownlee and Ward are listed in the Table below.
Essential Characteristic Reasoning Right mass planet Too low mass and the planet could not hang on to its atmosphere; too high mass and the high surface pressure would impede evolution of animals. Right mass star Too high mass and the star would have a very short lifetime and emit most of its energy at damaging ultraviolet wavelengths; too low mass and strong magnetic activity from the star would strip away the planet atmosphere. Habitable zone orbit Too close and the planet would experience runaway greenhouse warming, like Venus; too far and liquid water would be frozen and biochemical reaction rates would be sluggish. Atmosphere An atmosphere is needed to protect life from ultraviolet radiation. Oxygen The invention of photosynthesis was required to produce atmospheric oxygen for efficient aerobic metabolisms. Microbes could be successful organisms in anaerobic conditions, but not complex eukaryotes. Liquid water Some surface water, but not so much as to cover all of the land (hard for technology to develop under water). Plate tectonics To participate in a negative feedback loop and stabilize the climate. Global magnetic field Without a global magnetic field, the wind of charged particles from the surface of the host star will strip away the atmosphere. Large moon To stabilize the tilt of the planet. Mars-like world So prebiotic chemistry and life could get a head start. Gas Giant outer planet To act as a sink for incoming comets. Right location in the galaxy Too close to the galactic center and high energy radiation from massive stars would be a threat; too far out in the galactic disk and there would be less chemical enrichment. Mass extinctions Some mass extinctions to allow for biodiversity, but not too many. The counter point made by many scientists was that the argument was too anthropomorphic. Some characteristics make sense (right mass planet, atmosphere, water) but others seem less relevant, for a few different reasons:
Not a bottleneck: The circumstances that allowed life on our planet might not be a requirement for life elsewhere. Some characteristics do not present a bottleneck. There are hundreds of billions of "right mass stars," and very few OB stars with short lives and peak energy emission of damaging ultraviolet radiation. It now appears that there are also billions of planets similar in mass to the Earth and orbiting in the habitable zone. Many of these stars and planets reside in intermediate regions in the galactic disk.
Redundant: Some of the characteristics are interrelated. In the same way that there is redundancy in the requirement: "you have to have a tree and it has to have leaves and it has to have a trunk and branches," some of the characteristics follow "for free" from others. A large subset of Earth-like planets in the habitable zone will have liquid water, plate tectonics, and global magnetic fields. They will naturally outgas or accrete atmospheres.
Uncertain impact: Other factors in Ward & Brownlee's list have an uncertain impact. Did we really need Mars to jump-start life on Earth? If we didn't have Jupiter, would there be fewer objects trapped in the asteroid belt? Would a few more impacts have been a good thing for life on Earth? Does it matter if the obliquity of the Earth precesses at a faster or slower rate?
Mass extinctions fall on the spectrum of natural selection, which must be fundamental for life. It does seem likely that simple microbial life will be far more common than complex organisms. There is likely a pyramid scheme for life, with single cell organisms at the bottom, and complex organisms like whales, velociraptors, and humans near the top. This is exactly what astrobiologists are trying to learn.
Key Concepts and Summary
Craters on the surface of small bodies like Mars show that erosive processes no longer exist on these objects. The small mass and size of Mars means that this planet has lost most of its atmosphere. However, features on the surface of Mars suggest that this planet once had bodies of surface water, making one of our closest neighbors a key target for exploration with NASA missions. NASA rovers dig beneath the surface and analyze Martian soil for signs of biochemical processes or even simple cellular life.
Review Questions
Summary Questions
- When did the first dedicated experiments to search for life on Mars begin? Discuss some of the ideas about life on Mars that predated these searches.
- What are the main properties of the planet Mars (for example, its density and surface gravity)? How do these properties relate to the possible habitability of Mars?
- How is the geology of Mars similar to that on Earth? How does it differ?
- What molecules make up the atmosphere of Mars?
- Does Mars have a magnetic field today, and did it have one in the past? Explain your answer.
- What are aqueous minerals? How can their presence point toward the conditions for life on Mars?
Exercises
The existence of planets around other stars is now commonplace -- over 5,000 exoplanets have been detected in 2023 compared to less than 50 known exoplanets in 2000. That's a 100-fold increase in just over 20 years! The solar systems that have been found look very different from our own. Some have gas giants orbiting very close to their host stars and others have planets with sizes that are not seen amongst our eight planets. Let's take a look at the diversity of planets and planetary systems that have been found and highlight a few of the most interesting, with respect to the possibility of finding life. We'll conclude by asking how we might detect the presence of life on exoplanets.
Learning Objectives
By the end of this chapter, you will be able to:
- Discuss the ranges for mass and radius that the exoplanets discovered have
- Describe the types of exoplanets being detected and how they compare to the planets in our solar system
- Explain how different detection techniques are sensitive to detecting different kinds of exoplanets.
- Discuss the TRAPPIST-1 planetary system and how it is similar to and different from our own
- Explain the concept of a biosignature and describe Earth’s biosignatures
- Discuss how biosignatures can be searched for in exoplanetary atmospheres
Exoplanet Statistics
Now that a large sample of exoplanets have been detected, we can take stock of the types of planets that have been found. Overall, the transit method and radial velocity methods have yielded the most exoplanets to date, with 75% of known exoplanets found with the transit method and 19% with the radial velocity method. The animation below summarizes the history of planetary discovery. Note the explosion of detections with the transit method in 2014 when data from the Kepler mission started coming in.
Timeline for exoplanet discoveries.
Figures 1 and 2 below summarize the detections by the plotting the planet's mass (Fig. 1) and the planet's radius (Fig. 2) against how long it takes the planet to orbit its host star (its period). Each planet has a symbol to indicate which detection method was used to discover the exoplanet. There are two methods included in Figures 1 and 2 which we did not discuss in the previous chapter, as neither are one of the primary methods used: timing variations and orbital brightness modulations. We'll explain these two methods briefly.
When and for how long a planetary transit will occur is predictable. If there is another unseen planet in the system that is gravitationally tugging on the transiting exoplanet, this can cause the transiting planet to either speed up or slow down and it will cross in front of the star sooner or later than predicted. This is the theory behind timing variations. This method has the advantage of allowing you to determine the mass of the exoplanets. A couple dozen of the more than 5,000 exoplanets detected to date were found via timing variations. In our own solar system, the planet Neptune was discovered via timing variations in 1846 -- Uranus was found to orbit slower or faster during its orbit around the Sun than predicted, and the presence of another planet was hypothesized to be the reason. Neptune was found exactly where it would be if it was the cause for the changes in Uranus' orbital motion. Science!
A massive planet orbiting very close to its host star can cause the brightness of the star to change due changes in the amount of light reflecting off the planet's surface. Of course, the planet needs to have a reflective surface for this effect to be measured, and these changes in reflected light will manifest as a change in the brightness of the star that is in lockstep with the orbital period (or phases) of the close-in planet. These types of changes are called orbital brightness modulations. Changes in brightness can also be caused by distortions to the star's shape caused by the massive, close-orbiting planet.
There a few important limitations to Figures 1 and 2 that we need to note. Figure 1 shows the mass and orbital period of the exoplanets. The mass of an exoplanet can be found with the radial velocity (RV) method and the timing variations method. The transit method allows you to determine the radius of an exoplanet but not the mass. Not all exoplanets found with the transit method have been followed up with the RV method to get the mass, so not all planets found with the transit method are included in Figure 1.
In a similar way, not all exoplanets detected with the RV method are shown in Figure 2, and this is clear to see as Figure 2 is dominated by green squares for the transit method. Of the 1000+ stars found with the RV method, only the 66 that have had their radii determined are included in Figure 2.


Concept Check: Analyzing the Mass-Period and Radius-Period Plots
There are trends in the mass-period plot in Figure 1 that are especially prevalent when looking at the distribution for each detection method.
Transit Method
What trends do you see in radius and period for the exoplanets found using the transit method?
Looking at the radius-period plot (Figure 2), the transit method overwhelmingly finds planets with periods less than a hundred days. There are very few exoplanets found with periods greater than the Earth (365 days) -- the limit is about 1,000 days which is a little less than 3 Earth years.
The transit method picks up planets with a wide range of radii, from planets smaller than the Earth all the way up to planets 30 times larger than the Earth. However, intuitively, planets with very small radii will be the most difficult to detect, as these cause the least amount of dimming in the brightness of the host star.
Summary: Most radii, short periods (a few hours up to a few years).
What types of exoplanets will the transit method preferentially detect?
The transit method is best at finding exoplanets that are fairly close to their host stars. This is not a technical fault of the method itself but rather the fact that to collect data for planets on long period orbits, you need measurements spanning decades or centuries, and we've only been observing transits for about 20 years so far.
Radial Velocity Method
What trends do you see in mass and period for the exoplanets found using the radial velocity (RV) method?
The RV method is able to find exoplanets with a wide range of orbital periods, from less than 1 day up to 105 days (275 years). The method is sensitive to a wide range of masses, from planets slightly less-massive than the Earth up to planets with 30 times the mass of Jupiter; there are more higher mass planets found than lower mass planets. As for the period range, there is a generally diagonal trend, where low-mass planets with shorter orbital periods and high-mass planets with longer orbital periods are found. There is some scatter whereby higher-mass planets with shorter orbital periods are found, but virtually no planets with lower masses and periods greater than 1 year are detected.
What types of exoplanets will the RV method preferentially detect? What are the limitations?
The RV method is best at finding massive planets with periods out to about 50 years. The method can also find lower mass planets orbiting close to their host stars but cannot detect low-mass planets orbiting further away.
Direct Imaging
What trends do you see in mass and period for the exoplanets found using the imaging method? How about trends in the radius and period?
What types of exoplanets will the direct imaging method preferentially detect?
Gravitational Microlensing
What trends do you see in mass and period for the exoplanets found using the microlensing method? Why do you think the radius cannot be determined for the microlensing method (that is, why is this method not shown in the radius-period plot)?
What types of exoplanets will gravitational microlensing preferentially detect?
In Figure 2, there is a gap for planets with radii of 4 to 10 times the radius of the Earth (4 REarth < R < 10 REarth), especially for planets that are orbiting close to their host stars. There are Jupiter-sized planets found orbiting close to their stars (hot Jupiters) as well as Earth-sized planets orbiting close -- where are the planets with radii 4-10 REarth? Is this gap due to limitations of the detection methods or is this telling us something more general about the types of planets that form around stars? Since the transit method can detect stars below and above this range of radii, this suggests the gap (sometimes called the "hot Neptune desert") is real and that it has something to do either with the formation or longevity of planets this size. One idea is that planets of this size are most susceptible to having their atmospheres completely evaporate away, making them planets that can transition in size and eventually have a smaller radius (where planets are found).
The types of planets being found are commonly divided into four main categories: gas giants, Neptune-like, super-Earths, and terrestrial. Figure 3 summarizes the fraction of each of these types that has been found. Super-Earths have radii between 1.2 and 2.8 that of Earth, and the other large group with sizes between 2.8 and 4 that of Earth are often called Neptune-like or mini-Neptunes. While the totals are split into about one-third each for gas giants, super-Earths, and Neptune-like exoplanets, we need to keep in mind that the transit method, which has found 75% of all exoplanets, is biased against very small, terrestrial-size planets. The smallest radius for an exoplanet detected with the transit method is about 30% the size of Earth's radius (R = 0.30 REarth), so we cannot immediately conclude that there are fewer terrestrial exoplanets out there compared to the other types. In our own solar system, two of the eight planets, Mercury and Mars, have radii of 0.39 REarth and 0.53 REarth.

For a clearer look into the distribution of exoplanets by their size, Figure 4 shows a histogram of the radii for known transiting exoplanets that have a measured radius. This does not eliminate the bias against terrestrial planets but some interesting trends emerge.

First, we see a preponderance of exoplanets with sizes intermediate between the Earth and Neptune -- the super-Earths and mini-Neptunes. No planets of these types exist in our solar system! What a remarkable discovery it is that the most common types of planets in the Galaxy are completely absent from our solar system and were unknown until the Kepler mission. Further, this idea that planets of roughly Earth’s size are so numerous is surely one of the most important discoveries of modern astronomy.
The TRAPPIST-1 system
One of the most intriguing planetary systems detected so far is TRAPPIST-1. The TRAPPIST-1 planetary system is about 40 light years away from Earth and has seven known exoplanets. The TRAPPIST-South survey program came online in 2010 by European astronomers using a small, ground-based telescope at La Silla Observatory in Chile to search for exoplanets with the transit method. The acronym TRAPPIST stands for “Transiting Planets and Planetesimals Small Telescope,” and is a nod to the popular Trappist beers found in Belgium.
In 2015, three planets were detected with this survey around a star that the team renamed TRAPPIST-1 (catchier than the original catalog name for this star, 2MASS J23062928-0502285). TRAPPIST-1 is a small, cool, red dwarf; the advantage of looking at small stars is that the transit signals from smaller, terrestrial planets are stronger. In 2017, four more planets were discovered around TRAPPIST-1, with the transit timing variations, bringing the total to seven planets orbiting TRAPPIST-1. All of these planets orbit at a distance that is smaller than the distance from the Sun to Mercury in our solar system and are similar in size to the rocky terrestrial worlds. Figure 5 below summarizes the properties of the seven known planets orbiting TRAPPIST-1 compared to our solar system's four terrestrial planets.

Worked Example: Finding an Exoplanet's Density
If both the mass and radius are known for an exoplanet, we can find its density. We explored this quantitatively in the chapter on the Earth but revisit it here with an emphasis on finding densities for exoplanets.
Notice that the masses and radii for the TRAPPIST-1 planets are reported relative to the Earth. For example, TRAPPIST-1 b has a radius that is 12% larger than the Earth's radius (RT1b = 1.12 REarth) and a mass almost identical to the Earth's (MT1b = 1.02 MEarth). Since these values are relative to the Earth, we can immediately estimate TRAPPIST-1 b's density:
[latex]\rho = M/V = M/\frac{4}{3} \pi R^3[/latex]
Now, by taking the ratio of the density of any exoplanet to that of the Earth's density, we can find the density of the exoplanet relative to Earth:
[latex]\rho/\rho_{E} = (M/\frac{4}{3} \pi R^3)/(M_{E}/\frac{4}{3} \pi R_{E}^3) = (M/M_{E})/(R/R_{E})^3[/latex]
Putting in the values of the mass and radius for TRAPPIST-1 b, we find:
ρT1b = (1.02 MEarth/MEarth)/(1.12 REarth/REarth)3 ρEarth = (1.02)/(1.12)3 ρEarth = 0.73 ρEarth
This agrees perfectly with the value reported in Figure 5.
Question 1
The exoplanet 51 Peg b has a radius that is 1.27 times greater than Jupiter's radius (R51P = 1.27 RJ) and a mass that is 0.46 (46%) the mass of Jupiter (M51Pb = 0.46 MJ). Find the density of 51 Peg b relative to Jupiter's density.
Show Answer
This can be solved exactly the same way as the example above (the only difference is that the mass and radius are now reported relative to Jupiter, rather than Earth).
[latex]\rho/\rho_{J} = (M/\frac{4}{3} \pi R^3)/(M_{J}/\frac{4}{3} \pi R_{J}^3) = (M/M_{J})/(R/R_{J})^3[/latex]
Putting in the values of the mass and radius for 51 Peg b, we find:
ρ51Pb = (0.46 MJup/MJup)/(1.27 RJup/RJup)3 ρJup = (0.46)/(1.27)3 ρJup = 0.22 ρJup
This tells us that 51 Peg b is a very light planet with a density that is just 22% the density of Jupiter. You can look up the density of Jupiter (ρJup = 1.3 g/cm3) and calculate the value for the density of 51 Peg b:
ρ51Pb = 0.22 ρJup = (0.22)×(1.3 g/cm3) = 0.29 g/cm3
Question 2
The exoplanet Kepler 22 b has a mass that is 9.1 times greater than Earth (MK22b = 9.1 ME) and a radius that is 0.19 (19%) the mass of Jupiter (RK22b = 0.19 RJ). Find the density of 51 Peg b relative to Earth's density.
Show Answer
For this problem, we are given the radius relative to Jupiter and the mass relative to Earth. We will need to convert the radius so that it is relative to Earth as well, so that a direct comparison can be made to the Earth's density.
Jupiter's radius is 11.2 times the radius of Earth: RJ = 11.2 RE. Using this conversion factor:
R22Kb = 0.19 RJ = 0.19×(11.2 RE) = 2.1 RE
The density relative to Earth is:
ρK22b = (9.1 MEarth/MEarth)/(2.1 REarth/REarth)3 ρEarth = (9.1)/(2.1)3 ρEarth = 0.98 ρEarth
Kepler 22 b has almost the same density as Earth so Kepler 22 b is also a rocky planet, with a density slightly less than 5.5 g/cm3.
Three of the seven planets orbiting TRAPPIST-1 are in the habitable zone -- the distance from TRAPPIST-1 where the temperature is just right for liquid water. If there are three habitable worlds around the TRAPPIST-1 star and if technological civilizations evolve on any of these planets, there will be a powerful incentive to build spaceships that travel to these neighboring worlds. All of the TRAPPIST-1 detected to date are either terrestrial or super-Earths. We know this based on both the mass and radii of the TRAPPIST-1 planets, which together allow us to find their densities. In Figure 5, we see that most of the TRAPPIST-1 planets have densities close to Earth, with TRAPPIST-1 d having a lower density at 62% the density of Earth (ρT1d = 0.62 ρEarth).

The orbits of the seven TRAPPIST-1 planets are close to resonance, meaning that the ratio of the orbital periods are close to integer values. Planet e is in a 6-day orbit and planet g is in a 12-day orbit; planet f is in a 9.2-day orbit and planet h is in an 18.7-day orbit.
TRAPPIST-1 System with JWST
Since its discovery, the TRAPPIST-1 system has been followed up with several different telescopes, including Spitzer, Kepler, Hubble and the James Webb Space Telescope. Hubble collected spectra for all seven exoplanetary transits in the TRAPPIST-1 system to study the compositions of any atmospheres that these planets may hold.
The mid-Infrared Instrument (MIRI) on JWST was used to find the temperature of TRAPPIST-1 b by measuring the brightness of TRAPPIST-1 when planet b was behind the star (this is called a secondary transit or an occultation). The temperature of TRAPPIST-1 b was found to be about 500 K and further analysis showed that it is unlikely that this exoplanet has an atmosphere (read more at https://exoplanets.nasa.gov/news/1756/webb-measures-the-temperature-of-a-trappist-1-exoplanet/). The data was fit to models for a planet with an atmosphere and without, and the observations were a better match to the model for a planet that is bare rock (with no atmosphere).
The NIRISS (Near-Infrared Imager and Slitless Spectrograph) instrument aboard JWST was also used to study TRAPPIST-1 b. The NIRISS results confirmed that there is little evidence that TRAPPIST-1 b has an atmosphere -- although it still cannot be ruled out -- but also found that contamination from the star TRAPPIST-1 can compromise the analysis of spectra[1]. M dwarfs like TRAPPIST-1 experience frequent flares of X-rays and other surface phenomenon, such as star spots and faculae, both of which are caused by magnetic fields. If a flare occurs during the measurement of the planet's spectrum, this can create "ghost lines" that could be misinterpreted as an actual chemical signature in the spectrum. This study underscores the importance of taking into account the effects of outbursts of radiation frm the host star, especially M dwarfs, which are the most plentiful type of star in our Galaxy.
Assessing Exoplanetary Habitability
With some basic properties of an exoplanet -- its mass, radius, semi-major axis and orbital period -- and its host star, a critical assessment can be made as to whether the exoplanet is habitable. In this section, we look at some of the key questions to ask in carrying out such an assessment.
Density
The density of a planet is important in understanding its composition and surface: this tells us if the world is a gas giant, a rocky planet or something in between. To find the density of an exoplanet, both its radius and mass are required. Some examples are shown above on how to carry out density calculations for exoplanets.
A good resource for finding the mass and radius of an exoplanet, reported relative to Earth or Jupiter, is NASA's Eyes on Exoplanets site: https://exoplanets.nasa.gov/eyes-on-exoplanets/
Once you know the approximate density of a planet (we say approximate here as the exact mass is usually not known, but instead the minimum mass found through the Doppler technique), you can then assess the surface properties by comparing to some benchmarks, such as the density of Earth and the density of Jupiter. Figure 7 below shows the densities for the planets in our solar system compared to those of exoplanets detected.

Surface Gravity
The surface gravity of a planet can give insight as to whether the world can hold onto an atmosphere. Without an atmosphere, life on any other world seems improbable. On Earth, the atmosphere keeps the surface temperature (relatively) stable and enables the Greenhouse effect; without our atmosphere, Earth would be a frozen ice planet.
The surface gravity of a world depends on its mass and radius as:
$$g = G\frac{M}{R^2}$$
An example of how to find the surface gravity of a world is shown here in the chapter on Laws of Motion and Gravity.
How much gravity at the surface is enough to retain an atmosphere? Atmospheric retention depends not only on the surface gravity but also the temperature. Gas molecules move faster in hot environments compared to cold ones.
Habitable Zone (liquid water?)
A key question to ask is whether or not the planet is in the habitable zone around its host star. The distance from the star to the edges of the habitable zone depend entirely on the parameters of the host star (and can be estimated using just the luminosity of the star, as shown in this example in the Habitable Zone chapter). With the inner and outer boundaries (that is, the distance from the star to the closest part of the HZ and the distance to the furthest part), the distance from the exoplanet to the star (its semi-major axis, a) can be compared to see if it falls within these boundaries. An example is shown in the box below.
Worked Example: Is a planet in the HZ around its star?
Using the luminosity of its host star, estimate whether the rocky exoplanet Kepler 452 b is in the habitable one around its host star.
First, a quick search* reveals that the luminosity of Kepler 452 (the star around which Kepler 452 b orbits) is about 1.2 times the luminosity of the Sun: LK452b = 1.2 LSun
Now, we can use the relationships for the inner/outer bounds of the conservative HZ:
[latex]d_{inner,star} = 0.95 \sqrt{L_{star}/L_{Sun}}[/latex] AU
[latex]d_{outer,star}= 1.37 \sqrt{L_{star}/L_{Sun}}[/latex] AU
$d_{inner} = 0.95 \sqrt{1.2}$ AU = 1.04 AU
$d_{outer} = 1.37 \sqrt{1.2}$ AU = 1.50 AU
Next, let's compare these bounds with the average distance of Kepler 452 b from Kepler 452:
$a$ = 1.05 AU
Kepler 452 d is very close to the inner edge of the HZ around Kepler 452. Yes -- it is in the habitable zone.
Note that Kepler 452 has nearly the same luminosity as the Sun and the planet Kepler 452 is orbiting at about the same distance from Kepler 452 as the Earth does from the Sun. This is an intriguing example of an Earth-sized planet orbiting a Sun-like star...could Kepler 452 b have water on its surface?
*For a more precise estimate of the luminosity, look up the star on NASA's exoplanet archive. You can also estimate a star's luminosity relative to our Sun by using the Stefan-Boltzmann law, if you know its radius and temperature.
For a graphic image, you can use the HZ generator tool at http://astro.twam.info/hz/
Try it! Generate the HZ around TRAPPIST-1.
To start, open the HZ sim link and click on the "Multiple" tab. Remove Star B (by clicking on the red X next to it). Now you can input the values for TRAPPIST-1 -- note the units! You will need to adjust both the Plot Radius and the Resolution for the figure.

Go Deeper
Look back at the distances for each of the seven detected in exoplanets in the TRAPPIST-1 system. Which of these planets fall into the HZ around TRAPPIST-1, as shown in the figure above?
[Ans: c, d, e]
Tidal Locking
A world is tidally locked if the same side of it always faces the object that it orbits. The Moon, for example, is tidally locked to the Earth and we always see the same side of the Moon from Earth. It takes the Moon the same amount of time to make one rotation on its axis as it does to make one orbit around the Earth. Pluto and its moon Charon are also tidally locked.
Planets can be tidally locked to their host stars as well. This is a gravitational effect and depends on the mass of the star and the planet's distance to the star. Over time, the rotation (spin) of the planet is gravitationally synchronized with the orbit. Figure 8 below summarizes where the "tidal lock radius" line (to the left of this line a planet is tidally locked) for stars by their spectral type and the distance that a planet is from the star. Our solar system is shown for comparison. Mercury is shown to the left of the tidal lock radius line, and Mercury is in a 3:2 orbital resonance with the Sun (because it also experiences gravitational pulls from Venus, Mercury is not in a 1:1 orbital resonance, which is the case for tidal locking).

Concept Check: Tidally locked?
Using Figure 8, determine if the exoplanet Proxima b tidally locked around its host star Proxima Centauri.
To answer this using Figure 8, we need the mass of Proxima Centauri and the distance that Proxima b is from this star; these are (source):
MassProxCen = 0.12 MSun
aProxb = 0.0486 AU
Finding the intersection of these points on Figure 8, the exoplanet is close enough to be tidally locked. This figure also shows that Proxima b falls into the habitable zone around its star. The marked figure is shown below for clarity.
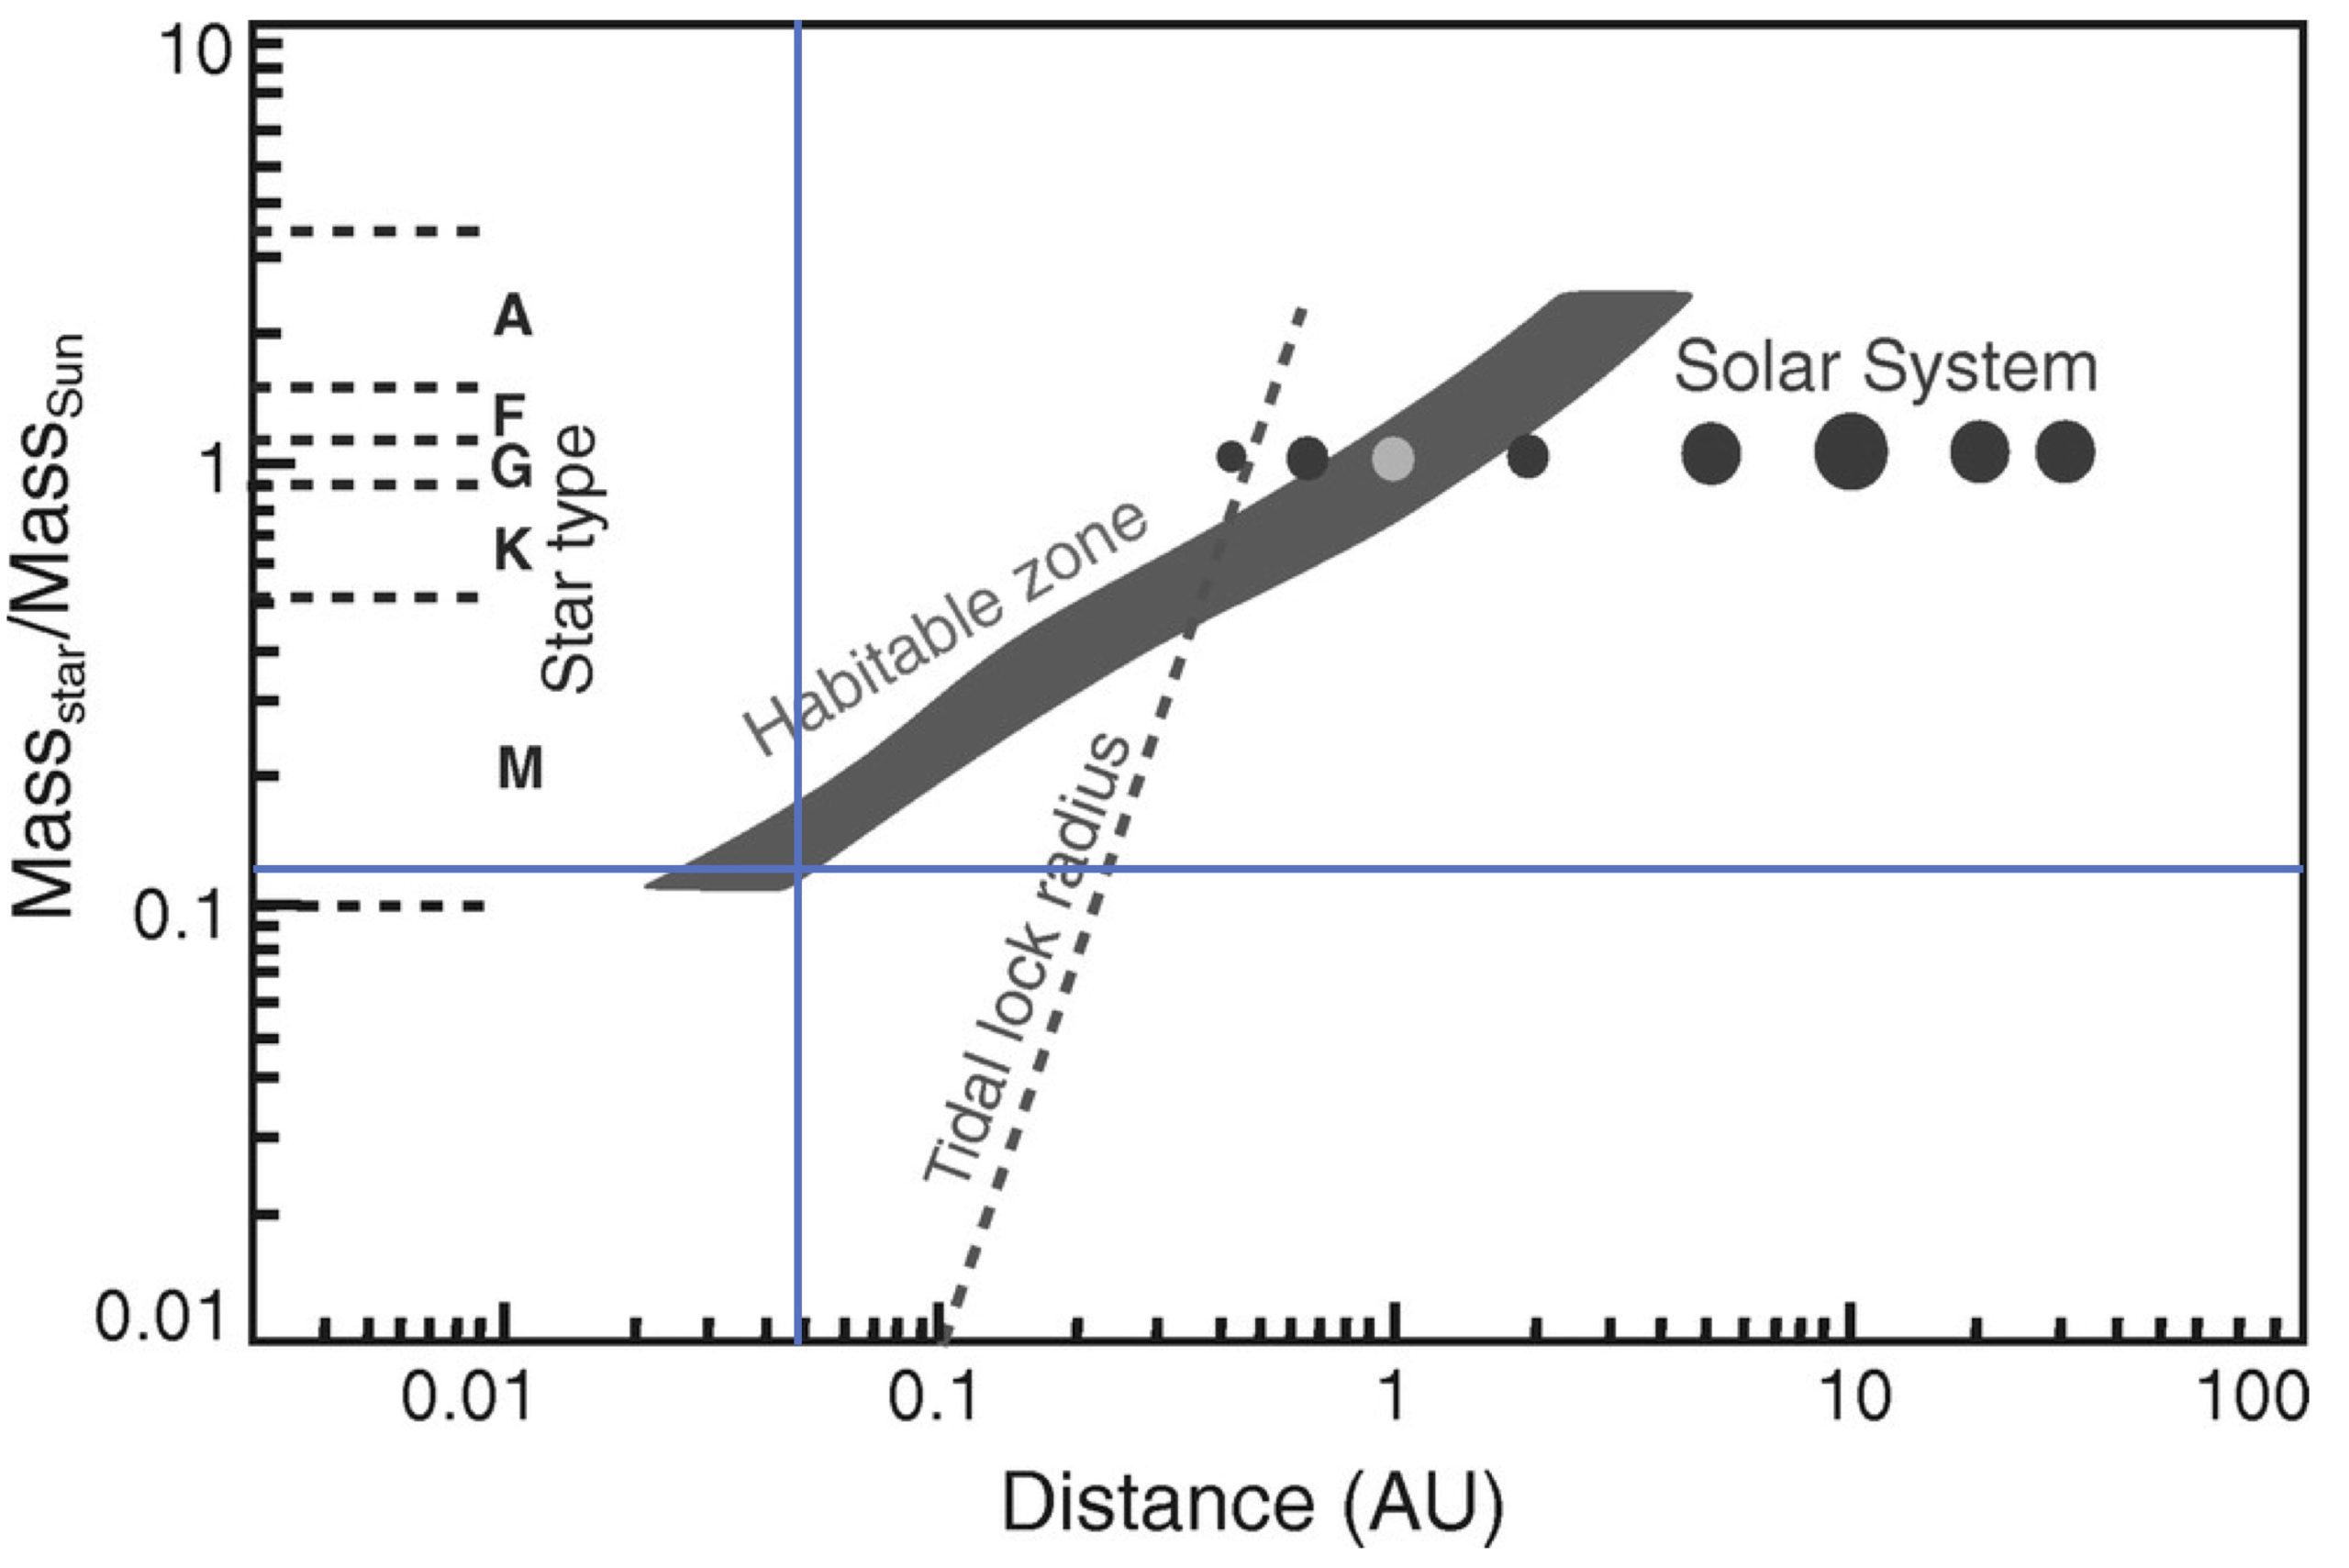
Biosignatures
How might we be able to tell if there is actually life on an exoplanet? Scientists instead search for signs of life by looking for telltale signatures.
It is apt to begin a discussion of biosignatures with the adage "Extraordinary claims require extraordinary evidence." As we look at some possible signatures of life, we cannot immediately conclude that the detection of just one biosignature means we have found other life in the universe. For any potential biosignature detected, absolutely all abiotic sources must be ruled out. False positives can be difficult to identify but an exceedingly critical analysis is in order.
A good place to start in pondering atmospheric biosignatures on other planets is to see what Earth's atmosphere looks like -- and what another civilization would see if they took a spectrum of the Earth. Figure 1 shows the spectrum of Earth's atmosphere at optical and near-IR wavelengths. The first thing that you may notice is water...and recall "Follow the water!". This is a sign of liquid water oceans on Earth, so we are indeed excited when H2O is detected in an exoplanetary atmosphere, but water vapor can also be produced naturally (recall that Jupiter and Saturn have water vapor in their atmospheres).

Carbon dioxide is also a byproduct of life on Earth -- all animals exhale CO2 and CO2 is released when plants decay. But CO2 can also be produced naturally though volcanic eruptions, and through anthropogenic (man-made) sources such as the burning of fossil fuels or defo restation. To further exemplify this point, Figure 2 shows the atmospheric profiles for Venus, Earth and Mars.
.")
Mars, Earth and Venus all have CO2 in their atmospheres but only Earth shows water and ozone (which is related to O2). Let's take a deeper look at some potential biosignatures and their abiotic sources. As we'll see, oxygen alone or methane alone would not be a good biosignature, but the combination of oxygen and methane is a smoking gun for life. At the temperatures and pressures in the atmosphere of Earth, oxygen would react quickly with methane, producing carbon dioxide and water. The simultaneous existence of these elements on Earth occurs only because life is producing these elements and maintaining chemical disequilibrium.
Oxygen
Life on Earth keeps O2 in our atmosphere -- it is a byproduct of life on Earth. Ozone -- O3 -- is formed when an O2 molecule is broken apart and one of the single oxygen atoms combines with another O2 molecule. So, the presence of ozone is a proxy for O2. Of course, just O3 is not enough and a more compelling case would be made if both O3 and another biosignature were detected. For example, ozone and water in our atmosphere point to habitable conditions on the surface.
False negatives need to also be considered in addition to false positives. Just because an atmosphere does not show O2, this does not necessarily mean that there is no life. On Earth, cyanobacteria began putting O2 into our atmosphere perhaps as early as 3.8 billion years ago (stromatolites) but it would not have showed up in a spectrum because it would immediately react with other elements. On a similar note, if there was a very low level of O2, our instruments may not be sensitive enough to detect it. Finding unambiguous signs of life is a tricky game to play.
Methane
Methane (CH4) is another molecule that can be produced both biotic and abiotic sources. Methane is a natural byproduct of volcanic outgassing and, in our own solar system, the lifeless worlds Uranus and Neptune have methane in their lifeless atmospheres. Methane can also be produced geologically in hydrothermal vent communities through a process called serpentinization. Methane is created by life as a waste product. Some animal life, such as cows and sheep, produce methane through microbes in their stomaches. These ancient archaean microbes, called methanogens, take in H2 and CO2 and expel CH4 as waste. Like O2, CH4 will generally not stay in an atmosphere unless it is continuously replenished causing chemical disequilibrium. This is why the topic of methane in Mars' atmosphere often pops up in the news, as it could be interpreted as a sign of life (but, if the detection is real, is very likely due to permafrost evaporating at the Martian poles).
Methane on its own would not be a strong biosignature but if it was detected with O2 then a very strong case could be made for life, as this combination would be hard to create without photosynthesis.
Sulfur gases
Gaseous molecules containing sulfur are produced by both abiotic and biotic sources on the Earth. Simple sulfur gases such as SO2 and H2S are produced by metabolism but also are produced naturally though volcanic outgassing. A less ambiguous biotic signature is from more complex sulfur cases such as dimethyl sulfide (DMS) and dimethyl disulfide (DMDS). DMS on Earth is created mainly by marine phytoplankton and is also found in microbial mats.
The atmosphere of the exoplanet K2-18 b -- a Super-Earth orbiting in the habitable zone around its host star -- was recently studied by JSWT. When K2-18 b passed in front of its host star, K2-18, the infrared spectrograph on JWST collected the light from the planet and the star, and was able to separate out the atmosphere of just K2-18b, shown in Figure 3. DMS was detected but further studies will be needed to corroborate this detection.

Nitrous Oxide
Nitrous oxide (N2O) is detected in excess (chemical disequilibrium) in the Earth's atmosphere. It can be created from both abiotic and biotic sources. One biotic source is actually more of a technosignature -- the amount of N2O in our atmosphere has risen exponentially since the Industrial Revolution in 1750. It is a byproduct of agriculture and fossil fuel burning. It is also produced by bacteria that use nitrates in the soil and water to create N2O. Nitrous oxide can also be formed naturally by lightning, but the bulk of N2O in Earth's atmosphere is due to life.
If the detection of N2O is to be considered a biosignature, it must be considered along with other factors about the exoplanet and other gases that are found in its atmosphere.
Vegetation Red Edge
In addition to biosignatures gases in the atmosphere, a planet's surface can also reveal the presence of life. On Earth, the red edge is a property of chlorophyll in photosynthetic plants, which becomes abruptly reflective at infrared wavelengths as shown in Figure 4. At wavelengths above about 0.7 μm (700 nm, which is right at the edge between red visible light and infrared light), leaves will reflect sunlight and show a sharp increase in the amount of light reflected at this point.
The specific wavelength for the red edge on Earth is a consequence of the properties of the Sun and the intensity of its light at different wavelengths (the most intense light from the Sun being yellow-green). For an exoplanet orbiting an M star, the most intense radiation is in the infrared part of the electromagnetic spectrum, so the red edge could actually be some different color or perhaps a black edge, depending how vegetation responds to the different intensity of light. H.G. Wells considered this and wrote in The War of the Worlds in 1895: "The vegetable kingdom in Mars, instead of having green for a dominant colour, is of a vivid blood-red tint."

This reflectance property of chlorophyll also keeps plants from overheating, but is also integral to plants growing efficiently through a process called shade avoidance. Plants are capable of detecting a lack of infrared light and this triggers a response in plants that produces longer stems and larger leaves, which allows a plant to capture more sunlight.
Photosynthetic organisms were a critical step in the evolution of aerobic respiration in eukaryotes. Therefore, a similar detection in the atmospheres of other planets would be an intriguing clue for bio-activity. The red edge is a strong signal in the atmospheric spectra from Earth and an easy feature to search for in the atmospheres of other planets.
The image to the left shows an example of an exoplanet, Kepler-186f, that is Earth-sized and falls into the habitable zone around its host star. Kepler-186 is a cool, red dwarf star so any plants that grow there could adapt to their star's light in such a way that leaves have different colors that differ from those on Earth.
Key Concepts and Summary
Each of the observational detection methods for exoplanets is sensitive to a different range of masses and orbital separations between the host star and planet. In general, larger or more massive exoplanets around the nearest stars present the largest -- and therefore most easily detectable -- signals. Over the past decades, significant effort has gone into reducing instrumental errors and improving observing strategies with the goal of pressing measurement precision down to Earth-detecting sensitivities. The ensemble of exoplanets and exoplanet architectures reveal some differences from the solar system, however, there are still biases that prevent us from obtaining a full view of planetary systems around other stars. In the TRAPPIST-1 system, seven orbiting planets have been detected. These TRAPPIST-1 planets orbit close to the low mass host star and appear to be terrestrial, or rocky worlds. Recognizing that simple organisms were altering the atmosphere of Earth for billions of years before our radio telescopes appeared, astronomers can cast a wider net in the search for life by looking for the impact that life might have on the spectra of atmospheres of other planets - so called biosignatures. For example, the combination of strong oxygen markers together with methane is a signature of chemical disequilibrium on Earth that requires ongoing biological respiration.
Review Questions
Summary Questions
- What is a biosignature? Give some examples of Earth's biosignatures.
- How do SETI scientists search for biosignatures in planetary atmospheres?
Exercises
- Assessing the habitability of an exoplanet. Choose an exoplanet that you are interested in learning more about, especially the possibility of it hosting life. Begin by hypothesizing whether or not you think the exoplanet is habitable. Go through the four factors (density, surface gravity, habitable zone estimation, and tidal locking) in the Assessing Exoplanetary Habitability section above and discuss whether the evidence you found supports the hypothesis.
The Earth is filled with a rich diversity of life. What makes the Earth such a habitable oasis for life? The planets Venus, Earth, and Mars all started out with atmospheres, and yet they evolved into vastly different worlds today. Certain features unique to the Earth, such as plate tectonics, have enabled it to be a dynamic world with oceans and a climate hospitable for life. By identifying the characteristics that make Earth hospitable, we can gain insight into what properties to look for on exoplanets that may point to the possibility of life.
Learning Objectives
By the end of this chapter, you will be able to:
- Discuss the Earth’s density and surface gravity and how it compares to the other planets in our solar system
- Explain the differentiation of Earth and its main interior layers
- Discuss how heat is generated inside a planet and how it is lost to cooling.
- Discuss the importance of plate tectonics for Earth’s habitability
- Explain how Earth’s magnetosphere protects life on Earth
The size of a world and distance it orbits its host star can take us very far in assessing whether the world could host life. We say more in the chapter on Habitable Zones about how the distance of the Earth from the Sun keeps the Earth at the right temperature for liquid water -- and makes Venus too hot today for liquid water -- and we will focus here on the bulk properties of the Earth.
Bulk Properties of the Earth
The most basic measurements of the Earth are its size, mass, and density. Many features of the Earth have been understood since antiquity. Aristotle argued that the Earth had to be round because the Earth cast a circular shadow over the moon during a lunar eclipse. Eratosthenes of Cyrene obtained a clever measurement of the radius of the Earth that was within 20% of the value that we can measure today. To a good approximation, the Earth is spherical in shape and the volume of the spherical Earth is given by $\frac{4}{3} \pi R^3$, where $R$ is the radius of the Earth.
Armed with knowledge about the volume of Earth, we can use the density of rocks to estimate the mass of Earth. Density is simply the ratio of mass to volume, $\rho = M/V$, and it tells us how tightly material is packed into an object of a given size. A rock that is about a cubic centimeter in size weighs about 3 grams, so the density of that rock is $\rho$ = 3 g/cm3. We can then turn the density equation around to estimate the mass of the Earth: M = $\rho$V. This estimate is off by a factor of about two since the interior of the Earth is compressed and has a higher density than surface rocks. However, this "order of magnitude" estimate is an excellent approximation - a factor of two is a great start when nothing is known before.
In the early 18th century (and with the benefit of insights from Isaac Newton about the laws of gravity) Henry Cavendish “weighed the Earth” in his lab by cleverly measuring the acceleration of gravity on Earth. Gravity is a property of mass and Cavendish calculated a bulk density for the Earth of 5.48 g/cm3, very close to the currently known value of 5.515 g/cm3.
The density of a planet can easily be calculated if the radius and mass are known, quantities that can be measured even for planets orbiting other stars. The density of a planet gives immense insight into that world. All terrestrial planets in our solar system have higher densities than the jovian gas giants. The average density of the terrestrial planets is 5.0 g/cm3, while the average density for the jovian gas giants is 1.2 g/cm3. Exoplanets with densities that fall in between these values are commonly found and point toward intermediate types of planets that are not found in our solar system. For example, the "mini-Neptune" K2-18 b has an estimated density of 2.6 g/cm3.
Worked Example: Calculating the density of a planet
Looking up the mass and radius of the Earth, and using the density equation we find:
$\rho = M/V = M/\frac{4}{3} \pi R^3$ = (5.97×1024 kg)/($\frac{4}{3} \pi$ (6.38×10⁶ m)3) = 5500 kg/m3
This tells us that an average cubic meter of the Earth contains 5500 kg, or 5.5 metric tons of matter. A cubic meter is about the size of a washing machine. If 5.5 tons seems heavier than you would have guessed, it is because the core density of Earth is greater than the dirt and rocks on the surface of our planet.
It can be more convenient to express densities in units of g/cm3 (grams per cubic centimeter). In these units the density of water is 1 g/cm3 and makes an easy reference point to remember. In these units, $\rho_{Earth}$ = 5.5 g/cm3
Extra: Saturn has the lowest density in our solar system, with a value of $\rho_Saturn$ = 0.7 g/cm3. How many times denser is the Earth than Saturn?
Show Answer
7.9 -- the Earth is almost 8 times more dense than Saturn
Another property that also depends on the mass and radius of a planet is surface gravity. The equation for finding the surface gravity (g) of a world is: $g=G M/R^2$. Here, $G$ is the gravitational constant and we can easily make comparisons of the surface gravities of different worlds by taking their ratio relative to Earth. Table 1 lists the densities for the planets in our solar system and their surface gravities relative to the surface gravity of Earth. The surface gravity helps to assess if rocky planets can hold onto their atmosphere.
| Mercury | Venus | Earth | Mars | Jupiter | Saturn | Uranus | Neptune | |
| ρ (g/cm3) | 5.4 | 5.2 | 5.5 | 3.9 | 1.3 | 0.7 | 1.3 | 1.6 |
| g (relative to Earth) | 0.38 | 0.91 | 1 | 0.38 | 2.4 | 0.92 | 0.89 | 1.1 |
The size of a world is also directly related to how fast it cools down. All planets start off in a molten state and over time the energy is radiated away into space. The cooling time of an object depends on the ratio of the surface area to the volume ($\frac{SA}{V}$) of a planet. Since the surface area of a sphere is $SA = 4\pi R^2$ and the volume of a sphere is $V = \frac{4}{3} \pi R^3$, this means that the cooling time is proportional to $\frac{1}{R}$. This means that there is an inverse relationship between the cooling time for a world and its radius, and a smaller world cools off faster than a world with a larger radius. How quickly a world loses its heat (putting aside for a moment the question of what creates the heat inside of a world) can be understood with a simple example from everyday life. Consider a large, hot baked potato and a small piece cut off the larger potato: which cools first? Intuition tells us it is the smaller piece, and this intuition is correct. In our solar system, the worlds with the smallest size indeed have cooled the fastest: the asteroid Ceres, the Moon, and Mercury have all entirely lost their internal heat and are geologically dead.
The fact that smaller worlds lose their internal heat (or cool off) more quickly than larger worlds is a fundamental reason why the Earth is hospitable to life. The Earth still has heat inside that can power geological activities such as plate tectonics that stabilize our atmosphere.
Earth's Interior
How do we know about the interior structure of Earth, since we live on the surface? We can only drill a few kilometers before the temperature and pressure become too high to continue. The deepest manmade hole on Earth is the aptly named the Kola Superdeep Borehole, which reaches down to 12.3 km (7.6 miles).
Almost everything else we know about the interior of the Earth comes from seismic waves. Seismic waves carry the energy from events like earthquakes or volcanic eruptions. Seismic waves compress the elastic interior of the Earth like sound waves compress the air. The speed of seismic waves depends on the depth and density of medium. The fastest moving P-waves compress material in the direction that they travel. They are the first to arrive at seismic stations and travel through the core of the Earth. Sheering S-waves are slower and do not propagate through liquid material; they are blocked by the liquid core of the Earth. Slower still, R-waves ripple along the surface of the Earth. They arrive last at the seismic stations but have the potential to do the most damage.
Seismic waves reveal the bulk density structure of the Earth, as depicted in Figure 2 below. The core is about half the radius of the Earth and is comprised of an inner core that is about the size of the moon, surrounded by a molten iron core. The liquid core is also an important factor in the Earth's habitability, as it enables the Earth to have a protective magnetosphere surrounding it. The thick rocky mantle wraps around the core and extends for the other half of the Earth radius. The outer shell is a thin crust of low density rock called the lithosphere.

All terrestrial planets in our solar system appear to have a similar layered structure inside, with a dense metal core at the center surrounded by the mantle and crust. This layered structure occurs because the planet cools over time and as it cools, the process of differentiation occurs, where the densest materials (like iron) sink to the center and the lightest materials float to the surface. A simple real world example shows this to be an intuitive process. If you shake oil and water together in a container, they will initially be in a mixture. However, over time, the denser water sinks to the bottom of the container and the lighter oil rises to the top.
One feature that distinguishes Earth from the other terrestrial planets is its crust. The Earth's crust comprises two types: continental crust and oceanic crust. These are the tectonics plates that literally float and move around on top of the mantle, specifically on top of the asthenosphere. Earth is the only terrestrial planet that has oceanic crust so this gives us a clue that plate tectonics may be an important consideration when assessing the habitability of an exoplanet.
Sources of Planetary Heat
The Earth is a geologically active planet. Plate tectonics has already been mentioned as one of the unique properties that the Earth has compared to the other terrestrial planets in our solar system and a source of heat is required to drive this geological activity. There are a few possible origins for heat inside of a planet: accretion energy, differentiation and radioactive decay.
Planets form by accreting planetesimals that collide and stick together to form larger bodies. These collisions generate significant amounts of heat or accretion energy as the planet is assembled. However, all of the heat from accretion energy is injected during the early stages of planet formation.
As material sinks during differentiation, energy is conserved as gravitational potential energy is converted first to energy of motion (kinetic energy) and then to heat (thermal energy).
Over time, as differentiation is complete and accretion is much less frequent, radioactivity becomes and remains the main source of interior heat for a planet (we note here that the large jovian planets still have heat from their formation in their voluminous interiors). Radioactivity is a natural process in which heavy nuclei spontaneously break apart; when the nuclei break apart into smaller ones, energy is emitted. All planets in our solar system contained the same chemical mixture from the solar nebula at early times, and these include some heavy radioactive elements such as uranium (238U) and potassium (40K).
Radioactivity continues to supply internal heat to the Earth to fuel geological activity, yet Mercury and the Moon are geologically dead. The difference here goes back to the cooling rate of a planet. Smaller planets lose their heat faster than larger ones. Therefore, the size of a world is an important indicator of the potential for geological activity. Before describing types of geological activity, let’s consider exactly how heat escapes from inside of a planet.
Heat Loss From a Planet
The interior heat of a world can be lost via several mechanisms: convection, conduction, and radiation. When heat from the core moves to the lower mantle boundary, convection cells are set up inside of the mantle. Convection is the familiar process wherein hot material, such as air, rises as cooler material sinks. Convection, in which energy is transported from a warm region, such as the interior of Earth, to a cooler region, such as the upper mantle, is a process we encounter often in astronomy—in stars as well as planets. You can see convection in action when boiling a pot of water on a stove. As the water heats up from below and starts to boil, convection cells are set up in the water, as seen in Figure 3. Once the heat reaches the top of the mantle, it then moves through the crust via conduction. Finally, the heat makes it to the Earth’s surface and is radiated away into space (or, to be specific, in the case of planets with atmospheres, like the Earth and Venus, the heat must travel through this layer first).
Now that the mechanisms for generating heat inside a planet, as well as how that heat gets out of a planet, are understood, we can move on to discuss the different types of geological activity that can be driven by this internal heat.
Plate Tectonics
The size of the Earth, specifically its radius, is fundamentally the reason why the Earth is still geologically active: there is enough internal heat inside our relatively large planet to drive geological activity. A smaller terrestrial planet, such as Mercury, is too small to retain enough heat to sustain any geological activity: Mercury cooled off fast and is now geologically inactive.
An important property of Earth is that it has plate tectonics. Plate tectonics explains how slow motions within the mantle of Earth move large segments of the crust, resulting in a gradual “drifting” of the continents as well as the formation of mountains and other large-scale geological features. The power to move the plates is provided by slow convection of the mantle, a process by which heat escapes from the interior through the upward flow of warmer material and the slow sinking of cooler material.
While Venus and Mars are likely to also have convection in their mantles, Earth is the only planet in our solar system known to have plate tectonics. Geological evidence suggests that plate tectonics began operating on the Earth about 3.8 billion years ago. The upper rocky layer of the Earth is divided into about twelve major tectonic plates that float on top of the convecting mantle, shown in Figure 4. The distribution of these plates affect global climate because continental crust has a higher albedo (reflects more light) than ocean water. Continental crust was thought to have a maximum extent between 1.6 - 2.7 billion years ago, causing ice ages and high rates for burial of organic material in the early and late Proterozoic eon.

Plate tectonics provide a mechanism for circulating material between the surface of the planet and Earth's interior. Plates pull apart from each other along rift zones, such as the Mid-Atlantic ridge, driven by upwelling currents in the mantle. Subduction zones form at boundaries where one edge of an approaching plate moves under another. These recycling zones are critical for life on our planet. They are part of a negative feedback loop that stabilizes our climate thanks to chemical interactions between surface rocks and the atmosphere. Rain removes carbon dioxide from the atmosphere and stores it as calcium carbonate in surface rocks through a weathering process. Carbon-enriched rocks are then transported into the deep mantle along the subduction zones, removing excess CO2 from the atmosphere. The flow of material goes the other way as well; some elements are transported from the mantle to the surface of the planet.
")
Volcanoes are also formed through plate tectonics. When volcanoes erupt, gasses trapped inside of the Earth are released. This process of volcanic outgassing supplies the raw materials for the Earth’s atmosphere (Figure 6). The primary materials that are outgassed include water vapor, CO2, N2, and SO2. Some of these gasses are greenhouse gases and contribute to maintaining the energy balance of the Earth. Plate tectonics on Earth allows carbon to be cycled from the atmosphere, down to carbonate rocks on the ocean floor, and back into the atmosphere through volcanism. This carbon cycle is an essential part of maintaining a hospitable atmosphere on Earth. Other planets in our solar system experience tectonic stresses, but plate tectonics – with the active movement of crustal and oceanic plates – is unique to Earth. When exploring exoplanets that may be conducive to life, the presence of plate tectonics would be a favorable condition, at least based on our experience on Earth.
Earth's Magnetosphere
The core of the Earth has a temperature similar to the surface of the Sun. This heat ionizes the molten iron, producing charged particles. As the liquid metal inside Earth circulates, the charged particles set up an electric current. When many charged particles are moving together like that—in the laboratory or on the scale of an entire planet—they produce a magnetic field. Earth’s magnetic field extends thousands of miles above the surface of the planet.
Our planet behaves in some ways as if a giant bar magnet were inside it, aligned approximately with the rotational poles of Earth. When charged particles from the surface of the Sun (the "solar wind") are directed toward us, the Earth's magnetic field deflects them and shields the planet. This region, called the magnetosphere, is defined as the zone within which Earth’s magnetic field dominates over the weak interplanetary magnetic field that extends outward from the Sun (Figure 7). The magnetosphere plays an important role for habitability, by preventing stripping of our atmosphere.

For a planet to have a magnetic field, it must have a liquid metallic layer and it must also be spinning fast enough to create a turbulent flow. Jupiter meets both of those conditions -- it has a liquid conducting layer made of liquid metallic hydrogen in its outer core and it rotates once every 11 hours -- and has the strongest magnetic fields in our solar system. Although Venus has a liquid metallic outer core like the Earth, it rotates too slowly on its axis (once ever 243 days) to generate a magnetic field. When assessing the habitability of an exoplanet, we want to determine whether it has the conditions to set up a protective magnetosphere.
There is evidence in Earth's geologic record from magnetic minerals that many magnetic pole reversals have occurred in the past and some scientists believe that the magnetic fields are beginning to collapse and flip again. Life has existed on our planet for billions of years, and no correlation has been found between mass extinctions and magnetic pole reversals. The risk to life during a magnetic pole reversal may be modest, but the risk to power grids that modern humans depend upon will be more substantial.
Earth's Habitability
We have looked at some of the properties of Earth that contribute to making it a habitable world. We began this chapter by stating that the Earth's size and distance together can explain some of the unique properties that make Earth habitable. The Earth has a large enough size to have heat inside of it, initially from accretion and differentiation, but mainly from radioactivity today. As this heat escapes from the Earth, it is carried from the lower to the upper mantle through convection. This heat at the upper mantle powers plate tectonics, which is responsible for maintaining a continuous cycle between the Earth's atmosphere and the crust, thus setting up a stable climate. One of the Earth's differentiated layers is the liquid outer core, and this layer combined with Earth's rotation rate sets up a protective magnetosphere around our planet.
Key Concepts and Summary
The Earth formed through the collision of planetesimals in our solar system when the Sun was forming more than 4.5 Gya. The planetesimal collisions deposited frictional accretion energy in the interior of our planet and heavier elements in the molten young Earth began to settle toward the core, differentiating into layers. The frictional processes of differentiation delivered an additional boost of energy to the interior. Today, Earth has a solid iron core surrounded by a molten liquid outer metal core. Turbulence in the outer core is coupled with rotation of the planet to generate a global magnetic field that shields the atmosphere from being eroded by the fast-moving particles in the solar wind. The energy of accretion and differentiation were one-time processes that deposited internal heat to the planet long ago. Now, an additional source of energy comes from the radioactive decay of heavy elements. The internal heat beneath the lithosphere drives motion of the floating continental plates. Planets lose internal heat over time (with smaller planets cooling faster).
Review Questions
Summary Questions
- What two properties of a world determine its density?
- How does the density of the Earth compare with the other planets in our solar system?
- How does surface gravity differ from density?
- Can a planet with a low surface gravity hold on to an atmosphere?
- Where did heat inside the Earth come from initially? What is the main source of heat from inside the Earth today?
- How can heat escape from inside a planet to the surface?
- What property of a planet determines how quickly it will lose its interior heat?
- Which planet cools faster: Earth or Mars? Explain.
- How does plate tectonics contribute to Earth's habitability?
- Can a planet without plate tectonics be habitable?
- How does Earth's magnetosphere protect life?
Exercises
Perhaps nothing captures the imagination more fully than envisioning life on another planet. What was still in the realm of science fiction just a few decades ago, especially through television shows like Star Trek, is now commonplace: as of 2024, more than 5,000 exoplanets -- planets orbiting a star other than our Sun -- have been discovered. Their detection and study has brought the search for life in the universe to a new level. Exoplanets can be categorized as rocky or gaseous, and their atmospheres can be searched for biosignatures. Unlocking more clues from exoplanets will narrow down the possibilities for habitable worlds in our galaxy.
Learning Objectives
By the end of this chapter, you will be able to:
- Explain the center-of-mass of a solar system and star “wobbling” that enables detection
- Describe how spectra can be used to detect exoplanets (the Doppler Technique) and how the minimum mass of an exoplanet can be found
- Summarize the types of planets (sizes, masses, orbital periods) that can be detected with imaging and radial velocity ("Doppler") data.
- Describe the transit method for detecting exoplanets and how the radius of an exoplanets can be found
Early History
There are several techniques for discovering exoplanets. In this chapter we will focus only on the two most common methods. The first exoplanets were detected by the gravitational effect that they exerted on their host stars, but the majority of exoplanets known today were detected by monitoring the decrease in light as they pass in front of their stars. Each method is sensitive to specific types of exoplanets, and when we piece the information together, we can begin to understand the diversity of exoplanets. Humans have long wondered whether other solar systems with planets like our own Earth might exist among the billions of stars in our galaxy, and this moment will go down as the time when we figured this out.
The first failures and successes
The discovery of worlds around other stars has a long history with many false starts. In the 1960s, Peter van de Kamp interpreted a small wobble in the position of Barnard's star as an exoplanet. Observations by other astronomers contradicted that result, although van de Kamp never admitted that his claim was in error. In 1991, Lyne and Bailes reported in the prestigious Nature journal the discovery of a planet orbiting the pulsar star PSR 1829-10. They had measured frequency of pulse arrival times and used the Doppler effect to infer the presence of a planet, but later realized that they had not properly accounted for the velocity of the Earth around the Sun. When Lyne retracted the result at a meeting of the American Astronomical Society in January 1992, he received a standing ovation for his scientific integrity and courage.
There were also a few signals that were initially published with alternative interpretations that later turned out to be exoplanets. In 1988, Campbell, Walker and Yang observed a periodic radial velocity signal in the red giant star, Gamma Cephei. They tentatively interpreted this as photospheric variability in the star, but additional data by Hatzes and colleagues in 2002 confirmed that this was indeed an orbiting exoplanet. Another example occurred in 1989 when Latham and colleagues published the discovery of a companion to the star HD 114762; the team cautiously interpreted this as a possible brown dwarf. However, by 2012, this object was reclassified as a massive exoplanet.

The first confirmed exoplanets were very peculiar. Aleksander Wolszczan and Dale Frail measured periodic variations in the frequency of pulse arrival times to detect two small planets orbiting the pulsar neutron star, PSR 1257+12 in 1992. In 1994, they found one more planet in this system. These discoveries were puzzling because this planetary system should not have survived the supernova explosion of the host star before it evolved to become a spinning neutron star. The planets likely formed in a debris disk around the pulsar. In retrospect, perhaps that discovery should have told us that planet formation was a ubiquitous process. If planets can form around an exploding supernova, then we should have expected that exoplanets were common.
In 1952, astronomer Otto Struve made the remarkable assertion that if a Jupiter-like planet resided very close to its host star, that the gravitational tug of the planet on the star would produce radial velocity variations that might be detected in the stellar spectra with high enough precision measurements.
Twentieth-century astronomers worked to improve the precision of their techniques, and in 1995, the first exoplanet was finally discovered around a sun-like star. Most astronomers consider the dawn of exoplanets to be November 1995 when Michel Mayor and Didier Queloz discovered a gas giant planet orbiting the sun-like star 51 Pegasi at the Observatoire de Haute-Provence using the Doppler technique. The interpretation of this radial velocity signal as an exoplanet remained controversial for a few years but is no longer questioned. 51 Peg b was the first confirmed detection of an exoplanet around a main sequence star, and the 2019 Nobel Prize was awarded to Mayor and Queloz.
Direct Imaging
Just take a picture!
Seeing is believing, so it would be ideal if we could simply point a telescope at a star and take a picture of the orbiting planets. This method is called direct imaging, and the biggest challenge is separating the reflected light of the planet from the light of the star. The problem is that the planet is typically a billion times fainter and lost in the glare of the star. While techniques do exist to block out the light from the star, there are few direct images of exoplanets. Instead, we infer the presence of exoplanets by how they affect the star they are orbiting, either the star's motion or its brightness. These methods rely upon indirect detection.
The Doppler Technique
The Doppler technique (also called the radial velocity technique) was the first method to successfully detect exoplanets orbiting Sun-like stars. This technique measures the velocity of stars over time. All stars are traveling in orbits around the center of our Milky Way galaxy. For example, the Sun takes about 220 Myr to complete one loop around the galaxy. As the Sun travels around the galaxy, some stars appear to be moving toward us while others are moving away.
After subtracting the constant galactic velocity for a given star, a small remaining periodic motion in the velocity of a star (a "residual" velocity) can reveal that the star is being tugged around a common center-of-mass by another body, as shown in Figure 5 below. These residual velocities can be modeled to determine whether the orbiting object is a planet. With the Doppler technique, the planet is never observed (making this an "indirect" detection method). Instead, the time-varying velocity of the host star is modeled to infer the presence of an unseen planet. All stars have some nearly constant radial velocity; stars that exhibit a residual periodicity in their radial velocities have a gravitationally bound companion.
The Center-of-Mass of Solar Systems
The Sun is generally assumed to be the center of our solar system, with the planets, asteroids and comets all orbiting around it. This is almost true but there is a gravitational pull on the Sun from the planets, especially the massive planets. This tug on the Sun causes it to "wobble" around, moving in small loops. This looping pattern repeats but the center stays fixed and is called the center-of-mass. The center-of-mass is the point around which both the star and all planets revolve. This is shown in Figure 5a and 5b (left and right), where for simplicity, there is only one planet orbiting the star.


The Doppler Effect and Radial Velocity
How can this wobble of a star be used to detect exoplanets? The answer brings us back to spectroscopy. Specifically, the Doppler effect, which gives this technique its name. By taking a spectrum of a star, we can determine its temperature, chemical composition and motion. The motion we can find is called the radial velocity and is specifically the motion either directly toward or directly away from us. Think of drawing a radius between the instrument (a spectrograph) and the star -- it is motion along this radial line we can determine. When a star (or any object emitting waves) is moving away from us, its spectral lines are shifted toward smaller wavelengths; this is called a blueshift. When the star is moving away from us, the spectrum shifts toward longer wavelengths, and this is called redshift. Figure 6 shows how this looks for the absorption lines in the spectrum of a star: the middle panel shows the lines if the star has no radial motion; in the top panel, the star is moving away from us and its lines are moved toward the red end of the spectrum; and in the bottom panel the star is moving away from us and its lines are moved toward the blue end of the spectrum.

If we observe a star long enough and find that its spectral lines are shifting back and forth, then the presence of another object (in this case, a planet) can be inferred. Keep in mind that the spectral lines we observe are for the star and not the planet; the planet's reflected light is far too faint to have its spectrum recorded. This can be seen in the animation below (Figure 7), where the spectral lines are for the star.

In reality, high-resolution spectra are needed to find the wavelength shifts to the precision needed to determine properties of an exoplanet. A segment from an extracted high-resolution spectrum around the deep pair of sodium absorption lines is shown in the animation (Figure 8) below, where each shift of the spectrum simulates a different velocity shift. By measuring the periodic shift of the wavelengths for these lines ([latex]\Delta \lambda[/latex]) relative to the rest wavelength ([latex]\lambda_0[/latex], indicated by the red vertical lines for sodium), the velocity of the star over time can be calculated.

The animation above is an extreme exaggeration (for the purpose of illustration) of the reflex Doppler shift that would occur from orbiting exoplanets. The spectral absorption lines in the animation above are between 5-20 pixels in width. A spectral line shift of just one pixel on a detector corresponds to a radial velocity change of about 1000 m/s. The amplitude of Doppler shifts caused by exoplanets would be invisible to the eye on the scale shown above.
To determine the radial velocity of a star from its spectrum, you only need to measure how far the wavelengths of the absorption lines have shifted due to the motion toward or away from us. This shift in wavelength, [latex]\Delta \lambda[/latex], is related to the radial velocity, [latex]v_{rad}[/latex], as follows:
[latex]$\frac{\Delta \lambda}{\lambda_0} = \frac{v_{rad}}{c}$[/latex]
Here, [latex]\lambda_0}[/latex] is the wavelength of a line if there was no radial motion, meaning the middle panel of Figure 6. We sometimes refer to [latex]\lambda_0}[/latex] as the rest wavelength or lab wavelength. The constant [latex]c[/latex] is the speed of light.
This same formula will give the reflex radial velocity for a star that is wobbling due to the presence of a planet, as shown in the example below.
Worked Example: Finding the Reflex Radial Velocity
You observe a star and notice that the spectral lines are moving back and forth. You know that the rest wavelength, [latex]\lambda_0}[/latex], of one of the lines is 656.28 nm and observe over time that it shifts back and forth by 0.00012 nm (a very small shift). What is the reflex radial velocity of this star?
We are given the shift in wavelength: [latex]\Delta \lambda[/latex] = 0.00012 nm and that the rest wavelength is 656.28 nm. In one step, we can find the reflex radial velocity:
[latex]$\frac{v_{rad}}{c} = \frac{\Delta \lambda}{\lambda_0}$[/latex]
[latex]v_{rad} =c \frac{\Delta \lambda}{\lambda_0}[/latex] = (3.0×10⁸ m/s)×(0.00012 nm)/(656.28 nm) = 54.8 m/s
Notice that the units of [latex]\Delta \lambda[/latex] and [latex]\lambda_0}[/latex] are the same -- they are both in nanometers. They can be in any units as long as they are the same and thus cancel each other out.
What does this value mean? This is the reflex (or residual) radial velocity -- as the star moves in its small loop, the radial velocity varies and 54.8 m/s is the maximum value it reaches. The value will reach a maximum speed of 54.8 m/s and a minimum speed of -54.8 m/s. Figure 10 below shows this idea, where in that case E is the maximum and A is the minimum value for the radial velocity.
Our ability to detect smaller planets is limited by the precision with which we can measure the shifts of spectral lines. Jupiter induces a radial velocity in the Sun of about 12 m/s with a periodicity of about 12 years. To detect Jupiter, we would need to measure a 12-year back-and-forth shift in the spectral lines of just 0.01 pixel. (The raw data collected by a spectrograph records data as pixels; the pixels are converted to wavelengths during processing.) This requires that we control the stability of our instrument to much better than this precision and maintain the control over at least 12 years. Impressively, this is the state of the art: astronomers can measure wavelength shifts to the level of 0.001 pixel (1 m/s) with decades-long stability. However, detecting the stellar reflex velocity from a planet like the Earth is a much greater challenge. The Earth induces a velocity of about 10 cm/s in the Sun. This corresponds to a one-year back-and-forth shift of 0.0001 pixel. New instruments are now being developed to try to find other examples of Earth-like planets that might harbor life.
Mass and Inclination of a Planetary System
Kepler's Third Law relates the orbital period of a planet around a star to the planet's average distance from the star: [latex]P^2=a^3[/latex], where [latex]P[/latex] is how long it takes the planet to make one orbit around the star and [latex]a[/latex] is the semi-major axis of the orbit (or the average distance of the planet from its star). This handy version requires that [latex]P[/latex] be given in years and [latex]a[/latex] given in astronomical units (AU). After formulating the Law of Gravitation, Newton generalized this law to include the masses of the two orbiting objects (for a review, see Newton's version of Kepler's Third Law):
[latex](M_{1}+M_{2})P^2 = a^3[/latex]
This means that if we know [latex]P[/latex] and [latex]a[/latex], we can get the total mass of the planetary system. The mass of the star can be estimated based on its spectral type, so this means we can find the mass of the exoplanet! But the full mass of the exoplanet cannot always be determined -- it depends on the orientation of the star system.
Looking carefully at Figure 5 again, notice that we are essentially viewing the star system edge-on, meaning that all of the star's movement is toward/away from us and along our line-of-sight. But what if the planetary system was tilted along our line of sight? Let's imagine the extreme case where we are seeing viewing the system face-on, as in the right panel in Figure 9.

In the case of a face-on orientation of the planetary system, as shown on the right in Figure 9, none of the stars motion is along out line of sight so the Doppler technique will not yield any information. In reality, planetary systems can have any orientation along our line of sight. The orientation of a planetary system is characterized by a parameter $i$, which stands for inclination. For the edge-on case, $i$ = 90° and for the face-on case, $i$ = 0°. For a system that has an inclination that is less than 90°, the exact mass cannot be determined but the minimum mass that the planet could have is found. The minimum mass depends on $\sin i$, and a full quantitative description of how to find this minimum mass is given in the box below.
Detecting planets from velocities
To detect a planet with the Doppler technique, many spectra must be obtained that span the complete orbital period of the star-planet system. Of course, astronomers don't know the orbital period in advance, so in practice, they take as many spectra as possible and then use mathematical and statistical methods to search for repeating changes in the radial velocity.
Figure 10 depicts the orbit of a star as a dashed circular path that is viewed edge-on by an observer to the right. The velocity of the star is constant in this figure, however the projected radial velocity along our line of sight is changing. At point A, the star moves toward the observer and the spectrum of the star is blue-shifted (the measured wavelengths are shorter). At point E, the star moves away from the observer and the spectrum of the star is red-shifted (the measured wavelengths are shifted to longer, redder wavelengths). At point C, there is no radial velocity - all of the motion is tangential to our line of sight. At points B and D, only the projected radial component of the velocity (velocity times the sine of the orbital inclination) can be measured in the stellar spectrum.

The radial velocity data for the star can be used to find the orbital parameters -- and determine the minimum mass -- of the planet. Details are given in the box below.
Want to know more: Finding exoplanet masses from velocity data
From the radial velocity curve of the star, the orbital period of the planet can be found (it is the same as the observed period for the star's wobble) along with the amplitude of the radial velocity for the star. The semi-amplitude, which is half of the full amplitude, is denoted as K and is shown in Figure 11 below.

The orbital parameters can then be used to calculate the semi-major axis and the mass of the planet times the orbital inclination using Newtonian physics.
[latex]$$K = \frac{1}{\sqrt{1-e^2}} \left(\frac{2 \pi G}{P}\right)^\frac{1}{3} \frac{m_{p} \sin(i)}\left({M_{*}+m_{p}}\right)^\frac{2}{3} $$[/latex]
where
[latex]m_{p}[/latex] is the mass of the exoplanet,
[latex]M_{*}[/latex] is the mass of the star,
[latex]P[/latex] is the orbital period,
[latex]e[/latex] is the eccentricity of the exoplanet's orbit and
[latex]i[/latex] is the inclination of the orbit.
This can be rearranged to give the formula for the minimum mass of the exoplanet:
[latex]$$m_{p}\sin i = K \sqrt{1-e^2} \left(\frac{P}{2 \pi G}\right)^\frac{1}{3} \left(M_{*}+m_{p}\right)^\frac{2}{3}$$[/latex]
Statistical probability for [latex]\sin(i)[/latex]
For randomly oriented inclinations, the probability of drawing a particular [latex]\sin(i)[/latex] is not uniform. Instead, the probability of observing an orbit with an inclination $\Delta i$ between $i_{1}$ and $i_{2}$ scales as the difference between the cosine of those angles:
[latex]\mathcal{P}=|\cos i_{1} - \cos i_{2}|[/latex]
So, there is an 86% probability that the inclination of a random orbit is between 90° and 30°. For these typical orbits, the true mass of the planet would be within a factor of two of the measured [latex]m_{p} \sin i[/latex]. Conversely, there is only a 14% probability that an orbital inclination is between 30° and 0° (yielding a true mass more than twice [latex]m_{p} \sin i[/latex]).
Real-world examples
In 1995, Michel Mayor and Didier Queloz discovered the first exoplanet around a main sequence star using the Doppler technique. The planet that they discovered has a mass similar to Jupiter's and orbits the star 51 Pegasi once every 4.23 days. The data from their 1995 discovery paper are shown in Figure 12 below. Because the signal repeats, the velocities can be folded so that the orbital periods repeat. This "phase-folded" data is a helpful way to display relatively short periodic signals and clearly demonstrates that the signal is repeating in a predictable way.
In the data from the Mayor & Queloz 1995 paper, you can see that from September to November in 1994, the radial velocities for 51 Pegasi were changing. This perplexed Didier Queloz, who was a graduate student working with Professor Mayor. To better understand the velocity variations, he began taking more data. Mayor and Queloz developed a mathematical model (shown as the solid line) that fits the velocity changes of the star and also describes Keplerian orbital motion. It is quite an empowering feeling to develop a model like this and to then watch the future velocities of the star follow your predictions.

Queloz and Mayor could not quite believe what they were seeing. A Jupiter-mass planet in a 4-day orbit was very different from any of the planets in our solar system. In their paper, they discuss the alternative interpretations such as stellar pulsations and effectively rule them out. They conclude that the most likely interpretation is an orbiting planetary mass companion. Massive exoplanets that are orbiting very close to their host star are called hot Jupiters. 51 Peg b is considered the poster child for hot Jupiters.
Because they derive the minimum mass, they note that the true mass may be larger than one Jupiter mass. Some skeptics believed that Mayor and Queloz had simply detected a stellar binary system that was oriented nearly face-on, which is a totally reasonable scenario to consider. However, an inclination of less than 1° is required to pump the minimum mass up to the stellar mass regime of 70 Jupiter masses. It can be rigorously shown that probabilistically there is only 1 chance in 10,000 that they would have observed such a low inclination orbit.
Want to know more: the first few exoplanet discoveries
Mayor and Queloz's discovery of an exoplanet in such a short orbital period was a game-changer. A team of astronomers at San Francisco State University were also trying to find exoplanets using the Doppler technique. They had a backlog of data because they were collecting about 50 spectra per night, but it took 24 hours to analyze a single spectrum on the slower computers of the day. Spurred on by the discovery of 51 Peg b, Sun Microsystems made a donation to the SFSU team and they quickly crunched through their observations, discovering Jupiter-like planets around 70 Virginis and 47 Ursa Majoris in their sample of 120 stars. The second of these, 47 UMa b, was very much like 51 Peg b - a Jupiter-mass planet in an orbit of just a few days.
However, the data for 70 Vir b (shown below) told a different story. Instead of the sinusoidal velocity variation seen with 51 Peg b, this planet has a more peaked velocity variation revealing an orbit with eccentricity of 0.4. The planet mass (6.6 times the mass of Jupiter) is also much larger, producing greater velocity variations in 70 Virginis. To the skeptics, the discovery of yet another massive planet was further support for the idea that nearly face-on binary star systems were being discovered rather than exoplanets. The fact that this object was in an eccentric orbit added to the doubts - planets in our solar system are in nearly circular orbits. Surely the rest of the cosmos would be like us?

Practice with the radial velocity simulator
There are a lot of concepts to understand with the Doppler technique. First, we use the spectrum of the star to measure wavelength shifts that correspond to changes in the velocity of the star. Second, we see only the projected radial component of the stellar velocity (this leads to a sinusoidal variation in the signal). Third, we don't know the inclination of the orbit - this tilt of the orbit means that the sinusoidal signal will be largest when viewed edge-on (90° inclination) and smaller as the inclination tilts toward face-on. This means that we only measure the minimum mass ($m_{p}\sini$) with the Doppler method.
Let's get some practice with the Nebraska Astronomy Applet Project (NAAP) Radial Velocity Simulator to help develop your intuition and understanding of the Doppler method. Simulated radial velocities are "phase-folded" in the upper right hand plot. The radial velocities are obtained as a function of time, but if you repeat observations over more than one orbital period, the data can be folded so that all of the peaks and troughs of the curve line up. This is routinely done by astronomers to build evidence for repeating signals.
The default shows a star with the mass of the Sun being orbited by one Jupiter-mass planet with a perfectly circular (eccentricity is zero) orbit; the system is completely edge-on, with an inclination of 90°. To change values, you can either enter them in the box (be sure to hit the return key) or use the sliders. What happens to the radial velocity as you lower the inclination? (Recall that a face-on system has an inclination of 0°.)
Transit Method
By 1999, about a dozen planet candidates had been detected with the Doppler technique, and most were similar to the hot Jupiter 51 Peg b, with minimum masses of about one Jupiter mass and orbits of just a few days. Even the astronomers working with the Doppler method were deferential in calling these objects planet "candidates" in those early days because the true mass of the orbiting companion could not be determined with this detection technique.
However, astronomers knew that if these really were planets (and not face-on stellar binary systems), about one in ten of the short-period 51 Peg b type objects would have an orbit that was oriented so that the planet would "transit" or cross our line of sight to the star. When that happens, the planet blocks some of the starlight for the few hours that it transits.
Measuring the brightness of stars is relatively straightforward, and each of the stars with 51 Peg b type exoplanets were being monitored for a possible transit. While the Doppler technique cannot determine the inclination, the data do predict when a planet will transit if the inclination is viewed nearly edge-on. If a planet transits, we know that $i$ must be close to 90° and, therefore, $sin i sim 1$. In this case, the Doppler measured mass is no longer just the minimum mass; it is the total, true mass of the planet.

Figure 14 above illustrates what is happening. During a transit the planet passes in front of the star (top animation), and as this happens the brightness of the star decreases (bottom animation). We do not actually have pictures like the top animation because stars are point sources of light, not resolved objects. The data that we have are the time series photometry (brightness measurements) depicted in the lower animation that show a regular and periodic decrease in the brightness of the star at precisely the putative transit time (predicted by the Doppler velocity measurements). Because we cannot resolve the image of the planet (or the star), this is still an indirect detection technique. However, even astronomers sometimes take some poetic license here and say that we are seeing the shadow (or the silhouette) of the planet.
There is only one case where we can resolve the physical extent of star, and that is for our Sun. If the Earth is in the right position on our orbit around the Sun, we can see the inner planets, Mercury and Venus, transiting the Sun. This fortuitous alignment happens about 13 times a century for Mercury and fewer than 2 times per century for Venus. The video below shoes a simulation of the 2012 the transit of Venus. You will have to wait until Dec 10, 2117, to see the next transit of Venus. Can you estimate the transit depth for Venus crossing the Sun?
The first transiting exoplanet
HD 209458 b was the first star where astronomers observed a transiting exoplanet. The planet had a mass similar to Jupiter's with a short orbital period of just a few days, and was independently detected by two teams using the Doppler method in the summer of 1999. HD 209458 b was the twelfth example of a hot Jupiter (a 51 Peg b analog) -- recall that about one in ten close-in planets was expected to transit -- and the planet hunters were anxiously awaiting the validation of "planet" status that a transit would bring.
In August and September 1999, the team led by Harvard graduate student David Charbonneau and Dr. Tim Brown, observed a transit at the time predicted by the Doppler velocity data. Their published data are shown in Figure 15. The ground based photometry (brightness measurements) is good enough that you can unambiguously see the transit event, but "blurring" caused by the Earth's atmosphere caused some of the starlight to be scattered. This blurring effect is what causes stars to appear to twinkle on the night sky. The team was able to combine data from multiple transits to reduce their errors to 0.015%. This precision is very impressive, but not high enough to detect a transiting planet like the Earth with a radius that is one tenth of Jupiter. A second team, led by Greg Henry, measured a partial transit in November of that same year, and the two discovery papers were published back-to-back in The Astrophysical Journal.

Transit Depth
The depth of the transit tells us about the relative size of the planet and star. Imagine a planet that is large enough to completely cover (eclipse) the star during transit. In this extreme case, the brightness $B$ of the star would drop to zero. However, the typical case is that planet is much smaller than the star. The planet’s smaller circular disk blocks the light of the star’s larger circular disk (stars and planets are both spheroidal and their cross-sections -- a 2-D slice through -- are very well-approximated by circles). The amount of light the planet blocks, called the transit depth, is then given by:
(area of planet)/(area of star) = [latex]$$ \frac{\Delta B}{B} = \frac{\pi r_{p}^2}{\pi R_{*}^2} = \left(\frac{r_{p}}{R_{*}}\right)^2 $$[/latex]
The transit depth equation above says that the fractional change in brightness ($B$) of the star is proportional to the radius of the planet ($r_{p}$) to the star ($R_{*}$) . We measure the brightness of the star without a transit and the decreased brightness during transit. So, if we know the radius of the star, we can solve this equation to derive the radius of a planet that we cannot even see. Science is amazing!
In our everyday lives, we have a lot of experience with what artists call perspective. Objects that are closer to us look larger than objects that are farther away. This sometimes lead to an incorrect intuition that transit depth is related to the star-planet separation since the more distant planet are "closer" to us. However, the incredible distances to the stars that we observe mean that the difference in star-planet distances within a given planetary system are negligible.
Worked Example: Transit Depth
Calculate the transit depth for a star the size of the Sun with a gas giant planet the size of Jupiter.
The radius of Jupiter is 71,400 km, while the radius of the Sun is 695,700 km. Substituting into the equation, we get
transit depth = (Rplanet/Rstar)2 = (71,400 km/695,700 km)2 = 0.01 or 1%
which could easily be detected with the instruments on board the Kepler spacecraft.
Check Your Learning
What is the transit depth for a star half the size of the Sun with a much smaller planet that is the size of Earth?
Show Solution
We can solve this problem the same way, this time dividing the radius of the Sun in half and with Earth's radius (6,371 km) instead of Jupiter's:
transit depth = (Rplanet/Rstar)2 = (6,371 km/347,850 km)2 = 0.0003 or 0.03%
We could also use the fact that Jupiter's radius is about 11 times larger than the Earth's radius, and scale the answer for the Jupiter-sized planet:
0.01 × (Rplanet/Rstar)2 = ((1/11)/(1/2))2 = 0.01 × (2/11)2 = 0.01 × 0.033 = 0.0003
The Transit Simulator
Let's use the NAAP transit simulator from UNL to understand how transiting exoplanets are detected with time series photometric data. The default shows a gas giant planet (see the Planet Properties box and note that the mass and radius are relative to Jupiter) orbiting a star slightly more massive than the Sun; the inclination of the system is 86.9°. Jupiter has a radius that is 11.2 times larger than the Earth's, meaning that the Earth's radius is 0.089 times the radius of Jupiter. What happens to the light curve (upper right) when you change the radius of the planet to Earth's size? You can quantify the difference by looking at the value for the eclipse (transit) depth reported to the lower right of the light curve. How do you expect the light curve to change, if at all, if you lower the mass of the exoplanet?
Now let's look at the data for the first exoplanet detected with the transit method, HD 209458 b. In the Presets box, choose this planet from the drop-down menu and click "set". What is the eclipse depth? What is the inclination of this system? At what inclination would you no longer be able to measure the transit? The eclipse depth will show (no eclipse)" when there is no transit observed. (add show answer here, it's 82.7°) [will also add longer activities at end of chapter]
The Kepler Mission
A decade before the first exoplanet was discovered, William Borucki, a scientist at NASA Ames Research Center in Mountain View CA, wrote a paper "The Photometric Method of Detecting Other Planetary Systems" (Borucki & Summers 1984) where he made the case for a space mission to detect planets orbiting other stars using the transit technique. It took more than twenty years of advocacy, but Borucki's persistence paid off. The first exoplanets were discovered in the mid-1990s, heating up interest, and after the first ground-based transit discovery in 2000, the exoplanet community rallied behind Bill Borucki's plan.
The first question in deciding whether to go forward with a space mission is: can this be done from the ground? If so, then the mission is a no-go. The justification for the space-based Kepler transit mission was the need to reach higher precision. Ground-based transit surveys could detect only 1% (0.01) changes in the brightness. The important limitations to the precision of ground-based photometry (brightness measurement) were blurring from the Earth's atmosphere and the limited number of dark nighttime hours when the telescopes point away from the Sun. From space, the atmospheric blurring is limited and the telescope can always point away from the Sun. The higher photometric precision was demonstrated by the Hubble Space Telescope, which measures 0.1% (0.001) changes in brightness. However, a special purpose telescope was really needed that could reach even higher precision with continuous monitoring of stars.
In 2009, NASA launched the Kepler Mission, which measured 0.01% or (0.0001) changes in the brightness of the host star. Figure 16 below shows that Kepler was remarkably successful in detecting a range of exoplanets with radii down to a couple times the radius of Earth.

The specific science goal for Kepler was to determine the occurrence rate of Earth-sized planets. The HAT-P-7 light curve in Figure 17 below compares a light curve from a ground-based transit survey for the planet HAT-P-7b with data from the Kepler space mission. What a difference the higher precision made!

In 2011, the first rocky exoplanet was discovered with the Kepler mission, known as Kepler-10 b. The lead author on the discovery paper, Natalie Batalha, was also the Deputy Scientist for the space mission, and her collaborative leadership style helped to make the NASA mission an incredible success. You can participate in the hunt for transiting planets in the Kepler data on the Zooniverse Planet Hunters website.
Multi-planet Transiting Systems
So far, we've only considered cases where there is just one transiting planet. In our solar system, the planets are nearly co-planar. What if there is more than one transiting planet in the time-series light-curve data? Would we be able to disentangle the different signals? If the planets are different sizes, then the transit depths will also differ. A second important parameter is the orbital period. Kepler's third law says that the orbital period is related to the semi-major axis of the orbit so that more distant planets have longer period orbits. With longer period orbits, the time interval between transits is also longer. So there are two important pieces of information that go into a model of a transiting system: the spacing between transits (i.e., the orbital period) and the depth of the transits.
The simulation below shows a system with three planets with different sizes and distances from the host star. Before playing the simulation, can you predict how the light curve will look when two planets of different sizes cross in front of the star?
Animation source: https://exoplanets.nasa.gov/
A good example of what actual data looks like for a system with more than one planet is shown in Figure 18 below for the Kepler 11 system. The six planets in this system all orbit closer than the distance to Mercury in our solar system.

After detrending the light curve to remove instrumental errors in the photometry, transits of the individual planets are phase-folded and shown below.

Key Concepts and Summary
In 1995, a planet was detected orbiting the sunlike star 51 Pegasi, launching the new field of "exoplanets" in astronomy. There are several different ways to detect exoplanets. Here we reviewed three methods for detecting exoplanets: direct imaging, where the light from the host star is suppressed so that the planet can be observed; the "Doppler" method, which detects the gravitational tug from an unseen planet that changes the radial velocity of the host star; and transit photometry, which records a dimming in brightness as the orbiting planet crosses our line of sight to the host star. Each of these observational methods is sensitive to different masses and orbital distances of planets.
Review Questions
Summary Questions
- What is the main challenge faced in taking pictures (direct imaging) of exoplanets?
- What is meant by the center of mass of a solar system? Make a sketch to help convey this idea.
- How can the absorption spectrum of a star be used to show that the star has exoplanets orbiting around it?
- How can the shift in spectral lines for a star with a planet be used to find the radial velocity of the star?
- How can Newton's version of Kepler's Third Law be used to find the mass of a planet?
- Why can only the minimum mass be found? In other words, what is needed to find the full mass?
- How is the transit method used to detect exoplanets? Describe what a light curve is.
- How does the dip in brightness caused by a transiting planet vary with the size (radius) of the planet? What if there are multiple planets transiting a star at the same time?
Exercises
- Consider the three methods for detecting exoplanets discussed in this chapter and make a chart listing the advantages of each method and what type of exoplanet it is best at finding.
- RV simulator activities
Learning Objectives
- Describe the transit method for detecting exoplanets and how the radius of an exoplanets can be found
- Explain how astrometry can be used to detect exoplanets
- Describe gravitational lensing and how microlensing can be used to detect exoplanets
Direct Imaging
Just take a picture!
Seeing is believing, so it would be ideal if we could simply point a telescope at a star and take a picture of the orbiting planets. This method is called direct imaging, and the biggest challenge is separating the reflected light of the planet from the light of the star. The problem is that the planet is typically a billion times fainter and lost in the glare of the star.
Coronagraphs
One way to block out the light from a star so that some of the faint planets orbiting the star can come into view is to use an instrument called a coronagraph. Conceptually, this is similar to trying to see a faint object (like a tennis ball, coming over the net) that is lost in the glare of the Sun. If you use your hand to cover the Sun, you can now see the tennis ball. If you were lucky enough to be in the path of totality under clear skies during the solar eclipse of 2017, then you had the perfect demonstration of how a coronagraph works. In this case, the moon acted as a coronagraph, allowing people to see stars close to the Sun in the "day" sky.
The video below is an animation showing how a coronagraph works. Before the light from the star can reach the detector, the coronagraph is used to artificially block out the starlight so that the image captured has most of this glare removed, as seen at the end of the animation when the exoplanet is revealed.
Using a Coronograph to see the planets
Direct Imaging. What happens to the brightness of the orbiting planet when a coronograph is used to block light from the host star?
Animation source: https://exoplanets.nasa.gov/
Coronagraphs were developed in the 1930s by French astronomer Bernard Lyot, who was interested in studying the Sun's corona. Light from the Sun's photosphere completely blocks out the light from the corona, except during a total solar eclipse, so this was a technique that made studying the outer layers of the Sun possible. After exoplanet detections began ramping up in the early 2000s, coronagraphs began being used to take pictures of exoplanets. Coronagraphs still pose extreme challenges and only planets that are sufficiently far from their host stars can be revealed this way.
At the Keck telescope in Hawaii, astronomers used the adaptive optics (AO) system with a coronagraph to detect four planets orbiting the star HR 8799. This star was selected as a good target because it is relatively close (about 40 parsecs from the Sun) and because the star is young (a mere 30 million years) so that any planets would also be young and luminous. Exoplanets are named with lower case letters beginning with "b" in the order that they are discovered. In the image below, planets b, c, and d were found in 2008 and planet e was discovered a few years later. It is challenging to find planets close to the star where the coronagraphic suppression of light is more difficult.

Once the light from the planet's host star has been suppressed with a coronagraph, more information about the properties can be gleaned using other methods. Spectroscopy of the four planets around HR 8799 has been carried out using the Project 1640 instrument on the Palomar telescope and shows variable amounts of absorption from water, carbon monoxide, carbon dioxide, and methane.
The search for exoplanets using coronagraphs is an exciting technique, and impressive technological advances in this field are permitting the detection of smaller planets located at smaller inner working angles (i.e., closer to the star). The James Webb Space Telescope has coronagraphs built into several of its infrared cameras, such as NIRcam and MIRI. In 2023, JWST took its first direct images of the exoplanet HIP 65426 b. The goal for the next 20 years is to develop space-based coronagraphs on large telescopes to image Earth-like planets around nearby stars and to obtain spectra to search for signatures of life.
Star Shades
Another way to block out starlight to enhance planets is to use a star shade. While coronagraphs are built into the telescope's optics, star shades are completely separate from the spacecraft carrying the telescope. The figure below shows the basic layout of a starshade system: the starshade would fly in formation with the spacecraft at a nearly fixed distance in front. And this distance is not tiny -- the starshade needs to be located somewhere between 20,000 to 40,000 km ahead of the spacecraft, depending on the size of the spacecraft.

The distances need to be extremely precise, down to 1 meter (3.2 feet), to avoid having unnecessary light from the star leak through and contaminate the image. This is a technological challenge but engineers at NASA's Jet Propulsion Lab have carried out computer simulations that show this is feasible to do. The upcoming Nancy Grace Roman Space Telescope infrared mission will have a coronagraph on board and there is discussion of adding a starshade as well. The next generation of telescopes to image planets, such as NASA's Habitable Worlds Observatory (HWO), will include a coronagraph and a starshade.
Adaptive Optics
To obtain direct images of exoplanets around nearby stars with ground based telescopes, a technique called adaptive optics (AO) has been developed to correct for the atmospheric twinkling of starlight. AO combines optics, electrical engineering, and computers to correct for atmospheric distortion. In cases where there is more than one star in the field of view of the telescope, light from one of the nearby bright non-science stars is picked off with a mirror and sent to the AO system. If a bright star is not nearby, then a laser can be used to simulate a star on the sky. Hundreds of actuators on a deformable mirror in the AO system are moved around at high speed (thousands of Hertz) until the image of the star is concentrated into the smallest possible point of light. This counteracts the atmospheric distortion for all stars in the field of view, including the science star of interest.

Direct imaging is the only method for finding exoplanets where the planet is directly seen. In the other methods, we must instead infer the presence of exoplanets by how they affect the star they are orbiting, either the star's motion or its brightness. These methods rely upon indirect detection.
Astrometry
Astrometry is one of the oldest methods that astronomers have for studying the motion of stars. The name says it all: astrometry is the process of measuring the positions of objects in the sky. This technique has been used to measure parallax (distances) to stars and proper motions (motions in the plane of the sky) and to detect binary star orbits. More recently, astronomers have tried to detect exoplanets with this technique. This technique has not been very successful from ground-based telescopes because distortions from the atmosphere ("twinkling" of stars) blurs out the spatial position of stars and therefore does not permit precise enough measurements. However, astrometry as a planet detection technique is about to explode onto the scene with the launch of the space-based Gaia spacecraft in 2013 by the European Space Agency. The Gaia mission is still collecting data and, as we’ll see, it takes many, many years of data to detect exoplanets using astrometry, so any new detections with Gaia may take some time. So far, Gaia has found one exoplanet.
To date, only three exoplanets have been found using this method: DENIS-P J082303.1-491201 b, GJ 896 A b and HIP 66074 b. The first two exoplanets are gas giants that were found using ground based instruments, while the third exoplanet is the exoplanet found with Gaia.
How It Works
The basic idea behind astrometry for exoplanet detection is depicted in the animation below. Astronomers obtain a series of pictures over time (a "time series") and use at least three reference stars (which have nearly constant positions) to measure the changing position of the host star in the plane of the sky.
Astrometry
Animation source: https://exoplanets.nasa.gov/
Side Note: How is astrometry (or the "astrometric technique") different from Direct Imaging or from the Doppler method?
With direct imaging, astronomers obtain an actual image of the planet. To confirm that the planet is not a background source, additional observations are taken over time, verifying orbital motion of the planet candidate. But the big difference between direct imaging and astrometry is that with direct imaging the planet is observed.
Like the Doppler (or "radial velocity") technique, astrometry is an "indirect" method - the planet is not seen, but its existence is inferred by the gravitation effect that the planet exerts on the host star. However, different things are being measured with Doppler and Astrometric techniques; the radial velocity technique measures the changing speed of the star along one dimension: the line of sight. The fundamental data are measurements of radial velocity over time. Astrometry measures the changing position (not speed) of the star projected onto the two-dimensional plane of the sky. The fundamental data are positions (angles and angular separations) over time.
Because astrometric measurements are made in two dimensions (x, y in the plane of the sky), the astrometric orbital model measures the true mass of the planet; it does not suffer from the unresolved inclination of orbital models from the radial velocity method.
It is straightforward to show that distance between the star and planet from the center-of-mass ([latex]a[/latex]) and their masses are related by:
[latex]$M_{*} d_{*} = m_{p} d_{p}$[/latex]
where
$M_{*}$ is the mass of the star
$m_{p}$ is the mass of the star
$d_{*}$ is the distance of the star from the center-of-mass
$d_{p}$ is the distance of the planet from the center-of-mass
Concept Check: Calculate the Astrometric Displacement of the Sun
- The mass of Jupiter is 0.001 times the mass of the Sun and Jupiter orbits at a distance of about 5 AU from the Sun. What is the astrometric displacement (in AU) of the Sun because of Jupiter?
- The mass of Saturn is 1/3 the mass of Jupiter and Saturn orbits at a distance of about 10 AU from the Sun. What is the astrometric displacement (in AU) of the Sun because of Saturn?
- If Saturn (at 10AU) had the same mass as Jupiter, would the astrometric displacement of the Sun be smaller or larger than the displacement from the real Jupiter at 5AU?
- Can you picture the total astrometric orbit of the Sun that is caused by both Jupiter and Saturn? Try to make a sketch.
Need help? For part 3, consider how the center-of-mass point changes. A good resource for this is: https://astro.unl.edu/naap/esp/centerofmass.html, where you can quantitatively investigate the center-of mass.
Notice that even if you know the mass of the star (from its spectral type) and the distance between the star and the center of mass with astrometry, there are still two unknowns in the equation above: the mass of the planet and distance between the planet and the center of mass. However, astrometric observations also reveal the orbital period, so we can use Kepler's Laws to derive the semi-major axis of the planet (the semi-major axis a is the same quantity as the distance between the planet and the center of mass). Then, if you know the mass of the star and measure the astrometric displacement of the star, you can solve for the planet mass.
Astrometry of Multi-Planet Systems
Consider our solar system. The astrometric motion of the Sun is depicted in Figure 20 below. These positional measurements assume a bird's eye view looking down onto the orbital plane of the solar system. The larger lighter yellow circle indicates the size of the Sun, so you would need to wait long enough to see motion that is larger than this size.

The star wobble demo below will allow you to add in any planets in our solar system and see the gravitational effect on the Sun that might be observed if we were observing from above the orbital plane. However (this is an important point), to fully model an astrometric orbit, astronomers must observe the star through a large fraction of one complete orbit. This would require about 12 years of observations to detect Jupiter or 30 years for Saturn!
Concept Check: Astrometric Displacement of the Sun - a Bird's Eye view
Select only Jupiter and run the simulation. Then run the simulation selecting only Saturn. Does this match the result you expected from parts 1 and 2 of the first Astrometry question above?
Now select both Jupiter and Saturn. Does this result match your picture from part d of the first Astrometry question above?
How do the astrometric influences of Mercury, Venus, Earth, Mars, and Pluto compare to the influence of Jupiter, Saturn, Uranus, and Neptune.
Gravitational Microlensing
Gravitational Lensing Basics
Stars emit light in all directions. When we observe a distant star we see only the few rays of light from the star that are directed straight toward us, as shown in Figure 21. However, if a foreground star passes very close to our line of sight of the more distant source star, the light from the distant background star will be gravitationally focused. To understand this idea, remember that we are the observer. The distant star is the source. The intervening star is the lens, and it bends light from the source toward us. Figure 22 below show the light path from a distant source star with an intervening "lens" star. How does the path of light from the source star differ in Figures 21 and 22?


The bending and focusing of the light from the source star in Figure 22 is caused by the gravity of the lens star. To fully understand why light is bent, gravity needs to be considered as described by Albert Einstein. In 1915, Einstein published his General Theory of Relativity, treating gravity as a warping of the space-time continuum and an attribute of mass rather than a fundamental force. Einstein's description of gravity employs mathematically sophisticated metric tensors, while Newtonian gravity uses more commonly accessible algebra or calculus. On the scales that humans are accustomed to working with, general relativity converges to the Newtonian description, so we are justified in defaulting to the Newtonian description of gravity. More details are given in the box below.
Want to know more: General Relativity and Space-Time
Sir Isaac Newton considered space and time to be completely independent, and that continued to be the accepted view until the beginning of the twentieth century. But Albert Einstein showed that there is an intimate connection between space and time, and that only by considering the two together—in what we call spacetime—can we build up a correct picture of the physical world. We examine spacetime a bit more closely in the next subsection.
The gist of Einstein’s Theory of General Relativity is that the presence of matter curves or warps the fabric of spacetime. This curving of spacetime is identified with gravity. When something else—a beam of light, an electron, or the starship Enterprise—enters such a region of distorted spacetime, its path will be different from what it would have been in the absence of the matter. As American physicist John Wheeler summarized it: “Matter tells spacetime how to curve; spacetime tells matter how to move.”
Spacetime is four-dimensional: three space dimensions and one time dimension (the time dimension is also warped but will do not discuss that further here). The warping of the space dimensions is sometimes shown as a 2-D grid, as in the part of the animation below that shows light bent around a single star. The light is following the shortest path it can take as it encounters the warped space.

The amount of distortion in spacetime depends on the mass of material that is involved and on how concentrated and compact it is. Terrestrial objects, such as people and buildings, have far too little mass to introduce any significant distortion.
Every object with mass has a gravitational field. We can think of objects with spherical symmetry, like stars or planets, as point sources. The strength of the gravitational field for a star is spherically symmetric. The strength of the gravitational field for a star is spherically symmetric. When we consider gravitational lensing, the relevant geometry is a slice through the sphere - a disk perpendicular to our line of sight.
Qualitatively, the gravitational field at small radii on this disk (i.e., closest to the lensing object) is strongest, and light from the source is bent so strongly that it converges closer to the lensing object and does not reach the observer. Likewise, the gravitational field is weakest at large radii on the disk, and light from the source star focuses at distances beyond the observer. However, there is a ring on the disk where the bending of light from the source is "just right." Those rays of light from the source are brought to a focus at the position of the observer. This effect is called gravitational lensing, and it was predicted in 1936 by Einstein. The ring of light that is focused at the position of the observer is given the special name of an Einstein ring.
The size of the Einstein ring depends on the mass of the lens star, the distance between the observer and the lens, DL, and the distance from the observer to the source, DS. Gravitational lensing occurs even if the lens star is too faint for us to see. Since most of the stars in galaxy are low mass, low luminosity M dwarf stars, this is often the case!
Since lensing is an effect of gravity, it might seem like the amplitude of brightening will depend on the mass of the lens. While the mass of the lensing star determines the radius of the Einstein ring and the duration of the lensing event, the amplitude of brightening is most sensitive to something called the impact parameter. When the lensing object precisely lines up with our view to the source star, the impact parameter is zero and the magnification in brightness is a maximum. If the lensing object is not as tightly aligned with our view of the source - perhaps it just clips our view of the source star, then the impact parameter is larger and the brightening of the source star (the "magnification") is not as strong. This is depicted in Figure 23 below. The Einstein ring is represented by the dashed circle. The red, yellow, green, and blue lines show the path that the lensing object travels with different offsets from precise alignment with our view of the source. The closer the alignment of the Einstein ring of the lens to our view of the source, the stronger the magnification that we observe. Gravitational lensing from objects as massive as stars typically lasts for several days.

Microlensing
Gravitational lensing generally refers to the bending of light from a background source by a foreground massive object. Gravitational microlensing is a special case where multiple lensing events occur from more than one foreground mass. If the lensing star happens to have orbiting planets that also cross our line of sight to the source star, then a second microlensing event is superimposed during the brightening event. Because the mass of the orbiting planet is smaller than the mass of a star, the duration of the second microlensing event will be shorter, but since the alignment of the lensing planet is essentially the same as the alignment of the host star, the amplitude of the magnification will be similar.

The video below summarizes how microlensing searches are carried out at observatories today this clip highlights the Las Cumbres Observatory Global Telescope Network).
Key Concepts and Summary
In this chapter, we reviewed three more methods for detecting exoplanets: transit photometry, which records a dimming in brightness as the orbiting planet crosses our line of sight to the host star; astrometry, where the orbiting planet changes the location of a host star in the plane of the sky; microlensing, where planets (often orbiting a star) pass in front of a background host star, bending spacetime to brighten the background source. Each of these observational methods is sensitive to different masses and orbital distances of planets.
Review Questions
Summary Questions
- How is the transit method used to detect exoplanets? Describe what a light curve is.
- How does the dip in brightness caused by a transiting planet vary with the size (radius) of the planet? What if there are multiple planets transiting a star at the same time?
- Why don't each of the eight planets in our solar system induce identical astrometric movements of the Sun? Which planet causes the largest "wobble" of the Sun? Why?
- What is gravitational lensing and microlensing?
- How can gravitational microlensing be used to detect exoplanets?
Exercises
- Consider the three methods for detecting exoplanets discussed in this chapter and make a chart listing the advantages of each method and what type of exoplanet it is best at finding.
- Transit simulator activities
Learning Objectives
- Describe the transit method for detecting exoplanets and how the radius of an exoplanets can be found
- Explain how astrometry can be used to detect exoplanets
- Describe gravitational lensing and how microlensing can be used to detect exoplanets
Direct Imaging
Just take a picture!
Seeing is believing, so it would be ideal if we could simply point a telescope at a star and take a picture of the orbiting planets. This method is called direct imaging, and the biggest challenge is separating the reflected light of the planet from the light of the star. The problem is that the planet is typically a billion times fainter and lost in the glare of the star.
Coronagraphs
One way to block out the light from a star so that some of the faint planets orbiting the star can come into view is to use an instrument called a coronagraph. Conceptually, this is similar to trying to see a faint object (like a tennis ball, coming over the net) that is lost in the glare of the Sun. If you use your hand to cover the Sun, you can now see the tennis ball. If you were lucky enough to be in the path of totality under clear skies during the solar eclipse of 2017, then you had the perfect demonstration of how a coronagraph works. In this case, the moon acted as a coronagraph, allowing people to see stars close to the Sun in the "day" sky.
The video below is an animation showing how a coronagraph works. Before the light from the star can reach the detector, the coronagraph is used to artificially block out the starlight so that the image captured has most of this glare removed, as seen at the end of the animation when the exoplanet is revealed.
Using a Coronograph to see the planets
Direct Imaging. What happens to the brightness of the orbiting planet when a coronograph is used to block light from the host star?
Animation source: https://exoplanets.nasa.gov/
Coronagraphs were developed in the 1930s by French astronomer Bernard Lyot, who was interested in studying the Sun's corona. Light from the Sun's photosphere completely blocks out the light from the corona, except during a total solar eclipse, so this was a technique that made studying the outer layers of the Sun possible. After exoplanet detections began ramping up in the early 2000s, coronagraphs began being used to take pictures of exoplanets. Coronagraphs still pose extreme challenges and only planets that are sufficiently far from their host stars can be revealed this way.
At the Keck telescope in Hawaii, astronomers used the adaptive optics (AO) system with a coronagraph to detect four planets orbiting the star HR 8799. This star was selected as a good target because it is relatively close (about 40 parsecs from the Sun) and because the star is young (a mere 30 million years) so that any planets would also be young and luminous. Exoplanets are named with lower case letters beginning with "b" in the order that they are discovered. In the image below, planets b, c, and d were found in 2008 and planet e was discovered a few years later. It is challenging to find planets close to the star where the coronagraphic suppression of light is more difficult.
Once the light from the planet's host star has been suppressed with a coronagraph, more information about the properties can be gleaned using other methods. Spectroscopy of the four planets around HR 8799 has been carried out using the Project 1640 instrument on the Palomar telescope and shows variable amounts of absorption from water, carbon monoxide, carbon dioxide, and methane.
The search for exoplanets using coronagraphs is an exciting technique, and impressive technological advances in this field are permitting the detection of smaller planets located at smaller inner working angles (i.e., closer to the star). The James Webb Space Telescope has coronagraphs built into several of its infrared cameras, such as NIRcam and MIRI. In 2023, JWST took its first direct images of the exoplanet HIP 65426 b. The goal for the next 20 years is to develop space-based coronagraphs on large telescopes to image Earth-like planets around nearby stars and to obtain spectra to search for signatures of life.
Star Shades
Another way to block out starlight to enhance planets is to use a star shade. While coronagraphs are built into the telescope's optics, star shades are completely separate from the spacecraft carrying the telescope. The figure below shows the basic layout of a starshade system: the starshade would fly in formation with the spacecraft at a nearly fixed distance in front. And this distance is not tiny -- the starshade needs to be located somewhere between 20,000 to 40,000 km ahead of the spacecraft, depending on the size of the spacecraft.
The distances need to be extremely precise, down to 1 meter (3.2 feet), to avoid having unnecessary light from the star leak through and contaminate the image. This is a technological challenge but engineers at NASA's Jet Propulsion Lab have carried out computer simulations that show this is feasible to do. The upcoming Nancy Grace Roman Space Telescope infrared mission will have a coronagraph on board and there is discussion of adding a starshade as well. The next generation of telescopes to image planets, such as NASA's Habitable Worlds Observatory (HWO), will include a coronagraph and a starshade.
Adaptive Optics
To obtain direct images of exoplanets around nearby stars with ground based telescopes, a technique called adaptive optics (AO) has been developed to correct for the atmospheric twinkling of starlight. AO combines optics, electrical engineering, and computers to correct for atmospheric distortion. In cases where there is more than one star in the field of view of the telescope, light from one of the nearby bright non-science stars is picked off with a mirror and sent to the AO system. If a bright star is not nearby, then a laser can be used to simulate a star on the sky. Hundreds of actuators on a deformable mirror in the AO system are moved around at high speed (thousands of Hertz) until the image of the star is concentrated into the smallest possible point of light. This counteracts the atmospheric distortion for all stars in the field of view, including the science star of interest.
Direct imaging is the only method for finding exoplanets where the planet is directly seen. In the other methods, we must instead infer the presence of exoplanets by how they affect the star they are orbiting, either the star's motion or its brightness. These methods rely upon indirect detection.
Astrometry
Astrometry is one of the oldest methods that astronomers have for studying the motion of stars. The name says it all: astrometry is the process of measuring the positions of objects in the sky. This technique has been used to measure parallax (distances) to stars and proper motions (motions in the plane of the sky) and to detect binary star orbits. More recently, astronomers have tried to detect exoplanets with this technique. This technique has not been very successful from ground-based telescopes because distortions from the atmosphere ("twinkling" of stars) blurs out the spatial position of stars and therefore does not permit precise enough measurements. However, astrometry as a planet detection technique is about to explode onto the scene with the launch of the space-based Gaia spacecraft in 2013 by the European Space Agency. The Gaia mission is still collecting data and, as we’ll see, it takes many, many years of data to detect exoplanets using astrometry, so any new detections with Gaia may take some time. So far, Gaia has found one exoplanet.
To date, only three exoplanets have been found using this method: DENIS-P J082303.1-491201 b, GJ 896 A b and HIP 66074 b. The first two exoplanets are gas giants that were found using ground based instruments, while the third exoplanet is the exoplanet found with Gaia.
How It Works
The basic idea behind astrometry for exoplanet detection is depicted in the animation below. Astronomers obtain a series of pictures over time (a "time series") and use at least three reference stars (which have nearly constant positions) to measure the changing position of the host star in the plane of the sky.
Astrometry
Animation source: https://exoplanets.nasa.gov/
Side Note: How is astrometry (or the "astrometric technique") different from Direct Imaging or from the Doppler method?
With direct imaging, astronomers obtain an actual image of the planet. To confirm that the planet is not a background source, additional observations are taken over time, verifying orbital motion of the planet candidate. But the big difference between direct imaging and astrometry is that with direct imaging the planet is observed.
Like the Doppler (or "radial velocity") technique, astrometry is an "indirect" method - the planet is not seen, but its existence is inferred by the gravitation effect that the planet exerts on the host star. However, different things are being measured with Doppler and Astrometric techniques; the radial velocity technique measures the changing speed of the star along one dimension: the line of sight. The fundamental data are measurements of radial velocity over time. Astrometry measures the changing position (not speed) of the star projected onto the two-dimensional plane of the sky. The fundamental data are positions (angles and angular separations) over time.
Because astrometric measurements are made in two dimensions (x, y in the plane of the sky), the astrometric orbital model measures the true mass of the planet; it does not suffer from the unresolved inclination of orbital models from the radial velocity method.
It is straightforward to show that distance between the star and planet from the center-of-mass ([latex]a[/latex]) and their masses are related by:
[latex]$M_{*} d_{*} = m_{p} d_{p}$[/latex]
where
$M_{*}$ is the mass of the star
$m_{p}$ is the mass of the star
$d_{*}$ is the distance of the star from the center-of-mass
$d_{p}$ is the distance of the planet from the center-of-mass
Concept Check: Calculate the Astrometric Displacement of the Sun
- The mass of Jupiter is 0.001 times the mass of the Sun and Jupiter orbits at a distance of about 5 AU from the Sun. What is the astrometric displacement (in AU) of the Sun because of Jupiter?
- The mass of Saturn is 1/3 the mass of Jupiter and Saturn orbits at a distance of about 10 AU from the Sun. What is the astrometric displacement (in AU) of the Sun because of Saturn?
- If Saturn (at 10AU) had the same mass as Jupiter, would the astrometric displacement of the Sun be smaller or larger than the displacement from the real Jupiter at 5AU?
- Can you picture the total astrometric orbit of the Sun that is caused by both Jupiter and Saturn? Try to make a sketch.
Need help? For part 3, consider how the center-of-mass point changes. A good resource for this is: https://astro.unl.edu/naap/esp/centerofmass.html, where you can quantitatively investigate the center-of mass.
Notice that even if you know the mass of the star (from its spectral type) and the distance between the star and the center of mass with astrometry, there are still two unknowns in the equation above: the mass of the planet and distance between the planet and the center of mass. However, astrometric observations also reveal the orbital period, so we can use Kepler's Laws to derive the semi-major axis of the planet (the semi-major axis a is the same quantity as the distance between the planet and the center of mass). Then, if you know the mass of the star and measure the astrometric displacement of the star, you can solve for the planet mass.
Astrometry of Multi-Planet Systems
Consider our solar system. The astrometric motion of the Sun is depicted in Figure 20 below. These positional measurements assume a bird's eye view looking down onto the orbital plane of the solar system. The larger lighter yellow circle indicates the size of the Sun, so you would need to wait long enough to see motion that is larger than this size.
The star wobble demo below will allow you to add in any planets in our solar system and see the gravitational effect on the Sun that might be observed if we were observing from above the orbital plane. However (this is an important point), to fully model an astrometric orbit, astronomers must observe the star through a large fraction of one complete orbit. This would require about 12 years of observations to detect Jupiter or 30 years for Saturn!
Concept Check: Astrometric Displacement of the Sun - a Bird's Eye view
Select only Jupiter and run the simulation. Then run the simulation selecting only Saturn. Does this match the result you expected from parts 1 and 2 of the first Astrometry question above?
Now select both Jupiter and Saturn. Does this result match your picture from part d of the first Astrometry question above?
How do the astrometric influences of Mercury, Venus, Earth, Mars, and Pluto compare to the influence of Jupiter, Saturn, Uranus, and Neptune.
Gravitational Microlensing
Gravitational Lensing Basics
Stars emit light in all directions. When we observe a distant star we see only the few rays of light from the star that are directed straight toward us, as shown in Figure 21. However, if a foreground star passes very close to our line of sight of the more distant source star, the light from the distant background star will be gravitationally focused. To understand this idea, remember that we are the observer. The distant star is the source. The intervening star is the lens, and it bends light from the source toward us. Figure 22 below show the light path from a distant source star with an intervening "lens" star. How does the path of light from the source star differ in Figures 21 and 22?
The bending and focusing of the light from the source star in Figure 22 is caused by the gravity of the lens star. To fully understand why light is bent, gravity needs to be considered as described by Albert Einstein. In 1915, Einstein published his General Theory of Relativity, treating gravity as a warping of the space-time continuum and an attribute of mass rather than a fundamental force. Einstein's description of gravity employs mathematically sophisticated metric tensors, while Newtonian gravity uses more commonly accessible algebra or calculus. On the scales that humans are accustomed to working with, general relativity converges to the Newtonian description, so we are justified in defaulting to the Newtonian description of gravity. More details are given in the box below.
Want to know more: General Relativity and Space-Time
Sir Isaac Newton considered space and time to be completely independent, and that continued to be the accepted view until the beginning of the twentieth century. But Albert Einstein showed that there is an intimate connection between space and time, and that only by considering the two together—in what we call spacetime—can we build up a correct picture of the physical world. We examine spacetime a bit more closely in the next subsection.
The gist of Einstein’s Theory of General Relativity is that the presence of matter curves or warps the fabric of spacetime. This curving of spacetime is identified with gravity. When something else—a beam of light, an electron, or the starship Enterprise—enters such a region of distorted spacetime, its path will be different from what it would have been in the absence of the matter. As American physicist John Wheeler summarized it: “Matter tells spacetime how to curve; spacetime tells matter how to move.”
Spacetime is four-dimensional: three space dimensions and one time dimension (the time dimension is also warped but will do not discuss that further here). The warping of the space dimensions is sometimes shown as a 2-D grid, as in the part of the animation below that shows light bent around a single star. The light is following the shortest path it can take as it encounters the warped space.
The amount of distortion in spacetime depends on the mass of material that is involved and on how concentrated and compact it is. Terrestrial objects, such as people and buildings, have far too little mass to introduce any significant distortion.
Every object with mass has a gravitational field. We can think of objects with spherical symmetry, like stars or planets, as point sources. The strength of the gravitational field for a star is spherically symmetric. The strength of the gravitational field for a star is spherically symmetric. When we consider gravitational lensing, the relevant geometry is a slice through the sphere - a disk perpendicular to our line of sight.
Qualitatively, the gravitational field at small radii on this disk (i.e., closest to the lensing object) is strongest, and light from the source is bent so strongly that it converges closer to the lensing object and does not reach the observer. Likewise, the gravitational field is weakest at large radii on the disk, and light from the source star focuses at distances beyond the observer. However, there is a ring on the disk where the bending of light from the source is "just right." Those rays of light from the source are brought to a focus at the position of the observer. This effect is called gravitational lensing, and it was predicted in 1936 by Einstein. The ring of light that is focused at the position of the observer is given the special name of an Einstein ring.
The size of the Einstein ring depends on the mass of the lens star, the distance between the observer and the lens, DL, and the distance from the observer to the source, DS. Gravitational lensing occurs even if the lens star is too faint for us to see. Since most of the stars in galaxy are low mass, low luminosity M dwarf stars, this is often the case!
Since lensing is an effect of gravity, it might seem like the amplitude of brightening will depend on the mass of the lens. While the mass of the lensing star determines the radius of the Einstein ring and the duration of the lensing event, the amplitude of brightening is most sensitive to something called the impact parameter. When the lensing object precisely lines up with our view to the source star, the impact parameter is zero and the magnification in brightness is a maximum. If the lensing object is not as tightly aligned with our view of the source - perhaps it just clips our view of the source star, then the impact parameter is larger and the brightening of the source star (the "magnification") is not as strong. This is depicted in Figure 23 below. The Einstein ring is represented by the dashed circle. The red, yellow, green, and blue lines show the path that the lensing object travels with different offsets from precise alignment with our view of the source. The closer the alignment of the Einstein ring of the lens to our view of the source, the stronger the magnification that we observe. Gravitational lensing from objects as massive as stars typically lasts for several days.
Microlensing
Gravitational lensing generally refers to the bending of light from a background source by a foreground massive object. Gravitational microlensing is a special case where multiple lensing events occur from more than one foreground mass. If the lensing star happens to have orbiting planets that also cross our line of sight to the source star, then a second microlensing event is superimposed during the brightening event. Because the mass of the orbiting planet is smaller than the mass of a star, the duration of the second microlensing event will be shorter, but since the alignment of the lensing planet is essentially the same as the alignment of the host star, the amplitude of the magnification will be similar.
The video below summarizes how microlensing searches are carried out at observatories today this clip highlights the Las Cumbres Observatory Global Telescope Network).
Key Concepts and Summary
In this chapter, we reviewed three more methods for detecting exoplanets: transit photometry, which records a dimming in brightness as the orbiting planet crosses our line of sight to the host star; astrometry, where the orbiting planet changes the location of a host star in the plane of the sky; microlensing, where planets (often orbiting a star) pass in front of a background host star, bending spacetime to brighten the background source. Each of these observational methods is sensitive to different masses and orbital distances of planets.
Review Questions
Summary Questions
- How is the transit method used to detect exoplanets? Describe what a light curve is.
- How does the dip in brightness caused by a transiting planet vary with the size (radius) of the planet? What if there are multiple planets transiting a star at the same time?
- Why don't each of the eight planets in our solar system induce identical astrometric movements of the Sun? Which planet causes the largest "wobble" of the Sun? Why?
- What is gravitational lensing and microlensing?
- How can gravitational microlensing be used to detect exoplanets?
Exercises
- Consider the three methods for detecting exoplanets discussed in this chapter and make a chart listing the advantages of each method and what type of exoplanet it is best at finding.
- Transit simulator activities
Perhaps nothing captures the imagination more fully than envisioning life on another planet. What was still in the realm of science fiction just a few decades ago, especially through television shows like Star Trek, is now commonplace: as of 2024, more than 5,000 exoplanets -- planets orbiting a star other than our Sun -- have been discovered. Their detection and study has brought the search for life in the universe to a new level. Exoplanets can be categorized as rocky or gaseous, and their atmospheres can be searched for biosignatures. Unlocking more clues from exoplanets will narrow down the possibilities for habitable worlds in our galaxy.
Learning Objectives
By the end of this chapter, you will be able to:
- Explain the center-of-mass of a solar system and star “wobbling” that enables detection
- Describe how spectra can be used to detect exoplanets (the Doppler Technique) and how the minimum mass of an exoplanet can be found
- Summarize the types of planets (sizes, masses, orbital periods) that can be detected with imaging and radial velocity ("Doppler") data.
- Describe the transit method for detecting exoplanets and how the radius of an exoplanets can be found
Early History
There are several techniques for discovering exoplanets. In this chapter we will focus only on the two most common methods. The first exoplanets were detected by the gravitational effect that they exerted on their host stars, but the majority of exoplanets known today were detected by monitoring the decrease in light as they pass in front of their stars. Each method is sensitive to specific types of exoplanets, and when we piece the information together, we can begin to understand the diversity of exoplanets. Humans have long wondered whether other solar systems with planets like our own Earth might exist among the billions of stars in our galaxy, and this moment will go down as the time when we figured this out.
The first failures and successes
The discovery of worlds around other stars has a long history with many false starts. In the 1960s, Peter van de Kamp interpreted a small wobble in the position of Barnard's star as an exoplanet. Observations by other astronomers contradicted that result, although van de Kamp never admitted that his claim was in error. In 1991, Lyne and Bailes reported in the prestigious Nature journal the discovery of a planet orbiting the pulsar star PSR 1829-10. They had measured frequency of pulse arrival times and used the Doppler effect to infer the presence of a planet, but later realized that they had not properly accounted for the velocity of the Earth around the Sun. When Lyne retracted the result at a meeting of the American Astronomical Society in January 1992, he received a standing ovation for his scientific integrity and courage.
There were also a few signals that were initially published with alternative interpretations that later turned out to be exoplanets. In 1988, Campbell, Walker and Yang observed a periodic radial velocity signal in the red giant star, Gamma Cephei. They tentatively interpreted this as photospheric variability in the star, but additional data by Hatzes and colleagues in 2002 confirmed that this was indeed an orbiting exoplanet. Another example occurred in 1989 when Latham and colleagues published the discovery of a companion to the star HD 114762; the team cautiously interpreted this as a possible brown dwarf. However, by 2012, this object was reclassified as a massive exoplanet.
The first confirmed exoplanets were very peculiar. Aleksander Wolszczan and Dale Frail measured periodic variations in the frequency of pulse arrival times to detect two small planets orbiting the pulsar neutron star, PSR 1257+12 in 1992. In 1994, they found one more planet in this system. These discoveries were puzzling because this planetary system should not have survived the supernova explosion of the host star before it evolved to become a spinning neutron star. The planets likely formed in a debris disk around the pulsar. In retrospect, perhaps that discovery should have told us that planet formation was a ubiquitous process. If planets can form around an exploding supernova, then we should have expected that exoplanets were common.
In 1952, astronomer Otto Struve made the remarkable assertion that if a Jupiter-like planet resided very close to its host star, that the gravitational tug of the planet on the star would produce radial velocity variations that might be detected in the stellar spectra with high enough precision measurements.
Twentieth-century astronomers worked to improve the precision of their techniques, and in 1995, the first exoplanet was finally discovered around a sun-like star. Most astronomers consider the dawn of exoplanets to be November 1995 when Michel Mayor and Didier Queloz discovered a gas giant planet orbiting the sun-like star 51 Pegasi at the Observatoire de Haute-Provence using the Doppler technique. The interpretation of this radial velocity signal as an exoplanet remained controversial for a few years but is no longer questioned. 51 Peg b was the first confirmed detection of an exoplanet around a main sequence star, and the 2019 Nobel Prize was awarded to Mayor and Queloz.
Direct Imaging
Just take a picture!
Seeing is believing, so it would be ideal if we could simply point a telescope at a star and take a picture of the orbiting planets. This method is called direct imaging, and the biggest challenge is separating the reflected light of the planet from the light of the star. The problem is that the planet is typically a billion times fainter and lost in the glare of the star. While techniques do exist to block out the light from the star, there are few direct images of exoplanets. Instead, we infer the presence of exoplanets by how they affect the star they are orbiting, either the star's motion or its brightness. These methods rely upon indirect detection.
The Doppler Technique
The Doppler technique (also called the radial velocity technique) was the first method to successfully detect exoplanets orbiting Sun-like stars. This technique measures the velocity of stars over time. All stars are traveling in orbits around the center of our Milky Way galaxy. For example, the Sun takes about 220 Myr to complete one loop around the galaxy. As the Sun travels around the galaxy, some stars appear to be moving toward us while others are moving away.
After subtracting the constant galactic velocity for a given star, a small remaining periodic motion in the velocity of a star (a "residual" velocity) can reveal that the star is being tugged around a common center-of-mass by another body, as shown in Figure 5 below. These residual velocities can be modeled to determine whether the orbiting object is a planet. With the Doppler technique, the planet is never observed (making this an "indirect" detection method). Instead, the time-varying velocity of the host star is modeled to infer the presence of an unseen planet. All stars have some nearly constant radial velocity; stars that exhibit a residual periodicity in their radial velocities have a gravitationally bound companion.
The Center-of-Mass of Solar Systems
The Sun is generally assumed to be the center of our solar system, with the planets, asteroids and comets all orbiting around it. This is almost true but there is a gravitational pull on the Sun from the planets, especially the massive planets. This tug on the Sun causes it to "wobble" around, moving in small loops. This looping pattern repeats but the center stays fixed and is called the center-of-mass. The center-of-mass is the point around which both the star and all planets revolve. This is shown in Figure 5a and 5b (left and right), where for simplicity, there is only one planet orbiting the star.
The Doppler Effect and Radial Velocity
How can this wobble of a star be used to detect exoplanets? The answer brings us back to spectroscopy. Specifically, the Doppler effect, which gives this technique its name. By taking a spectrum of a star, we can determine its temperature, chemical composition and motion. The motion we can find is called the radial velocity and is specifically the motion either directly toward or directly away from us. Think of drawing a radius between the instrument (a spectrograph) and the star -- it is motion along this radial line we can determine. When a star (or any object emitting waves) is moving away from us, its spectral lines are shifted toward smaller wavelengths; this is called a blueshift. When the star is moving away from us, the spectrum shifts toward longer wavelengths, and this is called redshift. Figure 6 shows how this looks for the absorption lines in the spectrum of a star: the middle panel shows the lines if the star has no radial motion; in the top panel, the star is moving away from us and its lines are moved toward the red end of the spectrum; and in the bottom panel the star is moving away from us and its lines are moved toward the blue end of the spectrum.
If we observe a star long enough and find that its spectral lines are shifting back and forth, then the presence of another object (in this case, a planet) can be inferred. Keep in mind that the spectral lines we observe are for the star and not the planet; the planet's reflected light is far too faint to have its spectrum recorded. This can be seen in the animation below (Figure 7), where the spectral lines are for the star.
In reality, high-resolution spectra are needed to find the wavelength shifts to the precision needed to determine properties of an exoplanet. A segment from an extracted high-resolution spectrum around the deep pair of sodium absorption lines is shown in the animation (Figure 8) below, where each shift of the spectrum simulates a different velocity shift. By measuring the periodic shift of the wavelengths for these lines ([latex]\Delta \lambda[/latex]) relative to the rest wavelength ([latex]\lambda_0[/latex], indicated by the red vertical lines for sodium), the velocity of the star over time can be calculated.
The animation above is an extreme exaggeration (for the purpose of illustration) of the reflex Doppler shift that would occur from orbiting exoplanets. The spectral absorption lines in the animation above are between 5-20 pixels in width. A spectral line shift of just one pixel on a detector corresponds to a radial velocity change of about 1000 m/s. The amplitude of Doppler shifts caused by exoplanets would be invisible to the eye on the scale shown above.
To determine the radial velocity of a star from its spectrum, you only need to measure how far the wavelengths of the absorption lines have shifted due to the motion toward or away from us. This shift in wavelength, [latex]\Delta \lambda[/latex], is related to the radial velocity, [latex]v_{rad}[/latex], as follows:
[latex]$\frac{\Delta \lambda}{\lambda_0} = \frac{v_{rad}}{c}$[/latex]
Here, [latex]\lambda_0}[/latex] is the wavelength of a line if there was no radial motion, meaning the middle panel of Figure 6. We sometimes refer to [latex]\lambda_0}[/latex] as the rest wavelength or lab wavelength. The constant [latex]c[/latex] is the speed of light.
This same formula will give the reflex radial velocity for a star that is wobbling due to the presence of a planet, as shown in the example below.
Worked Example: Finding the Reflex Radial Velocity
You observe a star and notice that the spectral lines are moving back and forth. You know that the rest wavelength, [latex]\lambda_0}[/latex], of one of the lines is 656.28 nm and observe over time that it shifts back and forth by 0.00012 nm (a very small shift). What is the reflex radial velocity of this star?
We are given the shift in wavelength: [latex]\Delta \lambda[/latex] = 0.00012 nm and that the rest wavelength is 656.28 nm. In one step, we can find the reflex radial velocity:
[latex]$\frac{v_{rad}}{c} = \frac{\Delta \lambda}{\lambda_0}$[/latex]
[latex]v_{rad} =c \frac{\Delta \lambda}{\lambda_0}[/latex] = (3.0×10⁸ m/s)×(0.00012 nm)/(656.28 nm) = 54.8 m/s
Notice that the units of [latex]\Delta \lambda[/latex] and [latex]\lambda_0}[/latex] are the same -- they are both in nanometers. They can be in any units as long as they are the same and thus cancel each other out.
What does this value mean? This is the reflex (or residual) radial velocity -- as the star moves in its small loop, the radial velocity varies and 54.8 m/s is the maximum value it reaches. The value will reach a maximum speed of 54.8 m/s and a minimum speed of -54.8 m/s. Figure 10 below shows this idea, where in that case E is the maximum and A is the minimum value for the radial velocity.
Our ability to detect smaller planets is limited by the precision with which we can measure the shifts of spectral lines. Jupiter induces a radial velocity in the Sun of about 12 m/s with a periodicity of about 12 years. To detect Jupiter, we would need to measure a 12-year back-and-forth shift in the spectral lines of just 0.01 pixel. (The raw data collected by a spectrograph records data as pixels; the pixels are converted to wavelengths during processing.) This requires that we control the stability of our instrument to much better than this precision and maintain the control over at least 12 years. Impressively, this is the state of the art: astronomers can measure wavelength shifts to the level of 0.001 pixel (1 m/s) with decades-long stability. However, detecting the stellar reflex velocity from a planet like the Earth is a much greater challenge. The Earth induces a velocity of about 10 cm/s in the Sun. This corresponds to a one-year back-and-forth shift of 0.0001 pixel. New instruments are now being developed to try to find other examples of Earth-like planets that might harbor life.
Mass and Inclination of a Planetary System
Kepler's Third Law relates the orbital period of a planet around a star to the planet's average distance from the star: [latex]P^2=a^3[/latex], where [latex]P[/latex] is how long it takes the planet to make one orbit around the star and [latex]a[/latex] is the semi-major axis of the orbit (or the average distance of the planet from its star). This handy version requires that [latex]P[/latex] be given in years and [latex]a[/latex] given in astronomical units (AU). After formulating the Law of Gravitation, Newton generalized this law to include the masses of the two orbiting objects (for a review, see Newton's version of Kepler's Third Law):
[latex](M_{1}+M_{2})P^2 = a^3[/latex]
This means that if we know [latex]P[/latex] and [latex]a[/latex], we can get the total mass of the planetary system. The mass of the star can be estimated based on its spectral type, so this means we can find the mass of the exoplanet! But the full mass of the exoplanet cannot always be determined -- it depends on the orientation of the star system.
Looking carefully at Figure 5 again, notice that we are essentially viewing the star system edge-on, meaning that all of the star's movement is toward/away from us and along our line-of-sight. But what if the planetary system was tilted along our line of sight? Let's imagine the extreme case where we are seeing viewing the system face-on, as in the right panel in Figure 9.
In the case of a face-on orientation of the planetary system, as shown on the right in Figure 9, none of the stars motion is along out line of sight so the Doppler technique will not yield any information. In reality, planetary systems can have any orientation along our line of sight. The orientation of a planetary system is characterized by a parameter $i$, which stands for inclination. For the edge-on case, $i$ = 90° and for the face-on case, $i$ = 0°. For a system that has an inclination that is less than 90°, the exact mass cannot be determined but the minimum mass that the planet could have is found. The minimum mass depends on $\sin i$, and a full quantitative description of how to find this minimum mass is given in the box below.
Detecting planets from velocities
To detect a planet with the Doppler technique, many spectra must be obtained that span the complete orbital period of the star-planet system. Of course, astronomers don't know the orbital period in advance, so in practice, they take as many spectra as possible and then use mathematical and statistical methods to search for repeating changes in the radial velocity.
Figure 10 depicts the orbit of a star as a dashed circular path that is viewed edge-on by an observer to the right. The velocity of the star is constant in this figure, however the projected radial velocity along our line of sight is changing. At point A, the star moves toward the observer and the spectrum of the star is blue-shifted (the measured wavelengths are shorter). At point E, the star moves away from the observer and the spectrum of the star is red-shifted (the measured wavelengths are shifted to longer, redder wavelengths). At point C, there is no radial velocity - all of the motion is tangential to our line of sight. At points B and D, only the projected radial component of the velocity (velocity times the sine of the orbital inclination) can be measured in the stellar spectrum.
The radial velocity data for the star can be used to find the orbital parameters -- and determine the minimum mass -- of the planet. Details are given in the box below.
Want to know more: Finding exoplanet masses from velocity data
From the radial velocity curve of the star, the orbital period of the planet can be found (it is the same as the observed period for the star's wobble) along with the amplitude of the radial velocity for the star. The semi-amplitude, which is half of the full amplitude, is denoted as K and is shown in Figure 11 below.
The orbital parameters can then be used to calculate the semi-major axis and the mass of the planet times the orbital inclination using Newtonian physics.
[latex]$$K = \frac{1}{\sqrt{1-e^2}} \left(\frac{2 \pi G}{P}\right)^\frac{1}{3} \frac{m_{p} \sin(i)}\left({M_{*}+m_{p}}\right)^\frac{2}{3} $$[/latex]
where
[latex]m_{p}[/latex] is the mass of the exoplanet,
[latex]M_{*}[/latex] is the mass of the star,
[latex]P[/latex] is the orbital period,
[latex]e[/latex] is the eccentricity of the exoplanet's orbit and
[latex]i[/latex] is the inclination of the orbit.
This can be rearranged to give the formula for the minimum mass of the exoplanet:
[latex]$$m_{p}\sin i = K \sqrt{1-e^2} \left(\frac{P}{2 \pi G}\right)^\frac{1}{3} \left(M_{*}+m_{p}\right)^\frac{2}{3}$$[/latex]
Statistical probability for [latex]\sin(i)[/latex]
For randomly oriented inclinations, the probability of drawing a particular [latex]\sin(i)[/latex] is not uniform. Instead, the probability of observing an orbit with an inclination $\Delta i$ between $i_{1}$ and $i_{2}$ scales as the difference between the cosine of those angles:
[latex]\mathcal{P}=|\cos i_{1} - \cos i_{2}|[/latex]
So, there is an 86% probability that the inclination of a random orbit is between 90° and 30°. For these typical orbits, the true mass of the planet would be within a factor of two of the measured [latex]m_{p} \sin i[/latex]. Conversely, there is only a 14% probability that an orbital inclination is between 30° and 0° (yielding a true mass more than twice [latex]m_{p} \sin i[/latex]).
Real-world examples
In 1995, Michel Mayor and Didier Queloz discovered the first exoplanet around a main sequence star using the Doppler technique. The planet that they discovered has a mass similar to Jupiter's and orbits the star 51 Pegasi once every 4.23 days. The data from their 1995 discovery paper are shown in Figure 12 below. Because the signal repeats, the velocities can be folded so that the orbital periods repeat. This "phase-folded" data is a helpful way to display relatively short periodic signals and clearly demonstrates that the signal is repeating in a predictable way.
In the data from the Mayor & Queloz 1995 paper, you can see that from September to November in 1994, the radial velocities for 51 Pegasi were changing. This perplexed Didier Queloz, who was a graduate student working with Professor Mayor. To better understand the velocity variations, he began taking more data. Mayor and Queloz developed a mathematical model (shown as the solid line) that fits the velocity changes of the star and also describes Keplerian orbital motion. It is quite an empowering feeling to develop a model like this and to then watch the future velocities of the star follow your predictions.
Queloz and Mayor could not quite believe what they were seeing. A Jupiter-mass planet in a 4-day orbit was very different from any of the planets in our solar system. In their paper, they discuss the alternative interpretations such as stellar pulsations and effectively rule them out. They conclude that the most likely interpretation is an orbiting planetary mass companion. Massive exoplanets that are orbiting very close to their host star are called hot Jupiters. 51 Peg b is considered the poster child for hot Jupiters.
Because they derive the minimum mass, they note that the true mass may be larger than one Jupiter mass. Some skeptics believed that Mayor and Queloz had simply detected a stellar binary system that was oriented nearly face-on, which is a totally reasonable scenario to consider. However, an inclination of less than 1° is required to pump the minimum mass up to the stellar mass regime of 70 Jupiter masses. It can be rigorously shown that probabilistically there is only 1 chance in 10,000 that they would have observed such a low inclination orbit.
Want to know more: the first few exoplanet discoveries
Mayor and Queloz's discovery of an exoplanet in such a short orbital period was a game-changer. A team of astronomers at San Francisco State University were also trying to find exoplanets using the Doppler technique. They had a backlog of data because they were collecting about 50 spectra per night, but it took 24 hours to analyze a single spectrum on the slower computers of the day. Spurred on by the discovery of 51 Peg b, Sun Microsystems made a donation to the SFSU team and they quickly crunched through their observations, discovering Jupiter-like planets around 70 Virginis and 47 Ursa Majoris in their sample of 120 stars. The second of these, 47 UMa b, was very much like 51 Peg b - a Jupiter-mass planet in an orbit of just a few days.
However, the data for 70 Vir b (shown below) told a different story. Instead of the sinusoidal velocity variation seen with 51 Peg b, this planet has a more peaked velocity variation revealing an orbit with eccentricity of 0.4. The planet mass (6.6 times the mass of Jupiter) is also much larger, producing greater velocity variations in 70 Virginis. To the skeptics, the discovery of yet another massive planet was further support for the idea that nearly face-on binary star systems were being discovered rather than exoplanets. The fact that this object was in an eccentric orbit added to the doubts - planets in our solar system are in nearly circular orbits. Surely the rest of the cosmos would be like us?
Practice with the radial velocity simulator
There are a lot of concepts to understand with the Doppler technique. First, we use the spectrum of the star to measure wavelength shifts that correspond to changes in the velocity of the star. Second, we see only the projected radial component of the stellar velocity (this leads to a sinusoidal variation in the signal). Third, we don't know the inclination of the orbit - this tilt of the orbit means that the sinusoidal signal will be largest when viewed edge-on (90° inclination) and smaller as the inclination tilts toward face-on. This means that we only measure the minimum mass ($m_{p}\sini$) with the Doppler method.
Let's get some practice with the Nebraska Astronomy Applet Project (NAAP) Radial Velocity Simulator to help develop your intuition and understanding of the Doppler method. Simulated radial velocities are "phase-folded" in the upper right hand plot. The radial velocities are obtained as a function of time, but if you repeat observations over more than one orbital period, the data can be folded so that all of the peaks and troughs of the curve line up. This is routinely done by astronomers to build evidence for repeating signals.
The default shows a star with the mass of the Sun being orbited by one Jupiter-mass planet with a perfectly circular (eccentricity is zero) orbit; the system is completely edge-on, with an inclination of 90°. To change values, you can either enter them in the box (be sure to hit the return key) or use the sliders. What happens to the radial velocity as you lower the inclination? (Recall that a face-on system has an inclination of 0°.)
Transit Method
By 1999, about a dozen planet candidates had been detected with the Doppler technique, and most were similar to the hot Jupiter 51 Peg b, with minimum masses of about one Jupiter mass and orbits of just a few days. Even the astronomers working with the Doppler method were deferential in calling these objects planet "candidates" in those early days because the true mass of the orbiting companion could not be determined with this detection technique.
However, astronomers knew that if these really were planets (and not face-on stellar binary systems), about one in ten of the short-period 51 Peg b type objects would have an orbit that was oriented so that the planet would "transit" or cross our line of sight to the star. When that happens, the planet blocks some of the starlight for the few hours that it transits.
Measuring the brightness of stars is relatively straightforward, and each of the stars with 51 Peg b type exoplanets were being monitored for a possible transit. While the Doppler technique cannot determine the inclination, the data do predict when a planet will transit if the inclination is viewed nearly edge-on. If a planet transits, we know that $i$ must be close to 90° and, therefore, $sin i sim 1$. In this case, the Doppler measured mass is no longer just the minimum mass; it is the total, true mass of the planet.
Figure 14 above illustrates what is happening. During a transit the planet passes in front of the star (top animation), and as this happens the brightness of the star decreases (bottom animation). We do not actually have pictures like the top animation because stars are point sources of light, not resolved objects. The data that we have are the time series photometry (brightness measurements) depicted in the lower animation that show a regular and periodic decrease in the brightness of the star at precisely the putative transit time (predicted by the Doppler velocity measurements). Because we cannot resolve the image of the planet (or the star), this is still an indirect detection technique. However, even astronomers sometimes take some poetic license here and say that we are seeing the shadow (or the silhouette) of the planet.
There is only one case where we can resolve the physical extent of star, and that is for our Sun. If the Earth is in the right position on our orbit around the Sun, we can see the inner planets, Mercury and Venus, transiting the Sun. This fortuitous alignment happens about 13 times a century for Mercury and fewer than 2 times per century for Venus. The video below shoes a simulation of the 2012 the transit of Venus. You will have to wait until Dec 10, 2117, to see the next transit of Venus. Can you estimate the transit depth for Venus crossing the Sun?
The first transiting exoplanet
HD 209458 b was the first star where astronomers observed a transiting exoplanet. The planet had a mass similar to Jupiter's with a short orbital period of just a few days, and was independently detected by two teams using the Doppler method in the summer of 1999. HD 209458 b was the twelfth example of a hot Jupiter (a 51 Peg b analog) -- recall that about one in ten close-in planets was expected to transit -- and the planet hunters were anxiously awaiting the validation of "planet" status that a transit would bring.
In August and September 1999, the team led by Harvard graduate student David Charbonneau and Dr. Tim Brown, observed a transit at the time predicted by the Doppler velocity data. Their published data are shown in Figure 15. The ground based photometry (brightness measurements) is good enough that you can unambiguously see the transit event, but "blurring" caused by the Earth's atmosphere caused some of the starlight to be scattered. This blurring effect is what causes stars to appear to twinkle on the night sky. The team was able to combine data from multiple transits to reduce their errors to 0.015%. This precision is very impressive, but not high enough to detect a transiting planet like the Earth with a radius that is one tenth of Jupiter. A second team, led by Greg Henry, measured a partial transit in November of that same year, and the two discovery papers were published back-to-back in The Astrophysical Journal.
Transit Depth
The depth of the transit tells us about the relative size of the planet and star. Imagine a planet that is large enough to completely cover (eclipse) the star during transit. In this extreme case, the brightness $B$ of the star would drop to zero. However, the typical case is that planet is much smaller than the star. The planet’s smaller circular disk blocks the light of the star’s larger circular disk (stars and planets are both spheroidal and their cross-sections -- a 2-D slice through -- are very well-approximated by circles). The amount of light the planet blocks, called the transit depth, is then given by:
(area of planet)/(area of star) = [latex]$$ \frac{\Delta B}{B} = \frac{\pi r_{p}^2}{\pi R_{*}^2} = \left(\frac{r_{p}}{R_{*}}\right)^2 $$[/latex]
The transit depth equation above says that the fractional change in brightness ($B$) of the star is proportional to the radius of the planet ($r_{p}$) to the star ($R_{*}$) . We measure the brightness of the star without a transit and the decreased brightness during transit. So, if we know the radius of the star, we can solve this equation to derive the radius of a planet that we cannot even see. Science is amazing!
In our everyday lives, we have a lot of experience with what artists call perspective. Objects that are closer to us look larger than objects that are farther away. This sometimes lead to an incorrect intuition that transit depth is related to the star-planet separation since the more distant planet are "closer" to us. However, the incredible distances to the stars that we observe mean that the difference in star-planet distances within a given planetary system are negligible.
Worked Example: Transit Depth
Calculate the transit depth for a star the size of the Sun with a gas giant planet the size of Jupiter.
The radius of Jupiter is 71,400 km, while the radius of the Sun is 695,700 km. Substituting into the equation, we get
transit depth = (Rplanet/Rstar)2 = (71,400 km/695,700 km)2 = 0.01 or 1%
which could easily be detected with the instruments on board the Kepler spacecraft.
Check Your Learning
What is the transit depth for a star half the size of the Sun with a much smaller planet that is the size of Earth?
Show Solution
We can solve this problem the same way, this time dividing the radius of the Sun in half and with Earth's radius (6,371 km) instead of Jupiter's:
transit depth = (Rplanet/Rstar)2 = (6,371 km/347,850 km)2 = 0.0003 or 0.03%
We could also use the fact that Jupiter's radius is about 11 times larger than the Earth's radius, and scale the answer for the Jupiter-sized planet:
0.01 × (Rplanet/Rstar)2 = ((1/11)/(1/2))2 = 0.01 × (2/11)2 = 0.01 × 0.033 = 0.0003
The Transit Simulator
Let's use the NAAP transit simulator from UNL to understand how transiting exoplanets are detected with time series photometric data. The default shows a gas giant planet (see the Planet Properties box and note that the mass and radius are relative to Jupiter) orbiting a star slightly more massive than the Sun; the inclination of the system is 86.9°. Jupiter has a radius that is 11.2 times larger than the Earth's, meaning that the Earth's radius is 0.089 times the radius of Jupiter. What happens to the light curve (upper right) when you change the radius of the planet to Earth's size? You can quantify the difference by looking at the value for the eclipse (transit) depth reported to the lower right of the light curve. How do you expect the light curve to change, if at all, if you lower the mass of the exoplanet?
Now let's look at the data for the first exoplanet detected with the transit method, HD 209458 b. In the Presets box, choose this planet from the drop-down menu and click "set". What is the eclipse depth? What is the inclination of this system? At what inclination would you no longer be able to measure the transit? The eclipse depth will show (no eclipse)" when there is no transit observed. (add show answer here, it's 82.7°) [will also add longer activities at end of chapter]
The Kepler Mission
A decade before the first exoplanet was discovered, William Borucki, a scientist at NASA Ames Research Center in Mountain View CA, wrote a paper "The Photometric Method of Detecting Other Planetary Systems" (Borucki & Summers 1984) where he made the case for a space mission to detect planets orbiting other stars using the transit technique. It took more than twenty years of advocacy, but Borucki's persistence paid off. The first exoplanets were discovered in the mid-1990s, heating up interest, and after the first ground-based transit discovery in 2000, the exoplanet community rallied behind Bill Borucki's plan.
The first question in deciding whether to go forward with a space mission is: can this be done from the ground? If so, then the mission is a no-go. The justification for the space-based Kepler transit mission was the need to reach higher precision. Ground-based transit surveys could detect only 1% (0.01) changes in the brightness. The important limitations to the precision of ground-based photometry (brightness measurement) were blurring from the Earth's atmosphere and the limited number of dark nighttime hours when the telescopes point away from the Sun. From space, the atmospheric blurring is limited and the telescope can always point away from the Sun. The higher photometric precision was demonstrated by the Hubble Space Telescope, which measures 0.1% (0.001) changes in brightness. However, a special purpose telescope was really needed that could reach even higher precision with continuous monitoring of stars.
In 2009, NASA launched the Kepler Mission, which measured 0.01% or (0.0001) changes in the brightness of the host star. Figure 16 below shows that Kepler was remarkably successful in detecting a range of exoplanets with radii down to a couple times the radius of Earth.
The specific science goal for Kepler was to determine the occurrence rate of Earth-sized planets. The HAT-P-7 light curve in Figure 17 below compares a light curve from a ground-based transit survey for the planet HAT-P-7b with data from the Kepler space mission. What a difference the higher precision made!
In 2011, the first rocky exoplanet was discovered with the Kepler mission, known as Kepler-10 b. The lead author on the discovery paper, Natalie Batalha, was also the Deputy Scientist for the space mission, and her collaborative leadership style helped to make the NASA mission an incredible success. You can participate in the hunt for transiting planets in the Kepler data on the Zooniverse Planet Hunters website.
Multi-planet Transiting Systems
So far, we've only considered cases where there is just one transiting planet. In our solar system, the planets are nearly co-planar. What if there is more than one transiting planet in the time-series light-curve data? Would we be able to disentangle the different signals? If the planets are different sizes, then the transit depths will also differ. A second important parameter is the orbital period. Kepler's third law says that the orbital period is related to the semi-major axis of the orbit so that more distant planets have longer period orbits. With longer period orbits, the time interval between transits is also longer. So there are two important pieces of information that go into a model of a transiting system: the spacing between transits (i.e., the orbital period) and the depth of the transits.
The simulation below shows a system with three planets with different sizes and distances from the host star. Before playing the simulation, can you predict how the light curve will look when two planets of different sizes cross in front of the star?
Animation source: https://exoplanets.nasa.gov/
A good example of what actual data looks like for a system with more than one planet is shown in Figure 18 below for the Kepler 11 system. The six planets in this system all orbit closer than the distance to Mercury in our solar system.
After detrending the light curve to remove instrumental errors in the photometry, transits of the individual planets are phase-folded and shown below.
Key Concepts and Summary
In 1995, a planet was detected orbiting the sunlike star 51 Pegasi, launching the new field of "exoplanets" in astronomy. There are several different ways to detect exoplanets. Here we reviewed three methods for detecting exoplanets: direct imaging, where the light from the host star is suppressed so that the planet can be observed; the "Doppler" method, which detects the gravitational tug from an unseen planet that changes the radial velocity of the host star; and transit photometry, which records a dimming in brightness as the orbiting planet crosses our line of sight to the host star. Each of these observational methods is sensitive to different masses and orbital distances of planets.
Review Questions
Summary Questions
- What is the main challenge faced in taking pictures (direct imaging) of exoplanets?
- What is meant by the center of mass of a solar system? Make a sketch to help convey this idea.
- How can the absorption spectrum of a star be used to show that the star has exoplanets orbiting around it?
- How can the shift in spectral lines for a star with a planet be used to find the radial velocity of the star?
- How can Newton's version of Kepler's Third Law be used to find the mass of a planet?
- Why can only the minimum mass be found? In other words, what is needed to find the full mass?
- How is the transit method used to detect exoplanets? Describe what a light curve is.
- How does the dip in brightness caused by a transiting planet vary with the size (radius) of the planet? What if there are multiple planets transiting a star at the same time?
Exercises
- Consider the three methods for detecting exoplanets discussed in this chapter and make a chart listing the advantages of each method and what type of exoplanet it is best at finding.
- RV simulator activities
The existence of planets around other stars is now commonplace -- over 5,000 exoplanets have been detected in 2023 compared to less than 50 known exoplanets in 2000. That's a 100-fold increase in just over 20 years! The solar systems that have been found look very different from our own. Some have gas giants orbiting very close to their host stars and others have planets with sizes that are not seen amongst our eight planets. Let's take a look at the diversity of planets and planetary systems that have been found and highlight a few of the most interesting, with respect to the possibility of finding life. We'll conclude by asking how we might detect the presence of life on exoplanets.
Learning Objectives
By the end of this chapter, you will be able to:
- Discuss the ranges for mass and radius that the exoplanets discovered have
- Describe the types of exoplanets being detected and how they compare to the planets in our solar system
- Explain how different detection techniques are sensitive to detecting different kinds of exoplanets.
- Discuss the TRAPPIST-1 planetary system and how it is similar to and different from our own
- Explain the concept of a biosignature and describe Earth’s biosignatures
- Discuss how biosignatures can be searched for in exoplanetary atmospheres
Exoplanet Statistics
Now that a large sample of exoplanets have been detected, we can take stock of the types of planets that have been found. Overall, the transit method and radial velocity methods have yielded the most exoplanets to date, with 75% of known exoplanets found with the transit method and 19% with the radial velocity method. The animation below summarizes the history of planetary discovery. Note the explosion of detections with the transit method in 2014 when data from the Kepler mission started coming in.
Timeline for exoplanet discoveries.
Figures 1 and 2 below summarize the detections by the plotting the planet's mass (Fig. 1) and the planet's radius (Fig. 2) against how long it takes the planet to orbit its host star (its period). Each planet has a symbol to indicate which detection method was used to discover the exoplanet. We will focus on the radial velocity and transit methods discussed in the previous chapter, but some planets have been found with gravitational microlensing. The extended version of this chapter briefly describes
There are two methods included in Figures 1 and 2 which we did not discuss in the previous chapter, as neither are one of the primary methods used: timing variations and orbital brightness modulations. We'll explain these two methods briefly.
When and for how long a planetary transit will occur is predictable. If there is another unseen planet in the system that is gravitationally tugging on the transiting exoplanet, this can cause the transiting planet to either speed up or slow down and it will cross in front of the star sooner or later than predicted. This is the theory behind timing variations. This method has the advantage of allowing you to determine the mass of the exoplanets. A couple dozen of the more than 5,000 exoplanets detected to date were found via timing variations. In our own solar system, the planet Neptune was discovered via timing variations in 1846 -- Uranus was found to orbit slower or faster during its orbit around the Sun than predicted, and the presence of another planet was hypothesized to be the reason. Neptune was found exactly where it would be if it was the cause for the changes in Uranus' orbital motion. Science!
A massive planet orbiting very close to its host star can cause the brightness of the star to change due changes in the amount of light reflecting off the planet's surface. Of course, the planet needs to have a reflective surface for this effect to be measured, and these changes in reflected light will manifest as a change in the brightness of the star that is in lockstep with the orbital period (or phases) of the close-in planet. These types of changes are called orbital brightness modulations. Changes in brightness can also be caused by distortions to the star's shape caused by the massive, close-orbiting planet.
There a few important limitations to Figures 1 and 2 that we need to note. Figure 1 shows the mass and orbital period of the exoplanets. The mass of an exoplanet can be found with the radial velocity (RV) method and the timing variations method. The transit method allows you to determine the radius of an exoplanet but not the mass. Not all exoplanets found with the transit method have been followed up with the RV method to get the mass, so not all planets found with the transit method are included in Figure 1.
In a similar way, not all exoplanets detected with the RV method are shown in Figure 2, and this is clear to see as Figure 2 is dominated by green squares for the transit method. Of the 1000+ stars found with the RV method, only the 66 that have had their radii determined are included in Figure 2.
Concept Check: Analyzing the Mass-Period and Radius-Period Plots
There are trends in the mass-period plot in Figure 1 that are especially prevalent when looking at the distribution for each detection method.
Transit Method
What trends do you see in radius and period for the exoplanets found using the transit method?
Looking at the radius-period plot (Figure 2), the transit method overwhelmingly finds planets with periods less than a hundred days. There are very few exoplanets found with periods greater than the Earth (365 days) -- the limit is about 1,000 days which is a little less than 3 Earth years.
The transit method picks up planets with a wide range of radii, from planets smaller than the Earth all the way up to planets 30 times larger than the Earth. However, intuitively, planets with very small radii will be the most difficult to detect, as these cause the least amount of dimming in the brightness of the host star.
Summary: Most radii, short periods (a few hours up to a few years).
What types of exoplanets will the transit method preferentially detect?
The transit method is best at finding exoplanets that are fairly close to their host stars. This is not a technical fault of the method itself but rather the fact that to collect data for planets on long period orbits, you need measurements spanning decades or centuries, and we've only been observing transits for about 20 years so far.
Radial Velocity Method
What trends do you see in mass and period for the exoplanets found using the radial velocity (RV) method?
The RV method is able to find exoplanets with a wide range of orbital periods, from less than 1 day up to 105 days (275 years). The method is sensitive to a wide range of masses, from planets slightly less-massive than the Earth up to planets with 30 times the mass of Jupiter; there are more higher mass planets found than lower mass planets. As for the period range, there is a generally diagonal trend, where low-mass planets with shorter orbital periods and high-mass planets with longer orbital periods are found. There is some scatter whereby higher-mass planets with shorter orbital periods are found, but virtually no planets with lower masses and periods greater than 1 year are detected.
What types of exoplanets will the RV method preferentially detect? What are the limitations?
The RV method is best at finding massive planets with periods out to about 50 years. The method can also find lower mass planets orbiting close to their host stars but cannot detect low-mass planets orbiting further away.
Direct Imaging
What trends do you see in mass and period for the exoplanets found using the imaging method? How about trends in the radius and period?
What types of exoplanets will the direct imaging method preferentially detect?
In Figure 2, there is a gap for planets with radii of 4 to 10 times the radius of the Earth (4 REarth < R < 10 REarth), especially for planets that are orbiting close to their host stars. There are Jupiter-sized planets found orbiting close to their stars (hot Jupiters) as well as Earth-sized planets orbiting close -- where are the planets with radii 4-10 REarth? Is this gap due to limitations of the detection methods or is this telling us something more general about the types of planets that form around stars? Since the transit method can detect stars below and above this range of radii, this suggests the gap (sometimes called the "hot Neptune desert") is real and that it has something to do either with the formation or longevity of planets this size. One idea is that planets of this size are most susceptible to having their atmospheres completely evaporate away, making them planets that can transition in size and eventually have a smaller radius (where planets are found).
The types of planets being found are commonly divided into four main categories: gas giants, Neptune-like, super-Earths, and terrestrial. Figure 3 summarizes the fraction of each of these types that has been found. Super-Earths have radii between 1.2 and 2.8 that of Earth, and the other large group with sizes between 2.8 and 4 that of Earth are often called Neptune-like or mini-Neptunes. While the totals are split into about one-third each for gas giants, super-Earths, and Neptune-like exoplanets, we need to keep in mind that the transit method, which has found 75% of all exoplanets, is biased against very small, terrestrial-size planets. The smallest radius for an exoplanet detected with the transit method is about 30% the size of Earth's radius (R = 0.30 REarth), so we cannot immediately conclude that there are fewer terrestrial exoplanets out there compared to the other types. In our own solar system, two of the eight planets, Mercury and Mars, have radii of 0.39 REarth and 0.53 REarth.
For a clearer look into the distribution of exoplanets by their size, Figure 4 shows a histogram of the radii for known transiting exoplanets that have a measured radius. This does not eliminate the bias against terrestrial planets but some interesting trends emerge.
First, we see a preponderance of exoplanets with sizes intermediate between the Earth and Neptune -- the super-Earths and mini-Neptunes. No planets of these types exist in our solar system! What a remarkable discovery it is that the most common types of planets in the Galaxy are completely absent from our solar system and were unknown until the Kepler mission. Further, this idea that planets of roughly Earth’s size are so numerous is surely one of the most important discoveries of modern astronomy.
The TRAPPIST-1 system
One of the most intriguing planetary systems detected so far is TRAPPIST-1. The TRAPPIST-1 planetary system is about 40 light years away from Earth and has seven known exoplanets. The TRAPPIST-South survey program came online in 2010 by European astronomers using a small, ground-based telescope at La Silla Observatory in Chile to search for exoplanets with the transit method. The acronym TRAPPIST stands for “Transiting Planets and Planetesimals Small Telescope,” and is a nod to the popular Trappist beers found in Belgium.
In 2015, three planets were detected with this survey around a star that the team renamed TRAPPIST-1 (catchier than the original catalog name for this star, 2MASS J23062928-0502285). TRAPPIST-1 is a small, cool, red dwarf; the advantage of looking at small stars is that the transit signals from smaller, terrestrial planets are stronger. In 2017, four more planets were discovered around TRAPPIST-1, with the transit timing variations, bringing the total to seven planets orbiting TRAPPIST-1. All of these planets orbit at a distance that is smaller than the distance from the Sun to Mercury in our solar system and are similar in size to the rocky terrestrial worlds. Figure 5 below summarizes the properties of the seven known planets orbiting TRAPPIST-1 compared to our solar system's four terrestrial planets.
Worked Example: Finding an Exoplanet's Density
If both the mass and radius are known for an exoplanet, we can find its density. We explored this quantitatively in the chapter on the Earth but revisit it here with an emphasis on finding densities for exoplanets.
Notice that the masses and radii for the TRAPPIST-1 planets are reported relative to the Earth. For example, TRAPPIST-1 b has a radius that is 12% larger than the Earth's radius (RT1b = 1.12 REarth) and a mass almost identical to the Earth's (MT1b = 1.02 MEarth). Since these values are relative to the Earth, we can immediately estimate TRAPPIST-1 b's density:
[latex]\rho = M/V = M/\frac{4}{3} \pi R^3[/latex]
Now, by taking the ratio of the density of any exoplanet to that of the Earth's density, we can find the density of the exoplanet relative to Earth:
[latex]\rho/\rho_{E} = (M/\frac{4}{3} \pi R^3)/(M_{E}/\frac{4}{3} \pi R_{E}^3) = (M/M_{E})/(R/R_{E})^3[/latex]
Putting in the values of the mass and radius for TRAPPIST-1 b, we find:
ρT1b = (1.02 MEarth/MEarth)/(1.12 REarth/REarth)3 ρEarth = (1.02)/(1.12)3 ρEarth = 0.73 ρEarth
This agrees perfectly with the value reported in Figure 5.
Question 1
The exoplanet 51 Peg b has a radius that is 1.27 times greater than Jupiter's radius (R51P = 1.27 RJ) and a mass that is 0.46 (46%) the mass of Jupiter (M51Pb = 0.46 MJ). Find the density of 51 Peg b relative to Jupiter's density.
Show Answer
This can be solved exactly the same way as the example above (the only difference is that the mass and radius are now reported relative to Jupiter, rather than Earth).
[latex]\rho/\rho_{J} = (M/\frac{4}{3} \pi R^3)/(M_{J}/\frac{4}{3} \pi R_{J}^3) = (M/M_{J})/(R/R_{J})^3[/latex]
Putting in the values of the mass and radius for 51 Peg b, we find:
ρ51Pb = (0.46 MJup/MJup)/(1.27 RJup/RJup)3 ρJup = (0.46)/(1.27)3 ρJup = 0.22 ρJup
This tells us that 51 Peg b is a very light planet with a density that is just 22% the density of Jupiter. You can look up the density of Jupiter (ρJup = 1.3 g/cm3) and calculate the value for the density of 51 Peg b:
ρ51Pb = 0.22 ρJup = (0.22)×(1.3 g/cm3) = 0.29 g/cm3
Question 2
The exoplanet Kepler 22 b has a mass that is 9.1 times greater than Earth (MK22b = 9.1 ME) and a radius that is 0.19 (19%) the mass of Jupiter (RK22b = 0.19 RJ). Find the density of 51 Peg b relative to Earth's density.
Show Answer
For this problem, we are given the radius relative to Jupiter and the mass relative to Earth. We will need to convert the radius so that it is relative to Earth as well, so that a direct comparison can be made to the Earth's density.
Jupiter's radius is 11.2 times the radius of Earth: RJ = 11.2 RE. Using this conversion factor:
R22Kb = 0.19 RJ = 0.19×(11.2 RE) = 2.1 RE
The density relative to Earth is:
ρK22b = (9.1 MEarth/MEarth)/(2.1 REarth/REarth)3 ρEarth = (9.1)/(2.1)3 ρEarth = 0.98 ρEarth
Kepler 22 b has almost the same density as Earth so Kepler 22 b is also a rocky planet, with a density slightly less than 5.5 g/cm3.
Three of the seven planets orbiting TRAPPIST-1 are in the habitable zone -- the distance from TRAPPIST-1 where the temperature is just right for liquid water. If there are three habitable worlds around the TRAPPIST-1 star and if technological civilizations evolve on any of these planets, there will be a powerful incentive to build spaceships that travel to these neighboring worlds. All of the TRAPPIST-1 detected to date are either terrestrial or super-Earths. We know this based on both the mass and radii of the TRAPPIST-1 planets, which together allow us to find their densities. In Figure 5, we see that most of the TRAPPIST-1 planets have densities close to Earth, with TRAPPIST-1 d having a lower density at 62% the density of Earth (ρT1d = 0.62 ρEarth).

The orbits of the seven TRAPPIST-1 planets are close to resonance, meaning that the ratio of the orbital periods are close to integer values. Planet e is in a 6-day orbit and planet g is in a 12-day orbit; planet f is in a 9.2-day orbit and planet h is in an 18.7-day orbit.
TRAPPIST-1 System with JWST
Since its discovery, the TRAPPIST-1 system has been followed up with several different telescopes, including Spitzer, Kepler, Hubble and the James Webb Space Telescope. Hubble collected spectra for all seven exoplanetary transits in the TRAPPIST-1 system to study the compositions of any atmospheres that these planets may hold.
The mid-Infrared Instrument (MIRI) on JWST was used to find the temperature of TRAPPIST-1 b by measuring the brightness of TRAPPIST-1 when planet b was behind the star (this is called a secondary transit or an occultation). The temperature of TRAPPIST-1 b was found to be about 500 K and further analysis showed that it is unlikely that this exoplanet has an atmosphere (read more at https://exoplanets.nasa.gov/news/1756/webb-measures-the-temperature-of-a-trappist-1-exoplanet/). The data was fit to models for a planet with an atmosphere and without, and the observations were a better match to the model for a planet that is bare rock (with no atmosphere).
The NIRISS (Near-Infrared Imager and Slitless Spectrograph) instrument aboard JWST was also used to study TRAPPIST-1 b. The NIRISS results confirmed that there is little evidence that TRAPPIST-1 b has an atmosphere -- although it still cannot be ruled out -- but also found that contamination from the star TRAPPIST-1 can compromise the analysis of spectra[2]. M dwarfs like TRAPPIST-1 experience frequent flares of X-rays and other surface phenomenon, such as star spots and faculae, both of which are caused by magnetic fields. If a flare occurs during the measurement of the planet's spectrum, this can create "ghost lines" that could be misinterpreted as an actual chemical signature in the spectrum. This study underscores the importance of taking into account the effects of outbursts of radiation frm the host star, especially M dwarfs, which are the most plentiful type of star in our Galaxy.
Assessing Exoplanetary Habitability
With some basic properties of an exoplanet -- its mass, radius, semi-major axis and orbital period -- and its host star, a critical assessment can be made as to whether the exoplanet is habitable. In this section, we look at some of the key questions to ask in carrying out such an assessment.
Density
The density of a planet is important in understanding its composition and surface: this tells us if the world is a gas giant, a rocky planet or something in between. To find the density of an exoplanet, both its radius and mass are required. Some examples are shown above on how to carry out density calculations for exoplanets.
A good resource for finding the mass and radius of an exoplanet, reported relative to Earth or Jupiter, is NASA's Eyes on Exoplanets site: https://exoplanets.nasa.gov/eyes-on-exoplanets/
Once you know the approximate density of a planet (we say approximate here as the exact mass is usually not known, but instead the minimum mass found through the Doppler technique), you can then assess the surface properties by comparing to some benchmarks, such as the density of Earth and the density of Jupiter. Figure 7 below shows the densities for the planets in our solar system compared to those of exoplanets detected.
Surface Gravity
The surface gravity of a planet can give insight as to whether the world can hold onto an atmosphere. Without an atmosphere, life on any other world seems improbable. On Earth, the atmosphere keeps the surface temperature (relatively) stable and enables the Greenhouse effect; without our atmosphere, Earth would be a frozen ice planet.
The surface gravity of a world depends on its mass and radius as:
$$g = G\frac{M}{R^2}$$
An example of how to find the surface gravity of a world is shown here in the chapter on Laws of Motion and Gravity.
How much gravity at the surface is enough to retain an atmosphere? Atmospheric retention depends not only on the surface gravity but also the temperature. Gas molecules move faster in hot environments compared to cold ones.
Habitable Zone (liquid water?)
A key question to ask is whether or not the planet is in the habitable zone around its host star. The distance from the star to the edges of the habitable zone depend entirely on the parameters of the host star (and can be estimated using just the luminosity of the star, as shown in this example in the Habitable Zone chapter). With the inner and outer boundaries (that is, the distance from the star to the closest part of the HZ and the distance to the furthest part), the distance from the exoplanet to the star (its semi-major axis, a) can be compared to see if it falls within these boundaries. An example is shown in the box below.
Worked Example: Is a planet in the HZ around its star?
Using the luminosity of its host star, estimate whether the rocky exoplanet Kepler 452 b is in the habitable one around its host star.
First, a quick search* reveals that the luminosity of Kepler 452 (the star around which Kepler 452 b orbits) is about 1.2 times the luminosity of the Sun: LK452b = 1.2 LSun
Now, we can use the relationships for the inner/outer bounds of the conservative HZ:
[latex]d_{inner,star} = 0.95 \sqrt{L_{star}/L_{Sun}}[/latex] AU
[latex]d_{outer,star}= 1.37 \sqrt{L_{star}/L_{Sun}}[/latex] AU
Since LK452b = 1.2 LSun,
[latex]d_{inner} = 0.95 \sqrt{1.2}[/latex] AU = 1.04 AU
[latex]d_{outer} = 1.37 \sqrt{1.2}[/latex] AU = 1.50 AU
Next, let's compare these bounds with the average distance of Kepler 452 b from Kepler 452:
$a$ = 1.05 AU
Kepler 452 d is very close to the inner edge of the HZ around Kepler 452. Yes -- it is in the habitable zone.
Note that Kepler 452 has nearly the same luminosity as the Sun and the planet Kepler 452 is orbiting at about the same distance from Kepler 452 as the Earth does from the Sun. This is an intriguing example of an Earth-sized planet orbiting a Sun-like star...could Kepler 452 b have water on its surface?
*For a more precise estimate of the luminosity, look up the star on NASA's exoplanet archive. You can also estimate a star's luminosity relative to our Sun by using the Stefan-Boltzmann law, if you know its radius and temperature.
For a graphic image, you can use the HZ generator tool at http://astro.twam.info/hz/
Try it! Generate the HZ around TRAPPIST-1.
To start, open the HZ sim link and click on the "Multiple" tab. Remove Star B (by clicking on the red X next to it). Now you can input the values for TRAPPIST-1 -- note the units! You will need to adjust both the Plot Radius and the Resolution for the figure.
Go Deeper
Look back at the distances for each of the seven detected in exoplanets in the TRAPPIST-1 system. Which of these planets fall into the HZ around TRAPPIST-1, as shown in the figure above?
[Ans: c, d, e]
Tidal Locking
A world is tidally locked if the same side of it always faces the object that it orbits. The Moon, for example, is tidally locked to the Earth and we always see the same side of the Moon from Earth. It takes the Moon the same amount of time to make one rotation on its axis as it does to make one orbit around the Earth. Pluto and its moon Charon are also tidally locked.
Planets can be tidally locked to their host stars as well. This is a gravitational effect and depends on the mass of the star and the planet's distance to the star. Over time, the rotation (spin) of the planet is gravitationally synchronized with the orbit. Figure 8 below summarizes where the "tidal lock radius" line (to the left of this line a planet is tidally locked) for stars by their spectral type and the distance that a planet is from the star. Our solar system is shown for comparison. Mercury is shown to the left of the tidal lock radius line, and Mercury is in a 3:2 orbital resonance with the Sun (because it also experiences gravitational pulls from Venus, Mercury is not in a 1:1 orbital resonance, which is the case for tidal locking).
Concept Check: Tidally locked?
Using Figure 8, determine if the exoplanet Proxima b tidally locked around its host star Proxima Centauri.
To answer this using Figure 8, we need the mass of Proxima Centauri and the distance that Proxima b is from this star; these are (source):
MassProxCen = 0.12 MSun
aProxb = 0.0486 AU
Finding the intersection of these points on Figure 8, the exoplanet is close enough to be tidally locked. This figure also shows that Proxima b falls into the habitable zone around its star. The marked figure is shown below for clarity.
Biosignatures
How might we be able to tell if there is actually life on an exoplanet? Scientists search for signs of life by looking for telltale signatures.
It is apt to begin a discussion of biosignatures with the adage "Extraordinary claims require extraordinary evidence." As we look at some possible signatures of life, we cannot immediately conclude that the detection of just one biosignature means we have found other life in the universe. For any potential biosignature detected, absolutely all abiotic sources must be ruled out. False positives can be difficult to identify but an exceedingly critical analysis is in order.
A good place to start in pondering atmospheric biosignatures on other planets is to see what Earth's atmosphere looks like -- and what another civilization would see if they took a spectrum of the Earth. Figure 9 shows the spectrum of Earth's atmosphere at optical and near-IR wavelengths. The first thing that you may notice is water...and recall "Follow the water!". This is a sign of liquid water oceans on Earth, so we are indeed excited when H2O is detected in an exoplanetary atmosphere, but water vapor does not necessarily mean that there is water on the surface (Jupiter and Saturn have water vapor in their atmospheres).
Carbon dioxide is also a byproduct of life on Earth -- all animals exhale CO2 and CO2 is released when plants decay. But CO2 can also be produced though volcanic eruptions, and its concentration can be changed with anthropogenic (man-made) sources such as the burning of fossil fuels or deforestation. To further exemplify this point, Figure 10 shows the atmospheric profiles for Venus, Earth and Mars.
Mars, Earth and Venus all have CO2 in their atmospheres but only Earth shows water and ozone (which is related to O2). Let's take a deeper look at some potential biosignatures and their abiotic sources. As we'll see, oxygen alone or methane alone would not be a good biosignature, but the combination of oxygen and methane is a smoking gun for life. At the temperatures and pressures in the atmosphere of Earth, oxygen would react quickly with methane, producing carbon dioxide and water. The simultaneous existence of these elements on Earth occurs only because life is producing these elements and maintaining chemical disequilibrium.
Oxygen
Life on Earth keeps O2 in our atmosphere -- it is a byproduct of life on Earth. Ozone -- O3 -- is formed when an O2 molecule is broken apart and one of the single oxygen atoms combines with another O2 molecule. So, the presence of ozone is a proxy for O2. Of course, just O3 is not enough and a more compelling case would be made if both O3 and another biosignature were detected. For example, ozone and water in our atmosphere point to habitable conditions on the surface.
False negatives need to also be considered in addition to false positives. Just because an atmosphere does not show O2, this does not necessarily mean that there is no life. On Earth, cyanobacteria began putting O2 into our atmosphere perhaps as early as 3.8 billion years ago (stromatolites) but it would not have showed up in a spectrum because it would immediately react with other elements. On a similar note, if there was a very low level of O2, our instruments may not be sensitive enough to detect it. Finding unambiguous signs of life is a tricky game to play.
Methane
Methane (CH4) is another molecule that can be produced both biotic and abiotic sources. Methane is a natural byproduct of volcanic outgassing and, in our own solar system, the lifeless worlds Uranus and Neptune have methane in their lifeless atmospheres. Methane can also be produced geologically in hydrothermal vent communities through a process called serpentinization. Methane is created by life as a waste product. Some animal life, such as cows and sheep, produce methane through microbes in their stomaches. These ancient archaean microbes, called methanogens, take in H2 and CO2 and expel CH4 as waste. Like O2, CH4 will generally not stay in an atmosphere unless it is continuously replenished causing chemical disequilibrium. This is why the topic of methane in Mars' atmosphere often pops up in the news, as it could be interpreted as a sign of life (but, if the detection is real, is very likely due to permafrost evaporating at the Martian poles).
Methane on its own would not be a strong biosignature but if it was detected with O2 then a very strong case could be made for life, as this combination would be hard to create without photosynthesis.
Sulfur gases
Gaseous molecules containing sulfur are produced by both abiotic and biotic sources on the Earth. Simple sulfur gases such as SO2 and H2S are produced by metabolism but also are produced naturally though volcanic outgassing. A less ambiguous biotic signature is from more complex sulfur cases such as dimethyl sulfide (DMS) and dimethyl disulfide (DMDS). DMS on Earth is created mainly by marine phytoplankton and is also found in microbial mats.
The atmosphere of the exoplanet K2-18 b -- a Super-Earth orbiting in the habitable zone around its host star -- was recently studied by JSWT. When K2-18 b passed in front of its host star, K2-18, the infrared spectrograph on JWST collected the light from the planet and the star, and was able to separate out the atmosphere of just K2-18b, shown in Figure 11. DMS was detected but further studies will be needed to corroborate this detection.
Nitrous Oxide
Nitrous oxide (N2O) is detected in excess (chemical disequilibrium) in the Earth's atmosphere. It can be created from both abiotic and biotic sources. One biotic source is actually more of a technosignature -- the amount of N2O in our atmosphere has risen exponentially since the Industrial Revolution in 1750. It is a byproduct of agriculture and fossil fuel burning. It is also produced by bacteria that use nitrates in the soil and water to create N2O. Nitrous oxide can also be formed naturally by lightning, but the bulk of N2O in Earth's atmosphere is due to life.
If the detection of N2O is to be considered a biosignature, it must be considered along with other factors about the exoplanet and other gases that are found in its atmosphere.
Vegetation Red Edge
In addition to biosignatures gases in the atmosphere, a planet's surface can also reveal the presence of life. On Earth, the red edge is a property of chlorophyll in photosynthetic plants, which becomes abruptly reflective at infrared wavelengths as shown in Figure 4. At wavelengths above about 0.7 μm (700 nm, which is right at the edge between red visible light and infrared light), leaves will reflect sunlight and show a sharp increase in the amount of light reflected at this point.

The specific wavelength for the red edge on Earth is a consequence of the properties of the Sun and the intensity of its light at different wavelengths (the most intense light from the Sun being yellow-green). For an exoplanet orbiting an M star, the most intense radiation is in the infrared part of the electromagnetic spectrum, so the red edge could actually be some different color or perhaps a black edge, depending how vegetation responds to the different intensity of light. H.G. Wells considered this and wrote in The War of the Worlds in 1895: "The vegetable kingdom in Mars, instead of having green for a dominant colour, is of a vivid blood-red tint."
This reflectance property of chlorophyll also keeps plants from overheating, but is also integral to plants growing efficiently through a process called shade avoidance. Plants are capable of detecting a lack of infrared light and this triggers a response in plants that produces longer stems and larger leaves, which allows a plant to capture more sunlight.
Photosynthetic organisms were a critical step in the evolution of aerobic respiration in eukaryotes. Therefore, a similar detection in the atmospheres of other planets would be an intriguing clue for bio-activity. The red edge is a strong signal in the atmospheric spectra from Earth and an easy feature to search for in the atmospheres of other planets.
The image to the left shows an example of an exoplanet, Kepler-186f, that is Earth-sized and falls into the habitable zone around its host star. Kepler-186 is a cool, red dwarf star so any plants that grow there could adapt to their star's light in such a way that leaves have different colors that differ from those on Earth.
Key Concepts and Summary
Each of the observational detection methods for exoplanets is sensitive to a different range of masses and orbital separations between the host star and planet. In general, larger or more massive exoplanets around the nearest stars present the largest -- and therefore most easily detectable -- signals. Over the past decades, significant effort has gone into reducing instrumental errors and improving observing strategies with the goal of pressing measurement precision down to Earth-detecting sensitivities. The ensemble of exoplanets and exoplanet architectures reveal some differences from the solar system, however, there are still biases that prevent us from obtaining a full view of planetary systems around other stars. In the TRAPPIST-1 system, seven orbiting planets have been detected. These TRAPPIST-1 planets orbit close to the low mass host star and appear to be terrestrial, or rocky worlds. Recognizing that simple organisms were altering the atmosphere of Earth for billions of years before our radio telescopes appeared, astronomers can cast a wider net in the search for life by looking for the impact that life might have on the spectra of atmospheres of other planets - so called biosignatures. For example, the combination of strong oxygen markers together with methane is a signature of chemical disequilibrium on Earth that requires ongoing biological respiration.
Review Questions
Summary Questions
- What is a biosignature? Give some examples of Earth's biosignatures.
- How do SETI scientists search for biosignatures in planetary atmospheres?
Exercises
- Assessing the habitability of an exoplanet. Choose an exoplanet that you are interested in learning more about, especially the possibility of it hosting life. Begin by hypothesizing whether or not you think the exoplanet is habitable. Go through the four factors (density, surface gravity, habitable zone estimation, and tidal locking) in the Assessing Exoplanetary Habitability section above and discuss whether the evidence you found supports the hypothesis.
Radioactive Decay
The different ages of these rocks is determined by a process known as radiometric dating. First described in 1907 by Bertram Boltwood, this method is now widely used for dating specimens throughout geology and uses known properties of atomic physics. All the baryonic matter that we interact with every day is made up of protons, neutrons and electrons. Protons and neutron are made up of quarks and have three "valence" quarks (Figure 1 below). Quarks are elementary particles and, as such, cannot be broken down any further. They possess intrinsic properties (some of which include charge and mass) and transfer these properties to the hadrons they make up. Hadrons is simply the term for something composed of quarks. Hadrons come in two types: mesons, which consist of a quark and an anti-quark, and our familiar baryons, which consist of three quarks. Quarks are studied by analyzing the way hadrons interact. As far as we have been able to tell, the electron is an elementary particle itself that cannot be broken down any further.
Recall that atoms can exist as several different isotopes, which contain different numbers of neutrons in their nucleus. Not all nuclei are stable. Generally heavier isotopes with an unbalanced number of neutrons relative to protons will undergo radioactive decay. For example, all carbon atoms have 6 protons, but additional neutrons are possible: carbon-12 and carbon-13 are stable isotopes, but carbon-14 is an unstable isotope. The unstable isotopes (here, carbon-14) are the parent isotope and they spontaneously decay into a different element or isotope, known as the daughter isotope.
There are two different types of statistically predictable spontaneous decay. The first is known as alpha decay (Figure 2 below), so named because the process emits an alpha particle (two protons and two neutrons). Alpha decay can only occur with very large nuclei. The parent isotope is left with a reduction of four in atomic mass. The loss of two protons means that the parent isotope has been converted to a lighter element in the Periodic Table.
A second type of spontaneous decay is beta decay. The atomic mass (total number of protons + neutrons) remains the same, but the atomic number (number of protons) changes. A proton or neutron may change into the other by flipping the charge of one quark. These changes are possible because protons and neutrons are not elementary particles. With $\beta ^-$ decay, a neutron decays into a proton plus an electron (to maintain charge balance) and an electron antineutrino to carry away energy. This changes the atom to a heavier element (plus one proton). An example of $\beta ^-$ decay is the conversion of 14C (6 protons) to 14N (7 protons):
$^{14}_6C \rightarrow \ ^{14}_7 N + e^- + \nu_e$
With $\beta ^+$ decay, the proton becomes a neutron, absorbing an electron, and the atom is changed to a lighter element (minus one proton). And example of $\beta ^-$ decay is conversion of magnesium (12 protons) to sodium (11 protons):
$^{23}_{12} Mg \rightarrow ^{23}_{11}Na + e^+ + \nu_e$
It is impossible to say for sure when a decay event will happen, but we can categorize the rate at which a sample of atoms will decay. If we know the amount of parent and daughter isotope, then knowing the rate of decay allows us to solve for how much time it must have taken for the parent isotope to decay into that much daughter isotope. This rate is characterized by the half-life, or the amount of time it takes for half of the parent isotope to decay into the daughter isotope. Different elements are useful for dating different age ranges. The Table below lists information for common isotopes.
Half life
Imagine a bag of microwave popcorn kernels. We can think of the popcorn kernels as unstable parent isotopes. The process of popping will symbolically represent spontaneous radioactive decay and the resulting popped popcorn will be the daughter isotopes. Though it is impossible to say when a specific kernel of popcorn is going to pop, we know how long it takes for most of the kernels to pop. There exists a relationship between number of popped kernels and amount of time passed, known as the radioactive half life. If we know the rate at which an isotope decays, we can calculate the age of a specimen given the fraction of parent and daughter isotopes in the sample.
Rates of radioactive decay can be determined in a laboratory setting. It is known that radioactive decay is an exponential process given by:
$N(t) = N(t=0) e^{\frac{-y}{t_{mean}}}$
- where <span id="MathJax-Element-11-Frame" class="MathJax_SVG" style="margin: 0px;padding: 0px;border: 0px;font-style: normal;font-variant: inherit;font-weight: normal;font-size: 16px;line-height: normal;font-family: inherit;vertical-align: baseline;text-indent: 0px;text-align: left;text-transform: none;letter-spacing: normal;float: none;direction: ltr;max-width: none;max-height: none;min-width: 0px;min-height: 0px;position: relative" role="presentation" data-mathml="">$N(t)$ is the amount of the parent isotope that remains,
- <span id="MathJax-Element-12-Frame" class="MathJax_SVG" style="margin: 0px;padding: 0px;border: 0px;font-style: normal;font-variant: inherit;font-weight: normal;font-size: 16px;line-height: normal;font-family: inherit;vertical-align: baseline;text-indent: 0px;text-align: left;text-transform: none;letter-spacing: normal;float: none;direction: ltr;max-width: none;max-height: none;min-width: 0px;min-height: 0px;position: relative" role="presentation" data-mathml="">$N(t=0)$, or sometime also written $N_0$, is the initial amount the parent isotope that a sample started out with,
- <span id="MathJax-Element-14-Frame" class="MathJax_SVG" style="margin: 0px;padding: 0px;border: 0px;font-style: normal;font-variant: inherit;font-weight: normal;font-size: 16px;line-height: normal;font-family: inherit;vertical-align: baseline;text-indent: 0px;text-align: left;text-transform: none;letter-spacing: normal;float: none;direction: ltr;max-width: none;max-height: none;min-width: 0px;min-height: 0px;position: relative" role="presentation" data-mathml="">$t$ is the amount of time that has passed,
- and $t_{mean} = \sqrt{2} \times t_{half}$ is the half-life of the element in question.
Taking the natural logarithm of both sides of the equation above and solving for $t$, we get an equation for the amount of time that has passed:
$t = - \ln \left( \frac{N}{N_0} \right) \times \sqrt{2} \times t_{half}$
As an example, let us imagine a classroom of 150 students who exhibit some very radioactive behavior. At the beginning of class, all 150 students are awake and attentive. Though we certainly hope this is never the case, suppose the students are falling asleep at an exponential rate, similar to the way that radioactive isotopes decay. After thirty minutes, half of the students have already fallen asleep! How much time has passed when only 30 students, or 20%, remain awake?
Using the equation above for time, the number of "surviving" (i.e., awake - no students were harmed in this thought experiment) 30 students is $N$, the initial 150 awake students is $N_0$, and 30 minutes was the half-life, $t_{half}$. Because the half-life is in units of minutes, the answer will also be in minutes.
$t = - \ln \left( \frac{30}{150} \right) \times \sqrt{2} \ times 30 \approx 68$ minutes
So, an hour and 8 minutes into the class, only 30 students remain awake in this completely hypothetical classroom.
In the example above was a simple case of misbehaving students. When dating rocks, the use of many different radioactive isotopes gives even more information about the age of a specimen. The choice of isotopes depends largely on what is present in the rock sample and a sensible choice, given the relative half-lives of the different isotopes. Half-lives can range from fractions of a second to billions of billions of years. Elements with longer half-lives are more useful for dating older rocks. Isotopes with half-lives comparable to the age of the substance being dated are ideal.
Atomic elements can also be changed by fission, which splits massive atomic elements into less massive elements. Spontaneous fission releases substantial amounts of energy. Elements can also be changed by fusion of lighter elements to form heavier elements. As discussed before, this process takes place in the cores of stars where hydrogen undergoes nuclear fusion to form helium. This process requires the input of a substantial amount of energy.
Statistical uncertainty
The accuracy of radiometric dating can be hard to ensure because the method depends on knowing both how much of the parent isotope was initially present, and how much of the daughter product is the result of decay. It is possible that the daughter isotope will preferentially escape from a sample, or a contaminating source will add more of either the parent or the daughter isotope. Returning back to the fictitious classroom example, this would happen if different students left and entered the room during the class. Then, someone observing the room an hour after the start of class would be uncertain about how many students were initially in the room.
There are ways to improve accuracy. For example multiple samples can be analyzed from different locations in the same rock in case one area suffered contamination. It is also helpful to calculate the age using several different isotopes to check for consistent results. This offers some insurance against potential loss of daughter isotopes since contamination or loss of daughter isotopes should behave differently. Counting accuracy is improved when there is a relatively high concentration of both the parent and daughter isotope.
Even with the best laboratory practices, radiometric dating depends inherently on the type of rock. Rocks are classified into three groups. Igneous rocks are made from molten magma or lava that solidifies into rock. Sedimentary rocks are layered rocks formed when sand and silt collect on the surface or in bodies of water and cement together to form new rock. Metamorphic rocks form when rocks undergoes intense temperature and/or pressure and transform into a different type of rock altogether. Through various processes, different types of rocks can transform into one another, as depicted in Figure 4 below.
Sedimentary rocks and metamorphic rocks are not good for radiometric dating. Sedimentary rock is made up of a conglomeration of the particles eroded from different types and ages of rock. Metamorphic rock undergoes too much change. Radiometric dating is only secure for igneous rocks that remain stable. Even so, radiometric dating of igneous rocks gives only the time since they last melted. Radiometric data has helped date rocks that are billions of years old going back almost to almost 4 Gya. The age of the Earth can be determined by radiometric dating of meteorites, the unprocessed specimens of planet formation.
Mass Extinctions
Though organisms change and evolve, the most dramatic changes occur during mass extinction events, defined as a period of time when the rate of species going extinct is increasing with respect to the rate at which new species arise. Throughout the Phanerozoic era, there were 15 documented major extinction events. Five of these were major mass extinction events where more than half of all species on Earth at the time were lost.
Mass extinctions can be either gradual or sudden. The process of extinction follows five different phases:
- First is the extinction phase, which features a rapid decrease in biotic diversity.
- The second phase is the survival phase. Diversity is at a minimum here, but there is little further extinction. Organisms that survive past the second phase are known as the holdover taxa.
- Third is the rebound phase. Diversity begins to slowly increase again as ecosystems recover from the extinction event. The term progenitor taxa is used to describe species that have survived and now provide the evolutionary seeds for future organisms.
- The fourth phase, the expansion phase, is marked by a rapid increase in diversity due to the evolution of new species. The increase in diversity is helped in part by the opportunities and voids left by the many species lost during the first phase.
- The last phase, a recovery interval, is marked by a long period of environmental stability as diversity continues to rise. Disaster taxa describe species that proliferate most successfully following an extinction event. They are typically small and simple, hardy rather than complex and therefore capable of surviving extinction events.
Evidence for extinction events come from sweeping changes in the fossil records at different geological changes. However, fossils provide an incomplete and often confused record of past life. Roughly one third of organisms feature calcified parts that could be turned into fossils. The erosion of sedimentary rock may also obscure how old a fossil really is. Our understanding of mass extinctions is therefore inversely proportional to their age (older events have less certain evidence), and is proportional to the extent of the extinction. Extinction events that caused a greater loss in diversity are easier to categorize.
While mass extinction events threaten the very presence of life on Earth, they also lead to enhanced evolutionary diversity. It is important to understand these ubiquitous pressures on life, as similar events are likely to occur on every planet. If life is easily and regularly eliminated through frequent extinction events, then it may make finding surviving life in the Universe much harder.
The Ordovician-Silurian (O-S) Extinction
The Ordovician-Silurian (O-S) extinction, which occurred 450-440 Mya, describes two events that together resulted in the loss of nearly 70% of the worlds species at the time, making this the second-largest mass extinction event. The extinction event had a global effect and particularly affected marine life, where it is estimated that nearly 85% of species were lost.
The event was most likely caused through sudden climate changes. The timeline matches up with a shift in the then super-continent, Gondwana, into the south pole. As Gondwana passed over the south pole, it began to form ice caps across its surface. This shift also exposed more land, causing a drop in CO2 levels through weathering and cooling the planet.The cooling of the Earth led to the formation of glaciers, which locked up waters from the ocean. This, in turn, caused sea levels to drop, exposing and destroying shallow-water habitats along continental shelves. Evidence for glaciation during this time period has been found in the Sahara Desert. The combination of glaciation and cooling is thought to be the main causes of the O-S extinction.
The event ended when volcanic out-gassing of greenhouse gases increased the atmospheric temperatures enough to melt the glaciers and stabilize sea levels. The rebound phase of the O-S extinction resulted in increased biodiversity on the re-flooded continental shelves. However, recovery species in the ocean and land plants of the time were initially less complex.
The Late Devonian Extinction
At least 70% of all species were also lost during the Late Devonian extinction, which lasted from 375-360 Mya. There is some evidence that this extinction event was actually a series of seven,distinct extinction pulses. As with the O-S extinction, marine life was particularly hard hit.
The Late Devonian extinction is thought to have been caused by changes in the sea level, triggered by global cooling combined with acidification and oxygen depletion in the oceans similar to the O-S extinction, changing sea levels, or oceanic volcanism.
The rapid evolution of more complex plants from 30 cm up to 30 m during this period likely contributed to the oxygen depletion in the ocean. The increase in plant mass required the development of extended root and vascular systems in plants. These roots would have stabilized increasingly deeper layers of soil, causing a change in the chemical composition of which nutrients were run off into rivers, lakes, and eventually the ocean. This effect could have decreased the amount of oxygen in the oceans as well as reduced CO2 levels, which would have contributed to global cooling.
Less oxygen in oceans also caused organic matter to be better preserved, preventing organisms from decomposing and recycling their nutrients. Instead, many organisms formed into oil, which was absorbed by the porous reef rocks common in the area. These oil deposits remain a major source of oil in America today.
The End Permian Extinction
The End Permian extinction (or Permian-Triassic or P-T extinction) occurred about 252 mya and is the single largest mass extinction event ever recorded. It is nicknamed the "The Great Dying." Approximately 96% of all marine life was lost along with over 70% of land species, including everyone's favorite prehistoric creature, the trilobite.
The cause of such a large extinction was most likely the final stages of the break up of Pangea. The shifting of continents caused molten rock to be exposed and increased volcanic activity, releasing volatile carbon, methane, and SO2. The effect is actually quite similar to that of burning fossil fuels today. The Earth began to heat up under this new blanket of greenhouse gasses; it is thought that the temperature of the entire ocean increased by 2°C.
Warm ocean water transported heat to the poles, which in turn began to melt and release more greenhouse gases that had been frozen before. As the amount of CO2 increased in the atmosphere, it likewise began to dissolve and accumulate in the oceans, causing oceans to acidify. Furthermore, the warmer ocean water was unable to hold as much oxygen. The combination of increasing acidity and decreasing oxygen likely gave rise to the grievous destruction of marine life during the P-T extinction.
The End Triassic Extinction
The End Triassic extinction occurred 200 Mya, with 70-75% of all species becoming extinct. Most of the large amphibians common at the time were eliminated, and dinosaurs were left with little competition, allowing them to flourish in the following Jurassic period.
The end Triassic extinction event was sudden, lasting less than 10,000 years. Many causes have been proposed, but none are definitive. Gradual climate change can explain some of the observed properties of the extinction. An asteroid impact could also explain some of the properties of the extinction, but a crater of the appropriate size and age has yet to be found. The extinction may also have been caused by an unlucky sequence of volcanic eruptions increasing the release of carbon dioxide and sulfur and triggering climate change. Increased amounts of volcanic compounds can be found in the rock layers from this period.
The Cretaceous-Paleogene (K-T) Extinction
The Cretaceous-Paleogene (K-T) extinction occurred 66 Mya, and 75% of species became extinct, including all land-bound dinosaurs. Dinosaur fossils are only ever present before this time in the rock records. The extinction had a surprisingly variable impact, with dinosaurs being greatly affected while mammals and birds survived to ultimately become the predominate life forms on the planet.
The rock record from this time exhibits an unusual amount of iridium with gold, osmium, and platinum. These elements are relatively rare on Earth, but are commonly found in meteorites. The amounts of these rare metals could have been contained in an asteroid that was 10-15 km in diameter. The energy from such an asteroid would be equivalent to the force of 100 million hydrogen bombs. Other evidence includes shocked quartz and spherical rock droplets, which require both high temperatures and great pressure to form. Widespread soot deposits also suggest enormous fires across land masses.
The Chicxulub crater, buried beneath the Yucatán Peninsula in Mexico has both the appropriate age and size that are expected of the asteroid that could have caused the devastation seen during the P-T extinction event. The crater stretches 150 km across and is approximately 20 km deep.
Extinctions and Life
While mass extinctions are devastating, they do serve to encourage diversity. Had the dinosaurs not been eliminated 65 Mya, there may never have been such a successful emergence of mammals. The frequency of life in the Universe is a function of how often it arises, how often it survives, and how long it endures after evolving. In this way, the frequency and intensity of mass extinctions control the frequency of life. On Earth, there have been 15 major mass extinctions in the last 500 million years. Five of those 15 eliminated more than half of all species on the planet.
A Sixth Mass Extinction: The Anthropocene
The geological record contains information about the dramatic changes that have occurred on our planet. The lessons from the five known mass extinctions show that the impact to climate and life is greatest when change is more sudden.
During the middle to late Cretaceous period the overall temperature of the Earth increased by 5°C. However, this change took place slowly, over the course of millions of years. The warming is thought to have been caused by the steady release of greenhouse gases from volcanic eruptions. Because the rate was so slow, the oceans were able to absorb the greenhouse gases without causing significant acidification. As a result, most life was able to adapt or migrate and survive.
In contrast, during the Palocene-Eocene thermal maximum (PETM) temperatures rose by 0.025°C every 100 years. In just a few thousand years, the temperature had increased by 5°C. The warming was caused by a combination of volcanoes, methane release from the seafloor, and peat/coal fires. As heating progressed, the permafrost began to thaw, leading to the release of even more greenhouse gases. The oceans began to acidify, leading to the extinction of many organisms living on the seafloor.
Today, humans are exerting a pressure on the Earth system so extreme that it is triggering the start of a new geological epoch: the Anthropocene. Modern-day global warming appears to be occurring at a rate of 1-4°C per 100 years, orders of magnitude faster than the rate during the PETM. The Earth is expected to gain 2-10°C in the next 100 years. There have been times in the history of the Earth when there was as much - or perhaps more - carbon in the atmosphere. There has probably never been a time in the past 4.5 billion years when the rate of change of carbon in the atmosphere has been so rapid. We have pulled coal from the carboniferous period out of the ground and we are burning it to fuel our industrial revolution. Like it or not, our mark will be left in the geological record of out planet; the first stage of a mass extinction, a rapid decrease in biodiversity, has already started.
Side Note: Sixth Extinction
Since the industrial revolution, we have had a front-row seat to the sixth major mass extinction. Human activity has led to widespread habitat loss, climate change, pollution, and rising ocean acidity. Vertebrates are dying out at a rate estimate to be a hundred times faster than they would be without human interference. Amphibians that interact with polluted land and water are most impacted, with a current extinction rate tens of thousands times greater than the background extinction rate. Rising temperatures are threatening most species with changes that are now happening on the timescale of generations rather than thousands of millions of years as before.
The Energy Budget for Earth climate
An "airless Earth" will absorb higher energy photons from the Sun in the top 1-meter of soil and then re-radiate that energy back into space in the form of infrared radiation. The incoming energy comes from a 5500 K black body - the Sun - and an airless Earth would radiate as a blackbody with a temperature of about 253 K .
However, it is more difficult for the incoming solar energy to escape when the Earth has an atmosphere. Molecules with three atoms are particularly effective at absorbing the infrared radiation released from the surface of the Earth. The absorbed energy is transformed into energy for vibrating and bending the molecular bonds of these greenhouse gases. Ultimately, energy is re-emitted and adds heat into the atmosphere. The energy budget (incoming higher frequency solar energy and absorbed-released lower frequency energy) is summarized in the image below. Not all of what comes in is released again.
The solar flux above the Earth's atmosphere is 1360 Watts per square meter. However, only one hemisphere of the Earth faces the Sun. Furthermore, the surface of the Earth is curved not flat, so there is a geometric reduction, such that an average of 340 Watts per square meters is intercepted above the atmosphere over the entire surface of the Earth. Without greenhouse warming from the Earth's atmosphere, our planet would be a frozen world. The presence of methane, water, carbon dioxide, and other natural greenhouse gases transformed the Earth to a habitable world with oceans of liquid water.
Anthropogenic climate change
In 1896, the Swedish scientist Svante Arrhenius calculated that the burning of coal by humans would add carbon dioxide to the atmosphere causing a small amount of warming. This was a curiosity, but it was hard to imagine that the then-world population of 1.6 billion people would have much impact. By the 1930s, the precise monitoring of climate for military purposes provided data that showed that the global mean temperature on Earth was indeed rising. Some people speculated that changes in the solar irradiance would also affect the temperature of Earth. Whatever the underlying reason, by the 1960s scientists estimated that the planet would warm by a few degrees over the coming century. Even though the physical feedback was poorly understood, scientists in the 1980s agreed that increasing the amount of carbon dioxide would increase the temperature of our planet. Data from ancient ice cores showed that a doubling of carbon dioxide (CO2) was correlated with a 3 degree rise in the global average temperature. Climate research intensified. With faster computers, it is now possible to carry out sophisticated simulations of the effect of rising carbon dioxide on the temperature of Earth.
There are some effects of greenhouse gases outlined in the 2018 U.S. National Climate Report that are undisputed by scientists.
- The concentration of carbon dioxide (CO2) has increased from pre-industrial levels to 391 ppm in 2012 and is now rising at a rate of 1.8 ppm per year.
- The present level of CO2 is higher now than at any time in the last 15 million years. This information comes from paleoclimatic and geological evidence.
- Global mean temperature is about 1 degree C above pre-industrial levels and increasing.
- The oceans have also been warming; 90% of the excess heat from increased greenhouse gases is stored in the oceans.
- The loss of sea ice has tripled in the past 20 years.
- Sea levels have risen by about 20 centimeters around the world and are now increasing at a rate of about 3 cm per decade. Melting from the continents of Greenland and Antarctica could add another 15 cm by the end of the 21st century.
- There has been a tenfold increase in extreme heat waves since the 1950s.
The consequence of 2-4 degrees of warming
Projecting the risks forward in time, every degree of warming exacerbates the stress on our planet and on civilization. The greatest warming occurs over land, bringing extreme heat waves, widespread drought, and increasing fires and deforestation. The resulting large-scale displacement of populations threatens security and economic systems. The higher temperatures and flooding of low-lying delta areas reduce crop yields and increase malnutrition and disease. Increasing carbon dioxide results in acidification that threatens marine life and ecosystems. A large-scale loss of biodiversity is already occurring with the loss of ecosystems. The predictions are unacceptably dire if the global temperature increases by four degrees Celsius, as predicted for 2100 if we continue business as usual. Despite decades of warnings by climate scientists, we continue to miss our targets for reducing the use of the fossil fuels that are directly responsible for increasing greenhouse gases (carbon dioxide and methane).
The global climate data are unequivocal. We know what to do to mitigate climate change. But, this is a problem that we have to solve together. Will humanity answer this call to action?
To approach the subject of astrobiology – specifically, of exploring possibilities that other life exists beyond the Earth – it is worthwhile to ponder the size and age of the cosmos. In this grand scheme, when and where did life on Earth first appear? The moment when the first life appeared is not precisely known, but several lines of evidence provide compelling clues for the timing of the rise of life on Earth.
Learning Objectives
By the end of this chapter, you will be able to:
- Explain the idea of the "cosmic calendar" and the timing of key events for life
- Express small and large numbers using powers of ten
- Describe the range of sizes for objects in the universe
- Explain light units such as light years and light seconds
- Describe how parallax can be used to estimate the distance to an object
The Big Bang and the Expanding Universe
Hubble's Law
In 1929, Edwin Hubble published a now-famous paper in the Publications of the National Academy of Science titled, "A Relation between Distance and Radial Velocity in Extragalactic Nebulae.'' As mentioned in the previous chapter, this work showed that M31 and M33 were beyond the known boundaries of our galaxy. In this paper he included a Table of data (reproduced below) showing distances, r, and radial velocities, v, to a couple of dozen "extragalactic nebulae,'' objects that we now understand to be other galaxies.
The "radial'' velocity is the component of velocity along our line of sight to an object. We defer a discussion of how the galactic velocities were measured to the chapter on spectroscopy, but for now, trust us... measuring radial velocities of galaxies is bread-and-butter astronomy.

Hubble sorted the galaxies by distance and immediately noticed a correlation: the more distant galaxies generally had larger radial velocities than closer galaxies. It was also clear that most galaxies - especially those at large distances - are moving away from us (by convention, positive velocities recede from us and negative velocities approach us). A few scientists of the day had already predicted this result as a critical test for a Big Bang.
Hubble plotted up his data and derived the best-fit linear velocity-distance relation. There is some scatter in Hubble's diagram. Some of this was the result of errors in the data, particularly the distances to galaxies. However, our Milky Way is one of a few dozen galaxies in what we call the Local Group. Galaxies in clusters are gravitationally bound and have orbital velocities that are larger than velocities from the expansion of the universe. Some of the velocities of galaxies in the Local Group (like the Andromeda Galaxy) are directed toward us -- those galaxies have negative velocities. Hubble's law really applies only to distant galaxies beyond the Local Group.

The speed with which galaxies are moving apart is called the recession speed. Let's think about what this linear relation between distance and recession speed means. Imagine that Galaxy A is initially at a distance d, and Galaxy B is initially at a distance 2d. Now, let enough time pass so that Galaxy A is at a distance 2d. If the expansion of space is constant everywhere, then Galaxy B will have moved to a distance 4d in that same time interval. Speed is distance divided by time; since Galaxy B travels twice the distance of Galaxy A in the same time interval, it must be traveling at twice the speed. When the expansion of the universe is constant, distance is proportional to recession velocity.
Concept Check
Can you think of how it might be possible to deduce the age of the universe from Hubble's data?
At first glance, it is tempting to conclude that the universe is expanding away from us - that we are the center of the universe. In fact, there is nothing special about our place in the universe. From the perspective of observers in every galaxy, most other galaxies seem to be receding. Indeed, alien astronomers in other galaxies have probably already published these same results, showing the relation between the distance and velocity of other galaxies. Like Hubble, they will know that they are not at the center of the universe.
The linear relationship between distance and recession velocity in Hubble's diagram (above) is expressed by a simple equation:
$v = H_0 d$
The astute reader will immediately recognize this as the equation of a straight line: Here, H0 is the slope of the line and the y-intercept is zero. This equation says that the recession velocity of a galaxy is proportional to its distance. The constant of proportionality, H0, is called Hubble's constant. Mathematically, it is the slope of the line in the velocity-distance relation. The units of H0 are physically meaningful: they have units of speed per distance (typically, km/s per megaparsec, Mpc). Assuming that Hubble's constant is really constant (i.e., not changing over time), then once this value is determined, you can measure the velocity of a galaxy (with spectroscopy) to derive its distance. Galaxies with larger velocities are farther away. So, Equation 1 is a powerful way to estimate distances to other galaxies. But, keep in mind the chicken and egg problem - we had to measure velocities and distances for some galaxies to derive the Hubble relationship. Once that was done, we were able to lean on the linear model to find distances to other galaxies.

The Hubble constant tells us something rather surprising. The units of 1/H0, (or distance / velocity) are time, and this "time'' is none other than the age of the universe. It is incredible that we can calculate the slope of the line in Hubble's data and solve for the age of the universe. The only rookie mistake has to do with the units - make sure that the speed (distance per time - usually km/s) and distance (usually Mpc) are converted to the same units so that distance really cancels out. And then, you will want to convert to more useful units than seconds: years or billions of years.
So, to recap, Edwin Hubble measured distances to the nearest galaxies, proving that they were outside of the Milky Way. He measured the velocities of other galaxies and found a correlation between distance and recession speed, providing observational evidence that the universe is expanding, and yielding an estimate for the age of the universe. This work provided a resolution to Olbers' paradox: the universe is not infinitely old (we can calculate its age), and because it is expanding, the light from stars in the most distant galaxies has been redshifted out of the optical bandpass (a concept we will discuss more in later chapters). Hubble's work changed our perspective of our place in the universe, and astronomers honored his contributions by naming a space observatory after him: the Hubble Space Telescope (HST) has been a workhorse telescope for the community since the mid-1990's.
We started with a presentation of Edwin Hubble's observations of the expanding universe because it was intuitively easy to understand. However, the Belgian priest George Lemaitre deserves a lot of credit for pioneering modern cosmology. In 1927, two years before Hubble's famous paper, Lemaitre published a paper with the rather wordy title: "A homogeneous universe of constant mass and growing radius accounting for the radial velocity of extragalactic nebulae." We now know Lemaitre's model as "Hubble's law" but it was Lemaitre who worked out the theory of the expanding universe with pencil and paper, based on Einstein's theory of general relativity. He proposed that the recession velocity of galaxies (extragalactic nebulae) could be explained by this expansion, and he derived the first estimate for the rate of expansion, which is now known as the Hubble constant, H0. Lemaitre gets extra credit for persisting in the face of a harsh critic; Einstein himself reportedly told him: "Sir, your calculations are correct, but your physics is atrocious." In the 1930's the idea that the universe was expanding was an extraordinary claim, and it would require extraordinary evidence (to borrow a phrase from Carl Sagan) before this theory was accepted. This evidence is described in the supplementary chapter "An Expanding Universe."
Our Place in Time: The Cosmic Calendar
The universe emerged at the moment of the Big Bang, 13.8 billion years ago. This is our starting point for time. Key events since this moment, including the formation of our galaxy and our solar system, can be identified in a memorable way by compressing all of time into one calendar year. This idea for the “cosmic calendar” was first articulated by astronomer Carl Sagan. On this cosmic calendar (Figure 1), each month represents a little over a billion years. Each day covers a span of around 40 million years. The very first stars and galaxies form in late January, and our home galaxy, the Milky Way, forms in early March. Our solar system comes on the scene in early September, and the first life on Earth probably formed by mid- to late-September.
Life starts as very simple cells and gradually evolves into more, with the first multicellular life appearing in November, and the first plants on December 20th. Primates, including humans, appear on December 31. In fact, modern humans show up on December 31, at 11:52 PM, which is on the order of the real-time equivalent of hundreds of thousands of years ago. In the bottom panel of Figure 1, which zooms in on the last 60 seconds on December 31, we see that all of modern science, including the development of both the telescope and microscope in the 17th century, happen in the last second at 11:59 PM.

There are a few ways to think about this time frame. On one hand, technologically advanced humans on Earth are newcomers. Humans have been sending out radio waves for less than one cosmic second. However, considering that the first life to appear on Earth took only a few cosmic weeks to form, perhaps the initial formation of life on other worlds will be a relatively speedy process. When considering just how many planets there are in the cosmos, it is tempting to think that the odds of life existing on at least one other planet are good.
Our Place in Space
Space also emerged at the moment of the Big Bang, and it has been expanding ever since. Contemplating the size of the cosmos can seem mind-bending but we can ground ourselves by starting with some size comparisons of more familiar objects. When comparing the sizes of two objects, a good first step is to be clear as to what is being compared, as the word size can mean different things -- length and volume, for example, are do not measure the same thing. Here, let's compare the length of some different objects, where the length is the distance from one end to the other end. Of course not all objects are symmetric so you may need to be more specific about how you are defining length, depending on what is being compared. For example, bacteria come in different shapes, such as rods, spheres, and spirals. In specifying a bacterium’s size, you would need to be clear about the start and end points of the measurement. In astronomy, galaxies also come in different shapes – ellipsoids, spirals, and irregular shapes – so it is important to know which dimension (say left to right or top to bottom) the length is referring to.

Units of length are important to consider. Lengths and distances are one-dimensional measures and are expressed in units such as meters or miles. Of course, the length of any object can be expressed in any units: what's important is that the objects being compared have the same units. Let's compare the size of a grapefruit and a bacterium. The length of a typical grapefruit is around 10 inches, which is the same as 25.4 centimeters (cm), 0.254 meters (m), 0.000254 kilometers (km) or 0.000158 miles. These are all equivalent measures, and it is a matter of convenience when choosing units. When directly comparing two measurements, all that matters is that the units chosen for the grapefruit are the same as those for a bacterium. We know that bacteria are very small, and a typical size is reported in units of micrometers (μm), where the prefix micro indicates 0.000001 meters. So, we can compare a grapefruit and a bacterium using meters (m): a grapefruit is 0.254 m and a bacterium is 0.000001 m. Clearly, the grapefruit is larger than the bacterium, and we can find exactly how much larger by dividing the two sizes: (0.254 m)/(0.000001 m) = 254,000. Dividing the two sizes (or taking the ratio) shows that the grapefruit is 254,000 times larger than the bacterium. We could still use a way to simply our notation, as it's easy to accidentally leave off one of the zeroes in the size of the bacterium. That's where "powers of ten" notation becomes useful.
Powers of Ten
Scaling to the largest sizes we will consider, a galaxy is a vast collection of stars that are held together by gravity. The length of a typical spiral galaxy, like the Milky Way, is about 1,000,000,000,000,000,000,000 meters (m), or a billion trillion m. This is a huge number, with 21 zeros after the one (this length is called a sextillion meters). The number may seem more intuitive when expressed as one billion trillion, as billion and trillion are familiar values that show up in our daily life (for example, billionaires are often in the news, and although no trillionaires yet exist, we intuitively know how much money they would have). When writing these numbers the prefixes M and G are sometimes used, where M stands for a million or the prefix "Mega" and G for a billion or the prefix "Giga".

One additional way to express these number is by using powers of ten. A million expressed in powers of ten is 106, since there are 6 zeros. Similarly, the Milky Way’s size can be written as 1021 m. There is also a prefix for 1021, called zetta and abbreviated by a Z. The Milky Way’s size can be expressed as 1021 m, 1 Zm or 1 sextillion m. This link to the National Institute of Standards and Technology lists the common prefixes that we use. In this table, we see that a yoctosecond is a very small measure of time – it is a mere septillionth of a second or 10-24 s. We will make regular use of powers of ten notation in this course, as we will be dealing with immensely large and small numbers.
In the context of comparing such a wide range of phenomena as this subject warrants, a good first step is to estimate the order of magnitude of the scale of an object. The easiest way to do this is to write the measurement in scientific notation and consider only the exponent. Notice that we need to identify the units of measurement as well as the order of magnitude to avoid ambiguity.
To get a better feel for very large and very small numbers in nature, the following film, created by Charles and Ray Eames in the 1970s, explores the very largest and very smallest numbers using powers of ten. Note that since the creation of this film, scientific advances have aided in the more complete understanding of the largest and smallest scales so that we now have more exacting probes of the largest scales and the smallest scales shown in the film. Our maps of galaxy clusters and investigations to the observable limits of our universe have improved to the extent that we can accurately identify the distribution of millions of galaxies while our understanding of the standard model of particle physics has been confirmed down to the centers of atomic nuclei.
https://www.youtube.com/watch?v=0fKBhvDjuy0
Copyright © Eames Office, LLC. All rights reserved.
The smallest measurable sizes bring us inside the nucleus of an atom, where subatomic particles called protons, with a size of just 10-15 m, are found. On the largest scale, the size of the observable universe is estimated to be about 1026 m. These are such vastly different sizes it is hard to even imagine comparing them, but it can be done very simply. The question of “how many times larger” one object is compared to another object can be found by dividing the two numbers: 1026 m/10-15 m = 1041 (for a review on working with powers of ten and scientific notation, please see Appendix B). The answer tells us that the observable universe is 1041 times larger, or “41 powers of ten,” larger than a proton. This can also be stated by saying that the universe is 41 orders of magnitude larger than a proton.
This type of analysis is powerful. Compared to the entire size of an atom, the nucleus is about 10,000 times smaller (104, or 4 orders of magnitude). This tells us that an atom – the fundamental building block of matter – is mostly empty space. The universe, it turns out, is also filled with huge voids of empty space.
Concept Check: Exponential sizes
Storage devices come in different sizes, and a small flash drive might have 64 MB of space and a large drive could have 500 GB. The small flash drive has 64 million bytes of space, where a million is 1,000,000 – one with six zeros. The "M "in MB stands for the prefix Mega, meaning million, and "B" is the abbreviation for bytes. Note that G is the prefix Giga, meaning billion.
To compare the size of a 512 MB flash drive to a 64 MB flash drive, this can answered in one step by dividing the two sizes: 512 MB/64 MB = 8. The 512 MB is eight times larger than the 64 MB drive. To state it another way, you would need eight 64 MB drives to equal one 512 MB drive. Notice that the answer, eight, has no units (or, we say is “dimensionless”). This makes sense – since both sizes are in MB, we compared “apples to apples”.
If the question asked how many times larger a 512 GB drive is compared to a 64 MB drive, you would need to make the units agree before dividing the numbers. Do this!
Show Solution
There are a few different ways to approach this: you could convert from GB to MB, from MB to GB, or convert both units into B. Let's convert 512 GB into MB, so that both quantities will have the same units:
512 GB × (103 MB/1 GB) = 512×103 MB
Now, we can divide the two quantities since they are both in MB: (512,000 MB/64 MB) = 8000
It takes eight thousand 64 MB flash drives to equal one 512 GB drive.
If the conversion directly from GB to MB was not clear, we can do this in two steps:
512 GB × (109 B/1 GB) × (1 MB/106 B) = 512×109×10-6 B = 512×103 MB = 512,000 MB
Stars
The power of a star can be measured in Watts (W), just like light bulbs. The Sun's power output is 3.8×1026 W and the power of the star Arcturus is 6.5×1028 W.
(a) How many times more powerful is Arcturus than the Sun? (b) How many times less powerful is the Sun than Arcturus?
Show Answer
(a) We can simply divide the power of Arcturus by the power of the Sun to find this:
(6.5×1028 W)/(3.8×1026 W) = 171
(b) 0.0058 or (1/171)
Density
Another important measure in the context of life and other worlds is density. The density of a planet, for example, will be important in assessing whether that planet has a rocky surface, like Earth, or an entirely gassy composition, like Jupiter.
The density of an object tells us how much stuff fits into its available space. Or, to be more specific, how much mass fits into its volume. You cannot tell the density of an object just by its mass or just by its volume – you need to consider both quantities together. For example, two planets could have the exact same volume and have the same size and shape in a picture, but their densities depend on what kind of matter is inside. A tennis ball and a billiard ball have roughly the same volume, but the tennis ball is filled with air and is much less dense than a billiard ball of the same size. By definition, the density ($\rho$) of an object is found by dividing its mass by its volume and is often reported in units of g/cm3 (since mass can be measured in grams and volume is three-dimensional and is measured in cubic units, such as cm3): $$\rho = \frac{M}{V}$$
Table 1 lists some common densities:
| Substance | Density | Astronomical Object | Density |
| hydrogen | 0.00009 g/cm3 | Earth | 5.5 g/cm3 |
| air | 0.001 g/cm3 = 1 kg/m3 | Sun | 1.4 g/cm3 |
| water | 1 g/cm3 | Saturn | 0.7 g/cm3 |
| iron | 8 g/cm3 | white dwarf | 700,000 g/cm3 |
| lead | 11 g/cm3 | neutron star | 7 × 10¹⁴ g/cm3 |
| gold | 19 g/cm3 | Universe | 9 × 10-30 g/cm3 |
Concept Check: Density
(a) Looking at Table 1, how many times more dense is a neutron star compared to the planet Saturn?
(b) Of the elements shown in Table 1, gold has the highest density. Is gold the heaviest element? Look this up!
(c) Which object has a higher density (or do they have the same density): a 1 milligram piece of gold or a 50 milligam piece of gold?
Show Answer
(a) 1015 or 1 quadrillion
To find how many more times dense a neutron star is compared to Saturn, take the ratio of the two densities:
(density of neutron star)/(density of Saturn) = (7 × 10¹⁴ g/cm3)/(0.7 g/cm3) = 1015
(b) osmium is the densest element
(c) They have the same density! Density is an intrinsic property of an element and doesn't change with the size of the piece.
Light Units and Speed
To explore the chemistry and possible biology of other worlds, ideally we would send humans there to run experiments. Humans have been to the Moon to collect rocks, and there are currently several rovers that are controlled from Earth analyzing rocks and soil on the surface of Mars. There are plans to send humans to Mars in the next decade or two. Why not send humans sooner? There turn out to be many challenges to physically traveling beyond the Earth, but the distances involved are foremost.
We are familiar with long distances on Earth. The distance from NYC to Sydney, Australia is about 10,000 miles (16,000 km) and a typical jet flies at a speed of 575 mph, so this flight takes over 17 hours. How about the distance from Earth to the Moon or Mars? The Moon is around 240,000 miles (384,000 km) away and Mars is over 200 million miles from Earth. In 2020, the Perseverance spacecraft travelled at 24,600 mph to Mars and still took about 7 months to get there. The amount of time it takes to travel somewhere is the distance divided by the speed you are traveling, or:
time = (distance)/(speed)
If you are traveling to a place 30 miles away at a steady speed of 60 mph, then it takes you (30 miles)/(60 mph) = 0.5 hour to get there.
Concept Check: Distances, speed and time
If it takes 18 days for a rover moving at a steady speed to travel a distance of 6 km, how fast was the rover moving?
Show Answer
speed = (distance)/(time)
speed =(6 km)/(18 hours) = 1/3 km/hr = 0.33 km/hr
In fact, this is the maximum speed that the Perseverance rover can reach.
Perhaps you can just travel at faster speeds to get someplace far, like Mars, more quickly? While this idea works well for speeds on Earth (and hence we have supersonic jets and bullet trains), there is a limit to how fast anything can travel. This cosmic speed limit is called the speed of light, and nothing can travel faster. In fact, only light, which has no mass, can travel at the speed of light; any object with mass can never reach this speed due to the effects of Einstein’s theory of special relativity. So, the fastest possible way to reach a distant world is to send light. This may not seem very helpful at first, but light can contain information – think about radio or TV signals – so this is a potential way to send communications to distant worlds.
How long would light take to reach Mars? The speed of light, which is denoted by the symbol c, can be expressed in any units, such as km/hr, mph, or feet/s. Two common choices are m/s and km/s:
c = 300,000 km/s = 3×10⁵ km/s = 3×10⁸ m/s
(For comparison, a variety of speeds that we may encounter in astrobiology are listed in Table 2.) The distance to Mars when it is closest to the Earth is 55 million km. Using the simple relationship for time, distance, and speed, we arrive at an answer of 183 seconds. That’s fast – only about 3 minutes! And definitely faster than the 7 months the Perseverance spacecraft took. This way of thinking about distances, times, and the speed of light is so useful, in fact, that astronomers often use light units to express distances. The Sun is 93 million miles away from Earth. If we do the same calculation for how long light from the Sun takes to reach us on Earth, it is 8 minutes. That’s about three times as long as light takes to get to and from Mars. We can now express the distances d to the Sun and Mars, in light units: dSun = 8 light minutes and dMars = 3 light minutes
| Scenario | Speed | Scenario | Speed |
| Drift speed of the continents | 3 × 10⁻⁹ m/s | Orbital speed of the Earth around the Sun | 30 km/s |
| Growth speed of human hair | 5 × 10⁻⁹ m/s | Escape speed from the Solar System (at the distance of Earth) | 40 km/s |
| Automobile | 100 km/hour = 28 m/s | Fastest human-made object | 110 km/s |
| Rotational speed of the Earth at the Equator | 1700 km/hour = 480 m/s | Orbital speed of the Sun around the Galaxy | 220 km/s |
| Orbital speed in low-Earth orbit | 8 km/s | Escape speed from the Galaxy (at the location of the Sun) | 310 km/s |
| Escape speed at Earth's surface | 11 km/s | Speed of light = c | 3 × 10⁵ km/s |
Worked Example: Light Units
Show that 1 light year is equal to 9.46 trillion km.
Recall that a light year is the distance that light travels in 1 year. We can use the relationship between time, distance and speed, along with unit conversions, to show this.
distance = (speed)×(time)
Here, we know the speed--the speed of light--and can express it in any units...let's use km/s, since the answer is in units of km. In the equation below, we use 3×10⁵ km/s for the speed. For the time, we use 1 year and convert this to seconds.
distance = (3×10⁵ km/s)×(1 year)
distance = (3×10⁵ km/s)×(1 year)×(365 days/1 yr)×(24 hours/1 day)×(60 min/1 hr)×(60 sec/1 min) = 9.46×10¹² km
This is equal to 9.46 trillion km.
How long does it take light from the Sun to reach Saturn, in minutes?
Start with the average distance from the Sun to Saturn in km, which is 1.4 billion km.
Show Answer
Light from the Sun is traveling at the speed of light, or 3×10⁵ km/s.
time = (distance)/(speed) = (1.4×10⁹ km)/(3×105 km/s) = 4,667 seconds
(4667 sec)(1 min/60 sec) = 78 minutes
We can thus say that Saturn is 78 light minutes away from the Sun.
How about the closest star to the Sun? That’s a red star named Proxima Centauri, and it is staggering 40,208,000,000,000 km (40 trillion km or 4×10¹³ km) away. In light units, however, this distance is 4 light years. It takes light 4 years to reach Proxima Centauri. The distances in light units to some nearby astronomical objects are shown in Figure 4. Light units are very convenient for expressing distances to stars that have intriguing planets orbiting them, as this tells us how long a radio signal would take to arrive at the star system. Also, light units remind us that we have a way of looking into the past! Notice in Figure 4 that the Andromeda galaxy is 2.5 million light years away. This means that light from Andromeda takes 2.5 million years to reach us, and that consequently we are seeing Andromeda as it looked 2.5 million years ago. This gives astronomers a way to see how the oldest galaxies in the universe, that are more than 13 billion light years away, looked when they were very young!

Concept Check: Distances
In Figure 4, the distance of 12 light minutes from Earth to Mars is actually the average, as the distance from Earth to Mars varies from 3 light minutes to 22 light minutes (at the furthest distance, it is on the opposite side of the Sun compared to Earth). When Mars and the Earth are at their closest distance, how long does it take light from the Sun to reach Mars?
It may help to make a sketch of the alignment of the Sun, Mars and Earth when Mars and Earth are closest to each other.
Show Sketch and Answer

The left panel shows the alignment of the Sun, Earth, and Mars when Mars is closest to the Earth. The time for sunlight to reach the Earth is 8 light minutes and the time for light to travel from Earth to Mars is 3 light minutes at closest approach. Thus, the total time is 8 light min + 3 light min = 11 light min
Other units of distance in astronomy
If you look up the distance to an astronomical object, the units will vary. For example, the distance to the star Vega might be reported in light years or parsecs -- it is 25 light years away which is the same as 7.8 parsecs. The Oort cloud surrounding our solar system is 50,000 AU away. Let's introduce these units as well.
Astronomical Units
When reporting distances within solar systems, astronomical units (AU) are typically used. One AU is defined to be the average distance from the Earth to the Sun. Mercury and Venus are closer to the Sun than the Earth and thus have distances in AU that are less than 1 AU. Saturn is at about 10 AU from the Sun and Neptune is at 30 AU.
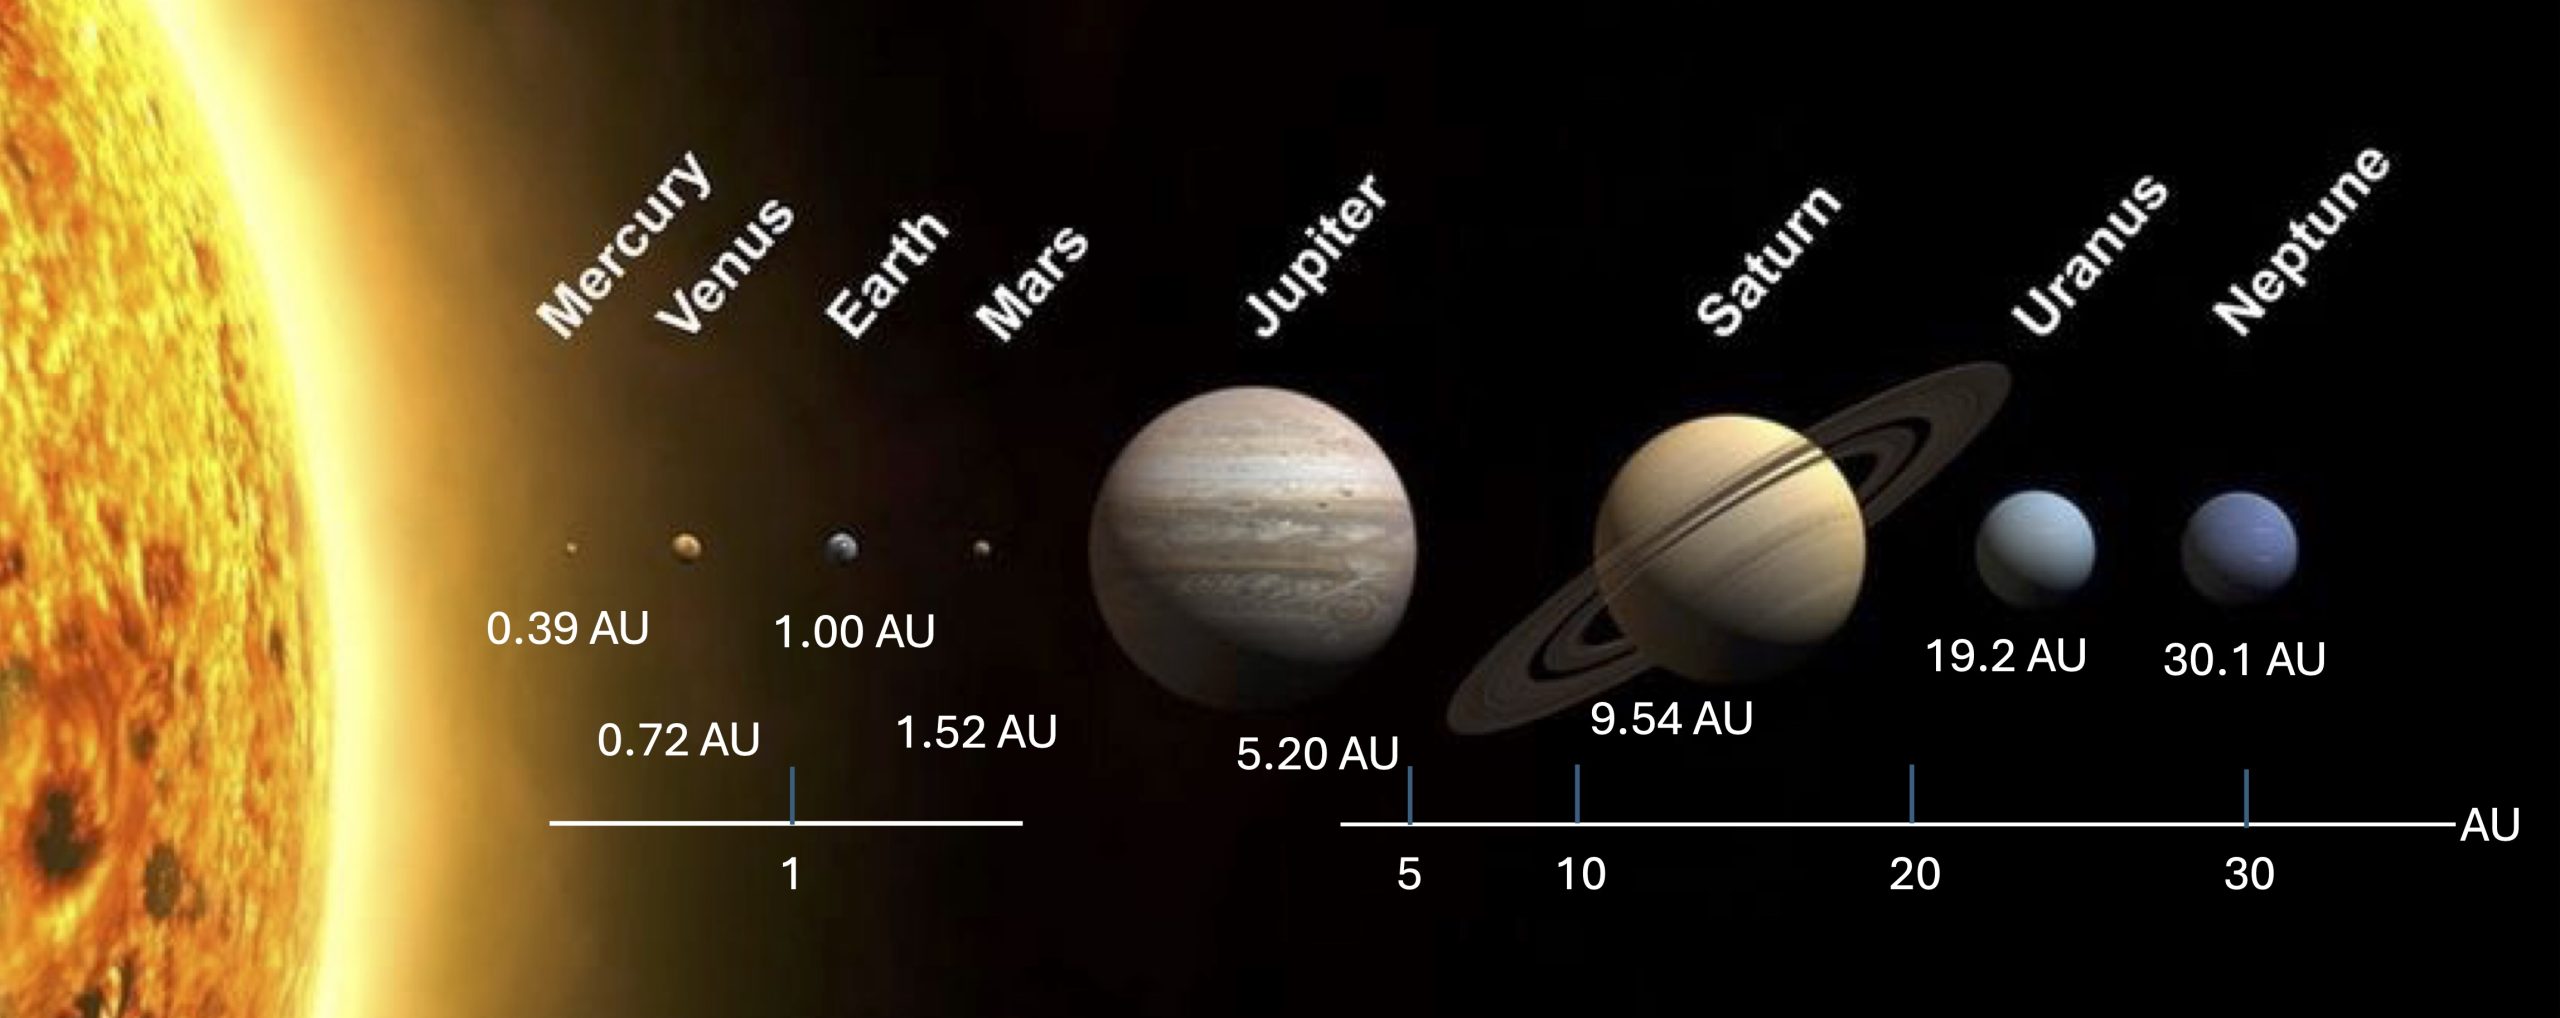
When you read about the distance of an exoplanet from its host star, these are also reported in AU and have the exact same meaning as in our solar system. The exoplanet Proxima b orbits the red star Proxima Centauri, and Proxima b is an average distance of 0.0485 AU away from Proxima Centauri. This means Proxima b is very close to its star: it is nearly 2 orders of magnitude closer to Proxima Centauri than the Earth is from the Sun.
Parsecs
Parsecs (abbreviated pc) and light years have similar values:
1 pc = 3.26 light years
It is usually a matter of context in deciding which units to use although it is usually more intuitive for students to use light units.
The word parsec is a portmanteau of the words "parallax" and "arcsecond" and is defined as "the distance at which we have a parallax of one second." Parallax is an angular measure, meaning it has units of degrees or radians (or arcminutes and arcseconds). The apparent shift in the direction of an object as a result of the motion of the observer is called parallax. We call the shift in the apparent direction of a star due to Earth’s orbital motion stellar parallax. The Greeks made dedicated efforts to observe stellar parallax, even enlisting the aid of Greek soldiers with the clearest vision, but to no avail. The brighter (and presumably nearer) stars just did not seem to shift as the Greeks observed them in the spring and then again in the fall (when Earth is on the opposite side of the Sun). In reality, stellar parallax angles were too small to measure with scientific instruments until the 19th century.
Concept Check: Angular Units
The basis for angular units is that there are 360° or 2$\pi$ radians in a full circle. Arcseconds and arcminutes are simply divisions of a degree into smaller units, where 1 degree contains 60 arcminutes (abbreviated as 60$'$) and 1 arcminute contains 60 arcseconds (abbreviated as 60$''$).

The best way to visualize parallax angles is to hold up something like a pencil at a distance of just a few inches from your nose. Now, hold up another pencil at the greatest distance that you can reach (as demonstrated below). If you wink your eyes (left then right), you'll see that the pencil that is closest to your face appears to have a much larger shift (right to left) than the distant pencil.

We use the same principle to measure distances to stars. Stars that are close to us will have larger parallaxes than more distant stars. Winking our eyes won't work for this measurement because the baseline (the distance between our eyes) is too small. Instead, we use the baseline of the Earth's orbit to see apparent position of the foreground stars jump relative to the background stars.

The parallax angle is abbreviated as p . It can be shown using simple trigonometry that the distance to a star is inversely proportional to its parallax angle:
$$d = \frac{1}{p}$$
where $p$ is reported in arcseconds and $d$ is given in parsecs.
Key Concepts and Summary
The scale of space and time in the universe is so enormous that we need strategies to organize a basic understanding of where and when. The cosmic calendar re-scales the 13.8 billion year age of the universe into a "cosmic year", effectively capturing the timing for the rise of life and the very recent appearance of modern humans. The exponential spatial scale of the universe is captured as powers of ten, to compare the smallest and largest sizes and distances. A common unit for distances is light travel time: light could travel the circumference of the Earth seven times in just one second. It takes light 8 minutes to travel from the Sun to the Earth; 4.3 years to travel from Earth to the nearest star system, alpha Centauri, and 2.5 million years to travel to the closest spiral galaxy, Andromeda. Another important distance scale in astronomy is the distance from the Sun to the Earth: 1 Astronomical Unit or 1 AU. As we look out into the universe, determining the distances to other stars is accomplished with high school level trigonometry: measuring the shift of foreground stars relative to more distant stars.
Review Questions
Summary Questions
- How does the "cosmic calendar" help in understanding when key events happened for the development of life on Earth?
- How do you compare the size (or any property) of two objects using powers of ten?
- How does the smallest size we can observe compare with the largest size? Give an example of two objects that vary by 8 orders of magnitude. How about 17 orders of magnitude?
- What are light units? Why is it convenient for astronomers to use light units when expressing distances?
- How many light years are there in 1 parsec? Describe the unit parsec and why it is named the way it is.
- How can parallax be used to estimate the distance to an object?
Exercises
- Using the speed in Table 2, how long will your hair grow in one month?
- The Voyager 1 spacecraft is traveling at a speed of 38,000 miles per hour (17 km/s). Express this speed in light years per second (ly/s). How long would it take Voyager 1 to reach the closest star to the Sun, Proxima Centauri, which is 4.3 light years away?
- There are some additional exercises using powers of ten and scientific notation here (with solutions).
Much of astrobiology is motivated by a desire to understand the origin of things: to find at least partial answers to age-old questions of where the universe, the Sun, planets, the first life on Earth, and we ourselves came from. On Earth, chemicals on the early surface at some point made the transition from non-living to living -- the process of abiogenesis. We can take a step back and ask how the solar system formed and why the terrestrial and jovian planets ended up with their initial compositions. Then we can see if the model for how our solar system formed can describe exoplanetary systems as well.
Learning Objectives
By the end of this chapter, you will be able to:
- Explain how stars are formed in giant molecular clouds.
- List the main properties of the planets in our solar system.
- Describe the main steps in forming the solar nebula.
- Discuss how the solar nebula theory explains all of the properties observed in our solar system
- Discuss evidence that supports the nebular theory for forming solar systems.
Star Formation
At the heart of our solar system is a star. Stars of any type can host a planetary system and the most common type of stars in our galaxy are small, cool red dwarfs. The ultimate fate of a star, from birth to death, are determined by its initial mass. Where does this mass of material that forms a star come from? The answer is from huge clouds of gas and dust called Giant Molecular Clouds (GMCs).
Spiral galaxies like the Milky Way contain about 1000 GMCs, most located in the spiral arms of the galaxy. GMCs are among the largest objects in galaxies, with physical dimensions spanning 10 light years up to 1,000 light years. GMCs are cold enough for molecules to remain stable and are made of hydrogen (mostly H2), helium and other molecules as well as dust particles made of carbon, iron and silicates. All of the main building blocks for life -- carbon, hydrogen, oxygen and nitrogen (CHONs) -- were present in the cloud that collapsed to form our solar system. Ultimately, this concentration of gas and dust collapses to form hundreds of thousands of new stars and planets.
Side Note. Roughly half of the stars in our galaxy emerge from a GMC gravitationally bound to another star. Such stars are called "binary" stars and they can have orbital periods as short as an hour or as long as thousands of years. The O and B type stars are exceedingly rare. However, roughly 75% of these massive stars are gravitationally bound in binary star systems. In contrast, about 60% of stars like our Sun have a gravitationally-bound stellar buddy and fewer than 40% of the smallest stars - the low mass M dwarfs - have binary stellar companions.
A GMC is stable when the force of gravity, which tries to collapse the cloud, is balanced by the pressure from random motions of molecules in the cloud. Gravity is a force that pulls objects together and only depends on the mass of the objects and how far away from each other they are; the closer the objects, the stronger the gravity. A shock wave from a nearby star exploding as a supernova or some other event that compresses the density of the cloud can cause the cloud to collapse and fragment into smaller clumps. These smaller clumps are the seeds of solar systems, and it is the mass of these individual clumps that determines the fate of the star that forms at its center.
As a clump contracts, the density and the collision rate between particles increases so that the core of the cloud begins to heat up. At this point, the core of the cloud is a protostar with a temperature of a few thousand degrees, embedded in an obscuring shroud of cooler gas. As the clump contracts, it spins up and flattens and the object becomes a protoplanetary disk, or proplyd.
Want to know more - star formation in spiral arms of the Milky Way
It is interesting to map out the location of star formation. Stars are distributed nearly uniformly in the disks of spiral galaxies, but you would never know it looking at the composite image of the Whirlpool galaxy. The bright spiral arms are regions of enhanced density where new star formation is triggered. Because the massive stars are the most luminous, they light up the arms during their relatively short lives and are never seen far from the molecular clouds. The youngest stars are born in clusters located along the spiral arms of the galaxy and the giant molecular clouds are seen as dark dust lanes along the trailing edge of the spiral arms. The spiral density waves that cause turbulence and large scale coherent structure are observed only in flattened galaxies but the forcing mechanism that causes the spiral density waves is complicated and still controversial.
The Whirlpool Galaxy presents a view of dust lanes and massive stars tracing out spiral arms. Would you guess that there are more stars along the spiral arms? If so, you would be wrong... so what is going on? The spiral structure is a region of higher gas density, where bright, young stars are forming.
Density
A key measurement in the context of the solar systems, and life and other worlds more generally, is density. The density of a planet, for example, is important in assessing whether that planet has a rocky surface, like Earth, or an entirely gassy composition, like Jupiter.
The density of an object tells us how much stuff fits into its available space. Or, to be more specific, how much mass fits into its volume. You cannot tell the density of an object just by its mass or just by its volume – you need to consider both quantities together. For example, two planets could have the exact same volume and have the same size and shape in a picture, but their densities depend on what kind of matter is inside. A tennis ball and a billiard ball have roughly the same volume, but the tennis ball is filled with air and is much less dense than a billiard ball of the same size. By definition, the density ($\rho$) of an object is found by dividing its mass by its volume and is often reported in units of g/cm3 (since mass can be measured in grams and volume is three-dimensional and is measured in cubic units, such as cm3): $$\rho = \frac{M}{V}$$
Table 1 lists some common densities:
| Substance | Density | Astronomical Object | Density |
| hydrogen | 0.00009 g/cm3 | Earth | 5.5 g/cm3 |
| air | 0.001 g/cm3 = 1 kg/m3 | Sun | 1.4 g/cm3 |
| water | 1 g/cm3 | Saturn | 0.7 g/cm3 |
| iron | 8 g/cm3 | white dwarf | 700,000 g/cm3 |
| lead | 11 g/cm3 | neutron star | 7 × 10¹⁴ g/cm3 |
| gold | 19 g/cm3 | Universe | 9 × 10-30 g/cm3 |
Concept Check: Density
(a) Looking at Table 1, how many times more dense is a neutron star compared to the planet Saturn?
(b) Of the elements shown in Table 1, gold has the highest density. Is gold the heaviest element? Look this up!
(c) Which object has a higher density (or do they have the same density): a 1 milligram piece of gold or a 50 milligam piece of gold?
Show Answer
(a) 1015 or 1 quadrillion
To find how many more times dense a neutron star is compared to Saturn, take the ratio of the two densities:
(density of neutron star)/(density of Saturn) = (7 × 10¹⁴ g/cm3)/(0.7 g/cm3) = 1015
(b) osmium is the densest element
(c) They have the same density! Density is an intrinsic property of an element and doesn't change with the size of the piece.
Solar System Observations
Any theory of solar system formation must be able to explain all of the properties of existing solar systems. This includes not only our solar system but the properties of exoplanetary systems in our galaxy. We will stay focused on first explaining the properties of our own solar system, via the solar nebula model. The video below was made when astronomers had only detected about 500 exoplanets (now there are more than 5000) and summarizes the properties of objects in our solar system.
Video credit: @NatGeo
https://youtu.be/libKVRa01L8?feature=shared
After watching the video clip above or doing some research, make a list of similarities in the properties of the planets in our solar system. For example, do all planets orbit around the Sun in the same direction?
Now list any unusual patterns that you observe. Are comets and asteroids found at random distances or in specific locations?
Show Answer
- There are two types of planets: small, rocky planets (terrestrial) and large gas giants (jovians)
- Terrestrial planets are located in the inner part of the solar system; jovian planets in the outer part of the solar system
- Terrestrials are denser than jovians
- All of the planets revolve around the Sun in the same direction and the rotation ("spin") of the Sun has the same direction as the orbital revolution of planets.
- The orbital planes of the planets are inclined by only a few degrees with respect to each other. In other words, planets all revolve around the Sun in approximately the plane of the Sun’s own rotation.
- All planets rotate on their axes with different tilts
- The solar system contains large numbers of asteroids and comets that are at specific distances
- All jovian planets have moons and rings; no terrestrial planets have rings and only Earth and Mars have moons.
We can organize the properties into three main categories: motion constraints, size and chemical constraints, and distance constraints. We call them constraints because they place restrictions on our theories; unless a theory can explain the observed facts, it will not survive in the competitive marketplace of ideas that characterizes the endeavor of science. Let’s take a look at these constraints one by one.
There are many regularities to the motions in the solar system. All eight planets revolve around the Sun in the same direction and approximately in the plane of the Sun’s own rotation (the blue orbits in Figure 3). If looking down at the solar system from a vantage point above it, this direction is counterclockwise. With the exception of the comets and other objects orbiting beyond Neptune, such as dwarf planets, the motions of the system members define a flattened disk or pancake shape.
Side Note: Pluto was reclassified from a planet to a dwarf planet in 2006. The reason for Pluto's "demotion" is that it has not cleared the neighborhood around its orbit, meaning it is orbiting the Sun with a lot of other material in the Kuiper Belt.
Most of the planets rotate in the same direction as they revolve, with the exception of Venus which rotates clockwise. Some planets have no tilt to their rotation axes while other are tilted at seemingly random angles: the Earth's axis is tilted by 23.5°, for example. Figure 4 summarizes the different tilts.
There are two main types of planets: rocky terrestrials (Mercury, Venus, Earth and Mars) and gas giants (Jupiter, Saturn, Uranus and Neptune). The terrestrials are smaller in both mass and radius than the jovians. By chemical constraints, we mean that the different types of objects in the solar system -- terrestrial planets, jovian planets, asteroids, and comets -- all have different chemical compositions. The four terrestrial planets are rocky worlds with a solid crust made of rocks containing mostly silicate minerals (e.g., granite and slate). Although the jovian planets have rocky cores, they are vastly dominated by the very light gases hydrogen (H) and helium (He). These chemical differences are reflected in the relatively high densities of the terrestrial planets compared with the jovians. There are sub-trends within the trends as well that need to be explained. For example, the Moon and Earth have some similarities in their chemical compositions but some differences, too.
The terrestrial and jovian planets are at different locations in the solar system: the terrestrial planets are in the inner solar system while the jovians are in the outer solar system. In general, asteroids are found in a belt in between Mars and Jupiter, and comets are found out past Neptune in the Kuiper Belt.
In the next section, we describe the solar nebular theory for how our solar system formed, and explain how each of the constraints described above are successfully explained by this theory.
The Solar Nebula Model
The cloud of gas and dust that collapsed to became our solar system is called the solar nebula. Our solar system was formed from this cloud beginning 4.6 billion years ago. The figure below shows an artist's sketch of material in the solar nebula orbiting the protosun: many collisions occurred during this time and eventually material clumped together into larger objects: gas and dust grains stick together via first electrostatic forces and then gravity to form clumps, these clumps accrete more material through their increased gravitational pull and become planetesimals, and these planetesimals further grew to become protoplanets and eventually planets.
As the solar nebula collapsed under its own gravity, material fell toward the center, where things became more and more concentrated and hot. Increasing temperatures in the shrinking nebula vaporized most of the solid material that was originally present. At the same time, the collapsing nebula began to rotate faster through the conservation of angular momentum, which tells us that a rotating object will spin faster as it gets smaller (or spin more slowly as it gets larger). Like a figure skater pulling their arms in to spin faster, the shrinking cloud spun more quickly as time went on. Now, think about how a round object spins. Close to the poles, the spin rate is slow, and it gets faster as you get closer to the equator. In the same way, near the poles of the nebula, where orbits were slow, the nebular material fell directly into the center. Faster moving material, on the other hand, collapsed into a flat disk revolving around the central object (Figure 6).
It eventually gets hot enough at the center of the disk (10 million K) for the protosun to begin fusing hydrogen into helium; this marks the beginning of the Sun's life as a star. In the last stage (4) shown in Figure 6, material is clumping together within the lanes that formed in the solar nebula, and planetesimals accrete more material to become protoplanets and then the planets.
How do we know?
Protoplanetary disks had long been theorized to exist in star forming regions and evidence of their existence began with the detection of a circumstellar disk around the star β Pictoris in 1984 with the Infrared Astronomy Satellite. The images of the protoplanetary disks in the Orion Nebula in the figure below were taken with the Hubble Space Telescope (HST), which launched in 1990. The bright points at the center of the proplyds in Figure 7 are young protostars that are surrounded by dusty disks. Many other proplyds were observed in the Orion Nebula by the same team using HST, and this was a very significant finding in 1992. This is the same year that the first exoplanet was detected orbiting a pulsar and there was still much speculation on how common other solar systems were in our galaxy. Finding a large number of proplyds in just one nearby star forming region strongly suggested that the process of planet formation could be common, and perhaps other planets could host life.
The temperature within the disk decreases with increasing distance from the Sun, much as the planets’ temperatures vary with position today. As the disk cooled, the gases interacted chemically to produce compounds; eventually these compounds condensed into liquid droplets or solid grains. This is similar to the process by which raindrops on Earth condense from moist air as it rises over a mountain.
Closer to the disk, it was too hot for hydrogen compounds to solidify into ices; at these higher temperatures, only rocks and metals could condense into solids. Eventually, at a certain distance away from the star, it is cool enough for the hydrogen compounds to also condense into ice. This idea is shown in Figure 8 below, where the line beyond which it is cold enough for hydrogen compounds to freeze is indicated as the frost line or snow line. The location of the frost line depends on the mass of the star that is forming at the center. For a star like the Sun, the frost line is 2.7 AU from the center. It will be closer for a low mass star and further our for a more massive star.
This very intuitive idea -- that temperature decreases as you get further from the star -- goes a long way in explaining the chemical differences as well as size and density differences between the terrestrial and jovian planets. The jovian planets are much more massive than the terrestrial planets, while the terrestrial planets have a higher density than the jovians. The terrestrial planets are rocky and have average densities of 5.0 g/cm3, while the jovian planets have an average density of 1.2 g/cm3 (for reference, at STP, hydrogen gas has a density of 0.089 g/cm3, water has a density of 1.0 g/cm3, silicon has a density of 2.3 g/cm3, and iron has a density of 7.9 g/cm3).
Let's start with the mass differences. The terrestrial planets are made of rock and metal, and the jovians are made of rock, metal, and ices. Ice has mass, so the jovians grew more massive as they accumulated ice on top of the rock. The higher mass from the ice meant that gravity was stronger for these planets and hence more material could be pulled in. More material means more mass and stronger gravity...this self-reenforcing process continued until the jovians had pulled in all of the hydrogen and helium gas. This explains the mass differences.
As for density, since the additional ice and gases that the jovians pulled in have very low densities, this brought the overall densities of the jovians down to values that are much lower than rock. The density of Jupiter is 1.3 g/cm3 and this is the average density for the entire planet. While Jupiter has a dense metal core, the planet is vastly dominated by the light gases helium and hydrogen so the average density is much lower than the values for metals and rock. Without these additional ice and gas layers, the terrestrial densities remain higher, with values matching those of rocks and metals.
The solar nebula model explains why planets should be expected to orbit in the same direction as the spin of the star: the planets and star all formed from the same spinning disk of material. Therefore, the Sun rotates in the same direction as the spinning disk and the planets all orbit the Sun in the same direction. The planetary orbits would also stay in the plane of the flattened disk, which explains why the orbits of the planets are coplanar (recall Figure 3).
The different locations of the terrestrials and jovians are also explained by the temperature in the disk where they formed. Asteroids and comets are left over planetesimals that were not swept up into a planet. Their compositions are also related to the conditions where they formed in the disk. Asteroids formed inside the frost line and are made of rocky materials. Comets formed outside the frost line, and are consequently rocks covered in a layer of ice.
The unusual features that we observe, such as the sideways tilt of Uranus or Venus' upside-down rotation, can be explained by the solar nebula model as the result of collisions during the planet-building phase. What about all the moons and rings around the jovians? This relates back to the high masses of the jovian planets. Since these planets are so massive, their strong gravity pulls in some of the dust and gas from the solar nebula, thus becoming "mini solar nebulas" as they form. This swirling disk of material around the jovians is the material that forms their moons and rings. The terrestrial planets were not massive enough to pull in material from the solar nebula, so the terrestrial moons are thought to be the result of early collisions with planetesimals. Our Moon, for example, is believed to have formed from the debris of a collision between the early Earth and another large body (Figure 9). Evidence to support this formation scenario for the Moon comes from lunar rocks brought back to Earth by astronauts on the Apollo missions between 1969 and 1972. These rocks confirmed that the composition of the Moon is similar to that of the Earth's crust and mantle.
How do we know?
Dramatic evidence supporting the separation of material into distinct lanes or rings within the solar nebula came from this image shown to the right (Figure 10), which was taken in 2014 with the Atacama Large Millimeter Array (ALMA) of radio telescopes in the Chilean desert. This picture of the young star HL Tauri looks like an artists's sketch of a solar system forming; in fact, it looks quite similar to how panel 3 of Figure 6 would look if sketched face-on rather than edge-on.
Comparison with other solar systems
Over 4,000 exoplanetary systems have been detected to date. Do they resemble our solar system, with four inner rocky planets and four outer gas giants. In a word, No. The animation below shows what the multi-planet systems detected by the Kepler Mission look like. Only the planets are shown and not the host stars and the planets are color-coded according to their temperature: the hottest "lava" planets are red and comparatively cooler planets, like Earth, Mars, and the gas giants, are colored blue. Planets that are analogues of Venus, with its hot rocky surface that could melt lead, are colored white. Watch the animation a few times and pause it to really take in how different all of these planetary systems are from our own.
Animation of multi-planet systems.
Video credits: Ethan Kruse/NASA Goddard, CC BY 3.0
https://youtu.be/5I_FOEh47RY?feature=shared
There are some biases for the planetary systems shown in this animation, as the transit method that Kepler uses to detect planets will preferentially find planets that are orbiting close to their host star. We can still make the general conclusion that solar systems show an immense amount of variation. As we explore in Exoplanets: Statistics and Discoveries, the vast majority of exoplanets detected to date are different from the terrestrial and jovian planets in our solar system. In some cases, gas giants like Jupiter are found orbiting extremely close to their host stars. These "hot Jupiters" seem inconsistent with a formation scenario in which they formed so close to their stars. Computer simulations are being used to explore if perhaps these planets formed where expected but somehow migrated closer in to their star.
From the evidence we see of proplyds in our galaxy, we have confidence that the main idea of the solar nebula model -- that solar systems form when a cloud of gas and dust collapses and forms a swirling disk of material with a protostar at its center -- is correct.
Solar System Stability
Planets are kept in their orbits primarily through gravitational interactions between the planet and their host star. However, planets also feel a much smaller but non-negligible gravitational pull from the other planets in the system. Though the planets in our Solar System are relatively well separated, this is not always the case in other Solar Systems, and may not even always be the case for our own system. The closer two bodies are to each other, the stronger their gravitational pull will be on each other.
Close encounters between planets can affect their orbits' eccentricities, semi-major axes, and relative inclination. These effects are accentuated in the case of resonant systems. Resonance describes the situation in which two planets have periods that form an integer ratio. For example, if one planet has a period of two years and a second planet has a period of four years, these two planets are said to be in resonance. Today, we can use computer simulations to determine what will happen to different systems of planets as they evolve through time that will expose these types of interactions.
Planets may also move around during formation. This may push smaller, more-likely rocky planets into the host star, or send debris like asteroids and comets into the path of other planets. Such motion in our Solar System is thought to have caused the period of late heavy bombardment, which left its mark on our Moon. This type of mechanism may have caused the strange position of hot Jupiters, which are commonly found and much closer in than where they could have formed.
In 2008, a paper by Batygin and Laughlin showed that on million-year time scales, planetary orbits may evolve in random, but ultimately stable ways. However, on longer timescales, orbits can rapidly and spontaneously evolve into chaotic states hard for even the best computer simulations to predict. Subtle interactions between the different planets and objects with mass in the solar system are capable of enacting significant change over the dynamical state of a system of planets. Close encounters will amplify these changes, rearrange orbits, and eject small bodies out of the Solar System. Resonant affects could even depopulate entire areas in a planetary system. The architecture and stability of a planetary system are important contributors to a planet's potential habitability.
Key Concepts and Summary
Stars form when high density regions in giant molecular clouds begin to gravitationally collapse. As the protostar is collapsing, conservation of angular momentum forces it to spin faster and a disk of gas and dust settles around the equator of the star. This is the protoplanetary disk, where clumps of material collide and grow to form planetesimals, which collide and grow to form planets. In our solar system, there are two types of planets that formed: smaller rocky planets with thin atmospheres and gas giant planets. The solar nebula model describes formation of the solar system and describes the main features that we observe: the rocky planets orbit more closely to the Sun and gas giants formed and orbit beyond the ice line. The process of planet formation takes almost a million years, far beyond the lifetime of human astronomers. However, the discovery of young stars with protoplanetary disks and the structure of exoplanetary systems have helped to confirm and extend our understanding of star and planet formation.
Review Questions
Summary Questions
- What are giant molecular clouds? How do star systems form within GMCs?
- List the main observed properties of the planets in our solar system.
- What is the solar nebular theory?
- What properties are different for terrestrial and jovian planets?
- How does the solar nebular theory explain each of the properties observed in our solar system?
- How do comets and asteroids differ from planets? Where are comets and asteroids found in our solar system?
- What evidence do we have that the solar nebula model explains the formation of other solar systems in our galaxy?
- How did Earth's moon form? What evidence supports this claim?
- Do other solar systems have the same layout as our own? What evidence supports your answer?
Exercises
To approach the subject of astrobiology – specifically, of exploring possibilities that other life exists beyond the Earth – it is worthwhile to ponder the size and age of the cosmos. In this grand scheme, when and where did life on Earth first appear? The moment when the first life appeared is not precisely known, but several lines of evidence provide compelling clues for the timing of the rise of life on Earth.
Learning Objectives
By the end of this chapter, you will be able to:
- Explain the idea of the "cosmic calendar" and the timing of key events for life
- Express small and large numbers using powers of ten
- Describe the range of sizes for objects in the universe
- Explain light units such as light years and light seconds
- Describe how parallax can be used to estimate the distance to an object
The Big Bang and the Expanding Universe
Hubble's Law
In 1929, Edwin Hubble published a now-famous paper in the Publications of the National Academy of Science titled, "A Relation between Distance and Radial Velocity in Extragalactic Nebulae.'' As mentioned in the previous chapter, this work showed that M31 and M33 were beyond the known boundaries of our galaxy. In this paper he included a Table of data (reproduced below) showing distances, r, and radial velocities, v, to a couple of dozen "extragalactic nebulae,'' objects that we now understand to be other galaxies.
The "radial'' velocity is the component of velocity along our line of sight to an object. We defer a discussion of how the galactic velocities were measured to the chapter on spectroscopy, but for now, trust us... measuring radial velocities of galaxies is bread-and-butter astronomy.
Hubble sorted the galaxies by distance and immediately noticed a correlation: the more distant galaxies generally had larger radial velocities than closer galaxies. It was also clear that most galaxies - especially those at large distances - are moving away from us (by convention, positive velocities recede from us and negative velocities approach us). A few scientists of the day had already predicted this result as a critical test for a Big Bang.
Hubble plotted up his data and derived the best-fit linear velocity-distance relation. There is some scatter in Hubble's diagram. Some of this was the result of errors in the data, particularly the distances to galaxies. However, our Milky Way is one of a few dozen galaxies in what we call the Local Group. Galaxies in clusters are gravitationally bound and have orbital velocities that are larger than velocities from the expansion of the universe. Some of the velocities of galaxies in the Local Group (like the Andromeda Galaxy) are directed toward us -- those galaxies have negative velocities. Hubble's law really applies only to distant galaxies beyond the Local Group.
The speed with which galaxies are moving apart is called the recession speed. Let's think about what this linear relation between distance and recession speed means. Imagine that Galaxy A is initially at a distance d, and Galaxy B is initially at a distance 2d. Now, let enough time pass so that Galaxy A is at a distance 2d. If the expansion of space is constant everywhere, then Galaxy B will have moved to a distance 4d in that same time interval. Speed is distance divided by time; since Galaxy B travels twice the distance of Galaxy A in the same time interval, it must be traveling at twice the speed. When the expansion of the universe is constant, distance is proportional to recession velocity.
Concept Check
Can you think of how it might be possible to deduce the age of the universe from Hubble's data?
At first glance, it is tempting to conclude that the universe is expanding away from us - that we are the center of the universe. In fact, there is nothing special about our place in the universe. From the perspective of observers in every galaxy, most other galaxies seem to be receding. Indeed, alien astronomers in other galaxies have probably already published these same results, showing the relation between the distance and velocity of other galaxies. Like Hubble, they will know that they are not at the center of the universe.
The linear relationship between distance and recession velocity in Hubble's diagram (above) is expressed by a simple equation:
$v = H_0 d$
The astute reader will immediately recognize this as the equation of a straight line: Here, H0 is the slope of the line and the y-intercept is zero. This equation says that the recession velocity of a galaxy is proportional to its distance. The constant of proportionality, H0, is called Hubble's constant. Mathematically, it is the slope of the line in the velocity-distance relation. The units of H0 are physically meaningful: they have units of speed per distance (typically, km/s per megaparsec, Mpc). Assuming that Hubble's constant is really constant (i.e., not changing over time), then once this value is determined, you can measure the velocity of a galaxy (with spectroscopy) to derive its distance. Galaxies with larger velocities are farther away. So, Equation 1 is a powerful way to estimate distances to other galaxies. But, keep in mind the chicken and egg problem - we had to measure velocities and distances for some galaxies to derive the Hubble relationship. Once that was done, we were able to lean on the linear model to find distances to other galaxies.
The Hubble constant tells us something rather surprising. The units of 1/H0, (or distance / velocity) are time, and this "time'' is none other than the age of the universe. It is incredible that we can calculate the slope of the line in Hubble's data and solve for the age of the universe. The only rookie mistake has to do with the units - make sure that the speed (distance per time - usually km/s) and distance (usually Mpc) are converted to the same units so that distance really cancels out. And then, you will want to convert to more useful units than seconds: years or billions of years.
So, to recap, Edwin Hubble measured distances to the nearest galaxies, proving that they were outside of the Milky Way. He measured the velocities of other galaxies and found a correlation between distance and recession speed, providing observational evidence that the universe is expanding, and yielding an estimate for the age of the universe. This work provided a resolution to Olbers' paradox: the universe is not infinitely old (we can calculate its age), and because it is expanding, the light from stars in the most distant galaxies has been redshifted out of the optical bandpass (a concept we will discuss more in later chapters). Hubble's work changed our perspective of our place in the universe, and astronomers honored his contributions by naming a space observatory after him: the Hubble Space Telescope (HST) has been a workhorse telescope for the community since the mid-1990's.
We started with a presentation of Edwin Hubble's observations of the expanding universe because it was intuitively easy to understand. However, the Belgian priest George Lemaitre deserves a lot of credit for pioneering modern cosmology. In 1927, two years before Hubble's famous paper, Lemaitre published a paper with the rather wordy title: "A homogeneous universe of constant mass and growing radius accounting for the radial velocity of extragalactic nebulae." We now know Lemaitre's model as "Hubble's law" but it was Lemaitre who worked out the theory of the expanding universe with pencil and paper, based on Einstein's theory of general relativity. He proposed that the recession velocity of galaxies (extragalactic nebulae) could be explained by this expansion, and he derived the first estimate for the rate of expansion, which is now known as the Hubble constant, H0. Lemaitre gets extra credit for persisting in the face of a harsh critic; Einstein himself reportedly told him: "Sir, your calculations are correct, but your physics is atrocious." In the 1930's the idea that the universe was expanding was an extraordinary claim, and it would require extraordinary evidence (to borrow a phrase from Carl Sagan) before this theory was accepted. This evidence is described in the supplementary chapter "An Expanding Universe."
Our Place in Time: The Cosmic Calendar
The universe emerged at the moment of the Big Bang, 13.8 billion years ago. This is our starting point for time. Key events since this moment, including the formation of our galaxy and our solar system, can be identified in a memorable way by compressing all of time into one calendar year. This idea for the “cosmic calendar” was first articulated by astronomer Carl Sagan. On this cosmic calendar (Figure 1), each month represents a little over a billion years. Each day covers a span of around 40 million years. The very first stars and galaxies form in late January, and our home galaxy, the Milky Way, forms in early March. Our solar system comes on the scene in early September, and the first life on Earth probably formed by mid- to late-September.
Life starts as very simple cells and gradually evolves into more, with the first multicellular life appearing in November, and the first plants on December 20th. Primates, including humans, appear on December 31. In fact, modern humans show up on December 31, at 11:52 PM, which is on the order of the real-time equivalent of hundreds of thousands of years ago. In the bottom panel of Figure 1, which zooms in on the last 60 seconds on December 31, we see that all of modern science, including the development of both the telescope and microscope in the 17th century, happen in the last second at 11:59 PM.
There are a few ways to think about this time frame. On one hand, technologically advanced humans on Earth are newcomers. Humans have been sending out radio waves for less than one cosmic second. However, considering that the first life to appear on Earth took only a few cosmic weeks to form, perhaps the initial formation of life on other worlds will be a relatively speedy process. When considering just how many planets there are in the cosmos, it is tempting to think that the odds of life existing on at least one other planet are good.
Our Place in Space
Space also emerged at the moment of the Big Bang, and it has been expanding ever since. Contemplating the size of the cosmos can seem mind-bending but we can ground ourselves by starting with some size comparisons of more familiar objects. When comparing the sizes of two objects, a good first step is to be clear as to what is being compared, as the word size can mean different things -- length and volume, for example, are do not measure the same thing. Here, let's compare the length of some different objects, where the length is the distance from one end to the other end. Of course not all objects are symmetric so you may need to be more specific about how you are defining length, depending on what is being compared. For example, bacteria come in different shapes, such as rods, spheres, and spirals. In specifying a bacterium’s size, you would need to be clear about the start and end points of the measurement. In astronomy, galaxies also come in different shapes – ellipsoids, spirals, and irregular shapes – so it is important to know which dimension (say left to right or top to bottom) the length is referring to.
Units of length are important to consider. Lengths and distances are one-dimensional measures and are expressed in units such as meters or miles. Of course, the length of any object can be expressed in any units: what's important is that the objects being compared have the same units. Let's compare the size of a grapefruit and a bacterium. The length of a typical grapefruit is around 10 inches, which is the same as 25.4 centimeters (cm), 0.254 meters (m), 0.000254 kilometers (km) or 0.000158 miles. These are all equivalent measures, and it is a matter of convenience when choosing units. When directly comparing two measurements, all that matters is that the units chosen for the grapefruit are the same as those for a bacterium. We know that bacteria are very small, and a typical size is reported in units of micrometers (μm), where the prefix micro indicates 0.000001 meters. So, we can compare a grapefruit and a bacterium using meters (m): a grapefruit is 0.254 m and a bacterium is 0.000001 m. Clearly, the grapefruit is larger than the bacterium, and we can find exactly how much larger by dividing the two sizes: (0.254 m)/(0.000001 m) = 254,000. Dividing the two sizes (or taking the ratio) shows that the grapefruit is 254,000 times larger than the bacterium. We could still use a way to simply our notation, as it's easy to accidentally leave off one of the zeroes in the size of the bacterium. That's where "powers of ten" notation becomes useful.
Powers of Ten
Scaling to the largest sizes we will consider, a galaxy is a vast collection of stars that are held together by gravity. The length of a typical spiral galaxy, like the Milky Way, is about 1,000,000,000,000,000,000,000 meters (m), or a billion trillion m. This is a huge number, with 21 zeros after the one (this length is called a sextillion meters). The number may seem more intuitive when expressed as one billion trillion, as billion and trillion are familiar values that show up in our daily life (for example, billionaires are often in the news, and although no trillionaires yet exist, we intuitively know how much money they would have). When writing these numbers the prefixes M and G are sometimes used, where M stands for a million or the prefix "Mega" and G for a billion or the prefix "Giga".
One additional way to express these number is by using powers of ten. A million expressed in powers of ten is 106, since there are 6 zeros. Similarly, the Milky Way’s size can be written as 1021 m. There is also a prefix for 1021, called zetta and abbreviated by a Z. The Milky Way’s size can be expressed as 1021 m, 1 Zm or 1 sextillion m. This link to the National Institute of Standards and Technology lists the common prefixes that we use. In this table, we see that a yoctosecond is a very small measure of time – it is a mere septillionth of a second or 10-24 s. We will make regular use of powers of ten notation in this course, as we will be dealing with immensely large and small numbers.
In the context of comparing such a wide range of phenomena as this subject warrants, a good first step is to estimate the order of magnitude of the scale of an object. The easiest way to do this is to write the measurement in scientific notation and consider only the exponent. Notice that we need to identify the units of measurement as well as the order of magnitude to avoid ambiguity.
To get a better feel for very large and very small numbers in nature, the following film, created by Charles and Ray Eames in the 1970s, explores the very largest and very smallest numbers using powers of ten. Note that since the creation of this film, scientific advances have aided in the more complete understanding of the largest and smallest scales so that we now have more exacting probes of the largest scales and the smallest scales shown in the film. Our maps of galaxy clusters and investigations to the observable limits of our universe have improved to the extent that we can accurately identify the distribution of millions of galaxies while our understanding of the standard model of particle physics has been confirmed down to the centers of atomic nuclei.
https://www.youtube.com/watch?v=0fKBhvDjuy0
Copyright © Eames Office, LLC. All rights reserved.
The smallest measurable sizes bring us inside the nucleus of an atom, where subatomic particles called protons, with a size of just 10-15 m, are found. On the largest scale, the size of the observable universe is estimated to be about 1026 m. These are such vastly different sizes it is hard to even imagine comparing them, but it can be done very simply. The question of “how many times larger” one object is compared to another object can be found by dividing the two numbers: 1026 m/10-15 m = 1041 (for a review on working with powers of ten and scientific notation, please see Appendix B). The answer tells us that the observable universe is 1041 times larger, or “41 powers of ten,” larger than a proton. This can also be stated by saying that the universe is 41 orders of magnitude larger than a proton.
This type of analysis is powerful. Compared to the entire size of an atom, the nucleus is about 10,000 times smaller (104, or 4 orders of magnitude). This tells us that an atom – the fundamental building block of matter – is mostly empty space. The universe, it turns out, is also filled with huge voids of empty space.
Concept Check: Exponential sizes
Storage devices come in different sizes, and a small flash drive might have 64 MB of space and a large drive could have 500 GB. The small flash drive has 64 million bytes of space, where a million is 1,000,000 – one with six zeros. The "M "in MB stands for the prefix Mega, meaning million, and "B" is the abbreviation for bytes. Note that G is the prefix Giga, meaning billion.
To compare the size of a 512 MB flash drive to a 64 MB flash drive, this can answered in one step by dividing the two sizes: 512 MB/64 MB = 8. The 512 MB is eight times larger than the 64 MB drive. To state it another way, you would need eight 64 MB drives to equal one 512 MB drive. Notice that the answer, eight, has no units (or, we say is “dimensionless”). This makes sense – since both sizes are in MB, we compared “apples to apples”.
If the question asked how many times larger a 512 GB drive is compared to a 64 MB drive, you would need to make the units agree before dividing the numbers. Do this!
Show Solution
There are a few different ways to approach this: you could convert from GB to MB, from MB to GB, or convert both units into B. Let's convert 512 GB into MB, so that both quantities will have the same units:
512 GB × (103 MB/1 GB) = 512×103 MB
Now, we can divide the two quantities since they are both in MB: (512,000 MB/64 MB) = 8000
It takes eight thousand 64 MB flash drives to equal one 512 GB drive.
If the conversion directly from GB to MB was not clear, we can do this in two steps:
512 GB × (109 B/1 GB) × (1 MB/106 B) = 512×109×10-6 B = 512×103 MB = 512,000 MB
Stars
The power of a star can be measured in Watts (W), just like light bulbs. The Sun's power output is 3.8×1026 W and the power of the star Arcturus is 6.5×1028 W.
(a) How many times more powerful is Arcturus than the Sun? (b) How many times less powerful is the Sun than Arcturus?
Show Answer
(a) We can simply divide the power of Arcturus by the power of the Sun to find this:
(6.5×1028 W)/(3.8×1026 W) = 171
(b) 0.0058 or (1/171)
Light Units and Speed
To explore the chemistry and possible biology of other worlds, ideally we would send humans there to run experiments. Humans have been to the Moon to collect rocks, and there are currently several rovers that are controlled from Earth analyzing rocks and soil on the surface of Mars. There are plans to send humans to Mars in the next decade or two. Why not send humans sooner? There turn out to be many challenges to physically traveling beyond the Earth, but the distances involved are foremost.
We are familiar with long distances on Earth. The distance from NYC to Sydney, Australia is about 10,000 miles (16,000 km) and a typical jet flies at a speed of 575 mph, so this flight takes over 17 hours. How about the distance from Earth to the Moon or Mars? The Moon is around 240,000 miles (384,000 km) away and Mars is over 200 million miles from Earth. In 2020, the Perseverance spacecraft travelled at 24,600 mph to Mars and still took about 7 months to get there. The amount of time it takes to travel somewhere is the distance divided by the speed you are traveling, or:
time = (distance)/(speed)
If you are traveling to a place 30 miles away at a steady speed of 60 mph, then it takes you (30 miles)/(60 mph) = 0.5 hour to get there.
Concept Check: Distances, speed and time
If it takes 18 days for a rover moving at a steady speed to travel a distance of 6 km, how fast was the rover moving?
Show Answer
speed = (distance)/(time)
speed =(6 km)/(18 hours) = 1/3 km/hr = 0.33 km/hr
In fact, this is the maximum speed that the Perseverance rover can reach.
Perhaps you can just travel at faster speeds to get someplace far, like Mars, more quickly? While this idea works well for speeds on Earth (and hence we have supersonic jets and bullet trains), there is a limit to how fast anything can travel. This cosmic speed limit is called the speed of light, and nothing can travel faster. In fact, only light, which has no mass, can travel at the speed of light; any object with mass can never reach this speed due to the effects of Einstein’s theory of special relativity. So, the fastest possible way to reach a distant world is to send light. This may not seem very helpful at first, but light can contain information – think about radio or TV signals – so this is a potential way to send communications to distant worlds.
How long would light take to reach Mars? The speed of light, which is denoted by the symbol c, can be expressed in any units, such as km/hr, mph, or feet/s. Two common choices are m/s and km/s:
c = 300,000 km/s = 3×10⁵ km/s = 3×10⁸ m/s
(For comparison, a variety of speeds that we may encounter in astrobiology are listed in Table 2.) The distance to Mars when it is closest to the Earth is 55 million km. Using the simple relationship for time, distance, and speed, we arrive at an answer of 183 seconds. That’s fast – only about 3 minutes! And definitely faster than the 7 months the Perseverance spacecraft took. This way of thinking about distances, times, and the speed of light is so useful, in fact, that astronomers often use light units to express distances. The Sun is 93 million miles away from Earth. If we do the same calculation for how long light from the Sun takes to reach us on Earth, it is 8 minutes. That’s about three times as long as light takes to get to and from Mars. We can now express the distances d to the Sun and Mars, in light units: dSun = 8 light minutes and dMars = 3 light minutes
| Scenario | Speed | Scenario | Speed |
| Drift speed of the continents | 3 × 10⁻⁹ m/s | Orbital speed of the Earth around the Sun | 30 km/s |
| Growth speed of human hair | 5 × 10⁻⁹ m/s | Escape speed from the Solar System (at the distance of Earth) | 40 km/s |
| Automobile | 100 km/hour = 28 m/s | Fastest human-made object | 110 km/s |
| Rotational speed of the Earth at the Equator | 1700 km/hour = 480 m/s | Orbital speed of the Sun around the Galaxy | 220 km/s |
| Orbital speed in low-Earth orbit | 8 km/s | Escape speed from the Galaxy (at the location of the Sun) | 310 km/s |
| Escape speed at Earth's surface | 11 km/s | Speed of light = c | 3 × 10⁵ km/s |
Worked Example: Light Units
Show that 1 light year is equal to 9.46 trillion km.
Recall that a light year is the distance that light travels in 1 year. We can use the relationship between time, distance and speed, along with unit conversions, to show this.
distance = (speed)×(time)
Here, we know the speed--the speed of light--and can express it in any units...let's use km/s, since the answer is in units of km. In the equation below, we use 3×10⁵ km/s for the speed. For the time, we use 1 year and convert this to seconds.
distance = (3×10⁵ km/s)×(1 year)
distance = (3×10⁵ km/s)×(1 year)×(365 days/1 yr)×(24 hours/1 day)×(60 min/1 hr)×(60 sec/1 min) = 9.46×10¹² km
Recall that a light year is the distance that light travels in 1 year. We can use the relationship between time, distance and speed, along with unit conversions, to show this.
distance = (speed)×(time)
Here, we know the speed--the speed of light--and can express it in any units...let's use km/s, since the answer is in units of km. In the equation below, we use 3×10⁵ km/s for the speed. For the time, we use 1 year and convert this to seconds.
distance = (3×10⁵ km/s)×(1 year)
distance = (3×10⁵ km/s)×(1 year)×(365 days/1 yr)×(24 hours/1 day)×(60 min/1 hr)×(60 sec/1 min) = 9.46×10¹² km
This is equal to 9.46 trillion km.
How long does it take light from the Sun to reach Saturn, in minutes?
Start with the average distance from the Sun to Saturn in km, which is 1.4 billion km.
Show Answer
Light from the Sun is traveling at the speed of light, or 3×10⁵ km/s.
time = (distance)/(speed) = (1.4×10⁹ km)/(3×105 km/s) = 4,667 seconds
(4667 sec)(1 min/60 sec) = 78 minutes
We can thus say that Saturn is 78 light minutes away from the Sun.
How about the closest star to the Sun? That’s a red star named Proxima Centauri, and it is staggering 40,208,000,000,000 km (40 trillion km or 4×10¹³ km) away. In light units, however, this distance is 4 light years. It takes light 4 years to reach Proxima Centauri. The distances in light units to some nearby astronomical objects are shown in Figure 4. Light units are very convenient for expressing distances to stars that have intriguing planets orbiting them, as this tells us how long a radio signal would take to arrive at the star system. Also, light units remind us that we have a way of looking into the past! Notice in Figure 4 that the Andromeda galaxy is 2.5 million light years away. This means that light from Andromeda takes 2.5 million years to reach us, and that consequently we are seeing Andromeda as it looked 2.5 million years ago. This gives astronomers a way to see how the oldest galaxies in the universe, that are more than 13 billion light years away, looked when they were very young!
Concept Check: Distances
In Figure 4, the distance of 12 light minutes from Earth to Mars is actually the average, as the distance from Earth to Mars varies from 3 light minutes to 22 light minutes (at the furthest distance, it is on the opposite side of the Sun compared to Earth). When Mars and the Earth are at their closest distance, how long does it take light from the Sun to reach Mars?
It may help to make a sketch of the alignment of the Sun, Mars and Earth when Mars and Earth are closest to each other.
Show Sketch and Answer
The left panel shows the alignment of the Sun, Earth, and Mars when Mars is closest to the Earth. The time for sunlight to reach the Earth is 8 light minutes and the time for light to travel from Earth to Mars is 3 light minutes at closest approach. Thus, the total time is 8 light min + 3 light min = 11 light min
Other units of distance in astronomy
If you look up the distance to an astronomical object, the units will vary. For example, the distance to the star Vega might be reported in light years or parsecs -- it is 25 light years away which is the same as 7.8 parsecs. The Oort cloud surrounding our solar system is 50,000 AU away. Let's introduce these units as well.
Astronomical Units
When reporting distances within solar systems, astronomical units (AU) are typically used. One AU is defined to be the average distance from the Earth to the Sun. Mercury and Venus are closer to the Sun than the Earth and thus have distances in AU that are less than 1 AU. Saturn is at about 10 AU from the Sun and Neptune is at 30 AU.
When you read about the distance of an exoplanet from its host star, these are also reported in AU and have the exact same meaning as in our solar system. The exoplanet Proxima b orbits the red star Proxima Centauri, and Proxima b is an average distance of 0.0485 AU away from Proxima Centauri. This means Proxima b is very close to its star: it is nearly 2 orders of magnitude closer to Proxima Centauri than the Earth is from the Sun.
Parsecs
Parsecs (abbreviated pc) and light years have similar values:
1 pc = 3.26 light years
It is usually a matter of context in deciding which units to use although it is usually more intuitive for students to use light units.
The word parsec is a portmanteau of the words "parallax" and "arcsecond" and is defined as "the distance at which we have a parallax of one second." Parallax is an angular measure, meaning it has units of degrees or radians (or arcminutes and arcseconds). The apparent shift in the direction of an object as a result of the motion of the observer is called parallax. We call the shift in the apparent direction of a star due to Earth’s orbital motion stellar parallax. The Greeks made dedicated efforts to observe stellar parallax, even enlisting the aid of Greek soldiers with the clearest vision, but to no avail. The brighter (and presumably nearer) stars just did not seem to shift as the Greeks observed them in the spring and then again in the fall (when Earth is on the opposite side of the Sun). In reality, stellar parallax angles were too small to measure with scientific instruments until the 19th century.
Concept Check: Angular Units
The basis for angular units is that there are 360° or 2$\pi$ radians in a full circle. Arcseconds and arcminutes are simply divisions of a degree into smaller units, where 1 degree contains 60 arcminutes (abbreviated as 60$'$) and 1 arcminute contains 60 arcseconds (abbreviated as 60$''$).
The best way to visualize parallax angles is to hold up something like a pencil at a distance of just a few inches from your nose. Now, hold up another pencil at the greatest distance that you can reach (as demonstrated below). If you wink your eyes (left then right), you'll see that the pencil that is closest to your face appears to have a much larger shift (right to left) than the distant pencil.
We use the same principle to measure distances to stars. Stars that are close to us will have larger parallaxes than more distant stars. Winking our eyes won't work for this measurement because the baseline (the distance between our eyes) is too small. Instead, we use the baseline of the Earth's orbit to see apparent position of the foreground stars jump relative to the background stars.
The parallax angle is abbreviated as p . It can be shown using simple trigonometry that the distance to a star is inversely proportional to its parallax angle:
$$d = \frac{1}{p}$$
where $p$ is reported in arcseconds and $d$ is given in parsecs.
Key Concepts and Summary
The scale of space and time in the universe is so enormous that we need strategies to organize a basic understanding of where and when. The cosmic calendar re-scales the 13.8 billion year age of the universe into a "cosmic year", effectively capturing the timing for the rise of life and the very recent appearance of modern humans. The exponential spatial scale of the universe is captured as powers of ten, to compare the smallest and largest sizes and distances. A common unit for distances is light travel time: light could travel the circumference of the Earth seven times in just one second. It takes light 8 minutes to travel from the Sun to the Earth; 4.3 years to travel from Earth to the nearest star system, alpha Centauri, and 2.5 million years to travel to the closest spiral galaxy, Andromeda. Another important distance scale in astronomy is the distance from the Sun to the Earth: 1 Astronomical Unit or 1 AU. As we look out into the universe, determining the distances to other stars is accomplished with high school level trigonometry: measuring the shift of foreground stars relative to more distant stars.
Review Questions
Summary Questions
- How does the "cosmic calendar" help in understanding when key events happened for the development of life on Earth?
- How do you compare the size (or any property) of two objects using powers of ten?
- How does the smallest size we can observe compare with the largest size? Give an example of two objects that vary by 8 orders of magnitude. How about 17 orders of magnitude?
- What are light units? Why is it convenient for astronomers to use light units when expressing distances?
- How many light years are there in 1 parsec? Describe the unit parsec and why it is named the way it is.
- How can parallax be used to estimate the distance to an object?
Exercises
- Using the speed in Table 2, how long will your hair grow in one month?
- The Voyager 1 spacecraft is traveling at a speed of 38,000 miles per hour (17 km/s). Express this speed in light years per second (ly/s). How long would it take Voyager 1 to reach the closest star to the Sun, Proxima Centauri, which is 4.3 light years away?
- There are some additional exercises using powers of ten and scientific notation here (with solutions).
To approach the subject of astrobiology – specifically, of exploring possibilities that other life exists beyond the Earth – it is worthwhile to ponder the size and age of the cosmos. In this grand scheme, when and where did life on Earth first appear? The moment when the first life appeared is not precisely known, but several lines of evidence provide compelling clues for the timing of the rise of life on Earth.
Learning Objectives
By the end of this chapter, you will be able to:
- Explain the idea of the "cosmic calendar" and the timing of key events for life
- Express small and large numbers using powers of ten
- Describe the range of sizes for objects in the universe
- Explain light units such as light years and light seconds
- Describe how parallax can be used to estimate the distance to an object
The Big Bang and the Expanding Universe
Hubble's Law
In 1929, Edwin Hubble published a now-famous paper in the Publications of the National Academy of Science titled, "A Relation between Distance and Radial Velocity in Extragalactic Nebulae.'' As mentioned in the previous chapter, this work showed that M31 and M33 were beyond the known boundaries of our galaxy. In this paper he included a Table of data (reproduced below) showing distances, r, and radial velocities, v, to a couple of dozen "extragalactic nebulae,'' objects that we now understand to be other galaxies.
The "radial'' velocity is the component of velocity along our line of sight to an object. We defer a discussion of how the galactic velocities were measured to the chapter on spectroscopy, but for now, trust us... measuring radial velocities of galaxies is bread-and-butter astronomy.
Hubble sorted the galaxies by distance and immediately noticed a correlation: the more distant galaxies generally had larger radial velocities than closer galaxies. It was also clear that most galaxies - especially those at large distances - are moving away from us (by convention, positive velocities recede from us and negative velocities approach us). A few scientists of the day had already predicted this result as a critical test for a Big Bang.
Hubble plotted up his data and derived the best-fit linear velocity-distance relation. There is some scatter in Hubble's diagram. Some of this was the result of errors in the data, particularly the distances to galaxies. However, our Milky Way is one of a few dozen galaxies in what we call the Local Group. Galaxies in clusters are gravitationally bound and have orbital velocities that are larger than velocities from the expansion of the universe. Some of the velocities of galaxies in the Local Group (like the Andromeda Galaxy) are directed toward us -- those galaxies have negative velocities. Hubble's law really applies only to distant galaxies beyond the Local Group.
The speed with which galaxies are moving apart is called the recession speed. Let's think about what this linear relation between distance and recession speed means. Imagine that Galaxy A is initially at a distance d, and Galaxy B is initially at a distance 2d. Now, let enough time pass so that Galaxy A is at a distance 2d. If the expansion of space is constant everywhere, then Galaxy B will have moved to a distance 4d in that same time interval. Speed is distance divided by time; since Galaxy B travels twice the distance of Galaxy A in the same time interval, it must be traveling at twice the speed. When the expansion of the universe is constant, distance is proportional to recession velocity.
Concept Check
Can you think of how it might be possible to deduce the age of the universe from Hubble's data?
At first glance, it is tempting to conclude that the universe is expanding away from us - that we are the center of the universe. In fact, there is nothing special about our place in the universe. From the perspective of observers in every galaxy, most other galaxies seem to be receding. Indeed, alien astronomers in other galaxies have probably already published these same results, showing the relation between the distance and velocity of other galaxies. Like Hubble, they will know that they are not at the center of the universe.
The linear relationship between distance and recession velocity in Hubble's diagram (above) is expressed by a simple equation:
$$v = H_0 d$$
The astute reader will immediately recognize this as the equation of a straight line: Here, H0 is the slope of the line and the y-intercept is zero. This equation says that the recession velocity of a galaxy is proportional to its distance. The constant of proportionality, H0, is called Hubble's constant. Mathematically, it is the slope of the line in the velocity-distance relation. The units of H0 are physically meaningful: they have units of speed per distance (typically, km/s per megaparsec, Mpc). Assuming that Hubble's constant is really constant (i.e., not changing over time), then once this value is determined, you can measure the velocity of a galaxy (with spectroscopy) to derive its distance. Galaxies with larger velocities are farther away. So, Equation 1 is a powerful way to estimate distances to other galaxies. But, keep in mind the chicken and egg problem - we had to measure velocities and distances for some galaxies to derive the Hubble relationship. Once that was done, we were able to lean on the linear model to find distances to other galaxies.
The Hubble constant tells us something rather surprising. The units of 1/H0, (or distance / velocity) are time, and this "time'' is none other than the age of the universe. It is incredible that we can calculate the slope of the line in Hubble's data and solve for the age of the universe. The only rookie mistake has to do with the units - make sure that the speed (distance per time - usually km/s) and distance (usually Mpc) are converted to the same units so that distance really cancels out. And then, you will want to convert to more useful units than seconds: years or billions of years.
So, to recap, Edwin Hubble measured distances to the nearest galaxies, proving that they were outside of the Milky Way. He measured the velocities of other galaxies and found a correlation between distance and recession speed, providing observational evidence that the universe is expanding, and yielding an estimate for the age of the universe. This work provided a resolution to Olbers' paradox: the universe is not infinitely old (we can calculate its age), and because it is expanding, the light from stars in the most distant galaxies has been redshifted out of the optical bandpass (a concept we will discuss more in later chapters). Hubble's work changed our perspective of our place in the universe, and astronomers honored his contributions by naming a space observatory after him: the Hubble Space Telescope (HST) has been a workhorse telescope for the community since the mid-1990's.
We started with a presentation of Edwin Hubble's observations of the expanding universe because it was intuitively easy to understand. However, the Belgian priest George Lemaitre deserves a lot of credit for pioneering modern cosmology. In 1927, two years before Hubble's famous paper, Lemaitre published a paper with the rather wordy title: "A homogeneous universe of constant mass and growing radius accounting for the radial velocity of extragalactic nebulae." We now know Lemaitre's model as "Hubble's law" but it was Lemaitre who worked out the theory of the expanding universe with pencil and paper, based on Einstein's theory of general relativity. He proposed that the recession velocity of galaxies (extragalactic nebulae) could be explained by this expansion, and he derived the first estimate for the rate of expansion, which is now known as the Hubble constant, H0. Lemaitre gets extra credit for persisting in the face of a harsh critic; Einstein himself reportedly told him: "Sir, your calculations are correct, but your physics is atrocious." In the 1930's the idea that the universe was expanding was an extraordinary claim, and it would require extraordinary evidence (to borrow a phrase from Carl Sagan) before this theory was accepted. This evidence is described in the supplementary chapter "An Expanding Universe."
Our Place in Time: The Cosmic Calendar
The universe emerged at the moment of the Big Bang, 13.8 billion years ago. This is our starting point for time. Key events since this moment, including the formation of our galaxy and our solar system, can be identified in a memorable way by compressing all of time into one calendar year. This idea for the “cosmic calendar” was first articulated by astronomer Carl Sagan. On this cosmic calendar (Figure 1), each month represents a little over a billion years. Each day covers a span of around 40 million years. The very first stars and galaxies form in late January, and our home galaxy, the Milky Way, forms in early March. Our solar system comes on the scene in early September, and the first life on Earth probably formed by mid- to late-September.
Life starts as very simple cells and gradually evolves into more, with the first multicellular life appearing in November, and the first plants on December 20th. Primates, including humans, appear on December 31. In fact, modern humans show up on December 31, at 11:52 PM, which is on the order of the real-time equivalent of hundreds of thousands of years ago. In the bottom panel of Figure 1, which zooms in on the last 60 seconds on December 31, we see that all of modern science, including the development of both the telescope and microscope in the 17th century, happen in the last second at 11:59 PM.
There are a few ways to think about this time frame. On one hand, technologically advanced humans on Earth are newcomers. Humans have been sending out radio waves for less than one cosmic second. However, considering that the first life to appear on Earth took only a few cosmic weeks to form, perhaps the initial formation of life on other worlds will be a relatively speedy process. When considering just how many planets there are in the cosmos, it is tempting to think that the odds of life existing on at least one other planet are good.
Our Place in Space
Space also emerged at the moment of the Big Bang, and it has been expanding ever since. Contemplating the size of the cosmos can seem mind-bending but we can ground ourselves by starting with some size comparisons of more familiar objects. When comparing the sizes of two objects, a good first step is to be clear as to what is being compared, as the word size can mean different things -- length and volume, for example, are do not measure the same thing. Here, let's compare the length of some different objects, where the length is the distance from one end to the other end. Of course not all objects are symmetric so you may need to be more specific about how you are defining length, depending on what is being compared. For example, bacteria come in different shapes, such as rods, spheres, and spirals. In specifying a bacterium’s size, you would need to be clear about the start and end points of the measurement. In astronomy, galaxies also come in different shapes – ellipsoids, spirals, and irregular shapes – so it is important to know which dimension (say left to right or top to bottom) the length is referring to.
Units of length are important to consider. Lengths and distances are one-dimensional measures and are expressed in units such as meters or miles. Of course, the length of any object can be expressed in any units: what's important is that the objects being compared have the same units. Let's compare the size of a grapefruit and a bacterium. The length of a typical grapefruit is around 10 inches, which is the same as 25.4 centimeters (cm), 0.254 meters (m), 0.000254 kilometers (km) or 0.000158 miles. These are all equivalent measures, and it is a matter of convenience when choosing units. When directly comparing two measurements, all that matters is that the units chosen for the grapefruit are the same as those for a bacterium. We know that bacteria are very small, and a typical size is reported in units of micrometers (μm), where the prefix micro indicates 0.000001 meters. So, we can compare a grapefruit and a bacterium using meters (m): a grapefruit is 0.254 m and a bacterium is 0.000001 m. Clearly, the grapefruit is larger than the bacterium, and we can find exactly how much larger by dividing the two sizes: (0.254 m)/(0.000001 m) = 254,000. Dividing the two sizes (or taking the ratio) shows that the grapefruit is 254,000 times larger than the bacterium. We could still use a way to simply our notation, as it's easy to accidentally leave off one of the zeroes in the size of the bacterium. That's where "powers of ten" notation becomes useful.
Powers of Ten
Scaling to the largest sizes we will consider, a galaxy is a vast collection of stars that are held together by gravity. The length of a typical spiral galaxy, like the Milky Way, is about 1,000,000,000,000,000,000,000 meters (m), or a billion trillion m. This is a huge number, with 21 zeros after the one (this length is called a sextillion meters). The number may seem more intuitive when expressed as one billion trillion, as billion and trillion are familiar values that show up in our daily life (for example, billionaires are often in the news, and although no trillionaires yet exist, we intuitively know how much money they would have). When writing these numbers the prefixes M and G are sometimes used, where M stands for a million or the prefix "Mega" and G for a billion or the prefix "Giga".
One additional way to express these number is by using powers of ten. A million expressed in powers of ten is 106, since there are 6 zeros. Similarly, the Milky Way’s size can be written as 1021 m. There is also a prefix for 1021, called zetta and abbreviated by a Z. The Milky Way’s size can be expressed as 1021 m, 1 Zm or 1 sextillion m. This link to the National Institute of Standards and Technology lists the common prefixes that we use. In this table, we see that a yoctosecond is a very small measure of time – it is a mere septillionth of a second or 10-24 s. We will make regular use of powers of ten notation in this course, as we will be dealing with immensely large and small numbers.
In the context of comparing such a wide range of phenomena as this subject warrants, a good first step is to estimate the order of magnitude of the scale of an object. The easiest way to do this is to write the measurement in scientific notation and consider only the exponent. Notice that we need to identify the units of measurement as well as the order of magnitude to avoid ambiguity.
To get a better feel for very large and very small numbers in nature, the following film, created by Charles and Ray Eames in the 1970s, explores the very largest and very smallest numbers using powers of ten. Note that since the creation of this film, scientific advances have aided in the more complete understanding of the largest and smallest scales so that we now have more exacting probes of the largest scales and the smallest scales shown in the film. Our maps of galaxy clusters and investigations to the observable limits of our universe have improved to the extent that we can accurately identify the distribution of millions of galaxies while our understanding of the standard model of particle physics has been confirmed down to the centers of atomic nuclei.
https://www.youtube.com/watch?v=0fKBhvDjuy0
Copyright © Eames Office, LLC. All rights reserved.
The smallest measurable sizes bring us inside the nucleus of an atom, where subatomic particles called protons, with a size of just 10-15 m, are found. On the largest scale, the size of the observable universe is estimated to be about 1026 m. These are such vastly different sizes it is hard to even imagine comparing them, but it can be done very simply. The question of “how many times larger” one object is compared to another object can be found by dividing the two numbers: 1026 m/10-15 m = 1041 (for a review on working with powers of ten and scientific notation, please see Appendix B). The answer tells us that the observable universe is 1041 times larger, or “41 powers of ten,” larger than a proton. This can also be stated by saying that the universe is 41 orders of magnitude larger than a proton.
This type of analysis is powerful. Compared to the entire size of an atom, the nucleus is about 10,000 times smaller (104, or 4 orders of magnitude). This tells us that an atom – the fundamental building block of matter – is mostly empty space. The universe, it turns out, is also filled with huge voids of empty space.
Concept Check: Exponential sizes
Storage devices come in different sizes, and a small flash drive might have 64 MB of space and a large drive could have 500 GB. The small flash drive has 64 million bytes of space, where a million is 1,000,000 – one with six zeros. The "M "in MB stands for the prefix Mega, meaning million, and "B" is the abbreviation for bytes. Note that G is the prefix Giga, meaning billion.
To compare the size of a 512 MB flash drive to a 64 MB flash drive, this can answered in one step by dividing the two sizes: 512 MB/64 MB = 8. The 512 MB is eight times larger than the 64 MB drive. To state it another way, you would need eight 64 MB drives to equal one 512 MB drive. Notice that the answer, eight, has no units (or, we say is “dimensionless”). This makes sense – since both sizes are in MB, we compared “apples to apples”.
If the question asked how many times larger a 512 GB drive is compared to a 64 MB drive, you would need to make the units agree before dividing the numbers. Do this!
Show Solution
There are a few different ways to approach this: you could convert from GB to MB, from MB to GB, or convert both units into B. Let's convert 512 GB into MB, so that both quantities will have the same units:
512 GB × (103 MB/1 GB) = 512×103 MB
Now, we can divide the two quantities since they are both in MB: (512,000 MB/64 MB) = 8000
It takes eight thousand 64 MB flash drives to equal one 512 GB drive.
If the conversion directly from GB to MB was not clear, we can do this in two steps:
512 GB × (109 B/1 GB) × (1 MB/106 B) = 512×109×10-6 B = 512×103 MB = 512,000 MB
Stars
The power of a star can be measured in Watts (W), just like light bulbs. The Sun's power output is 3.8×1026 W and the power of the star Arcturus is 6.5×1028 W.
(a) How many times more powerful is Arcturus than the Sun? (b) How many times less powerful is the Sun than Arcturus?
Show Answer
(a) We can simply divide the power of Arcturus by the power of the Sun to find this:
(6.5×1028 W)/(3.8×1026 W) = 171
(b) 0.0058 or (1/171)
Light Units and Speed
To explore the chemistry and possible biology of other worlds, ideally we would send humans there to run experiments. Humans have been to the Moon to collect rocks, and there are currently several rovers that are controlled from Earth analyzing rocks and soil on the surface of Mars. There are plans to send humans to Mars in the next decade or two. Why not send humans sooner? There turn out to be many challenges to physically traveling beyond the Earth, but the distances involved are foremost.
We are familiar with long distances on Earth. The distance from NYC to Sydney, Australia is about 10,000 miles (16,000 km) and a typical jet flies at a speed of 575 mph, so this flight takes over 17 hours. How about the distance from Earth to the Moon or Mars? The Moon is around 240,000 miles (384,000 km) away and Mars is over 200 million miles from Earth. In 2020, the Perseverance spacecraft travelled at 24,600 mph to Mars and still took about 7 months to get there. The amount of time it takes to travel somewhere is the distance divided by the speed you are traveling, or:
time = (distance)/(speed)
If you are traveling to a place 30 miles away at a steady speed of 60 mph, then it takes you (30 miles)/(60 mph) = 0.5 hour to get there.
Concept Check: Distances, speed and time
If it takes 18 days for a rover moving at a steady speed to travel a distance of 6 km, how fast was the rover moving?
Show Answer
speed = (distance)/(time)
speed =(6 km)/(18 hours) = 1/3 km/hr = 0.33 km/hr
In fact, this is the maximum speed that the Perseverance rover can reach.
Perhaps you can just travel at faster speeds to get someplace far, like Mars, more quickly? While this idea works well for speeds on Earth (and hence we have supersonic jets and bullet trains), there is a limit to how fast anything can travel. This cosmic speed limit is called the speed of light, and nothing can travel faster. In fact, only light, which has no mass, can travel at the speed of light; any object with mass can never reach this speed due to the effects of Einstein’s theory of special relativity. So, the fastest possible way to reach a distant world is to send light. This may not seem very helpful at first, but light can contain information – think about radio or TV signals – so this is a potential way to send communications to distant worlds.
How long would light take to reach Mars? The speed of light, which is denoted by the symbol c, can be expressed in any units, such as km/hr, mph, or feet/s. Two common choices are m/s and km/s:
c = 300,000 km/s = 3×10⁵ km/s = 3×10⁸ m/s
(For comparison, a variety of speeds that we may encounter in astrobiology are listed in Table 2.) The distance to Mars when it is closest to the Earth is 55 million km. Using the simple relationship for time, distance, and speed, we arrive at an answer of 183 seconds. That’s fast – only about 3 minutes! And definitely faster than the 7 months the Perseverance spacecraft took. This way of thinking about distances, times, and the speed of light is so useful, in fact, that astronomers often use light units to express distances. The Sun is 93 million miles away from Earth. If we do the same calculation for how long light from the Sun takes to reach us on Earth, it is 8 minutes. That’s about three times as long as light takes to get to and from Mars. We can now express the distances d to the Sun and Mars, in light units: dSun = 8 light minutes and dMars = 3 light minutes
| Scenario | Speed | Scenario | Speed |
| Drift speed of the continents | 3 × 10⁻⁹ m/s | Orbital speed of the Earth around the Sun | 30 km/s |
| Growth speed of human hair | 5 × 10⁻⁹ m/s | Escape speed from the Solar System (at the distance of Earth) | 40 km/s |
| Automobile | 100 km/hour = 28 m/s | Fastest human-made object | 110 km/s |
| Rotational speed of the Earth at the Equator | 1700 km/hour = 480 m/s | Orbital speed of the Sun around the Galaxy | 220 km/s |
| Orbital speed in low-Earth orbit | 8 km/s | Escape speed from the Galaxy (at the location of the Sun) | 310 km/s |
| Escape speed at Earth's surface | 11 km/s | Speed of light = c | 3 × 10⁵ km/s |
Worked Example: Light Units
Show that 1 light year is equal to 9.46 trillion km.
Recall that a light year is the distance that light travels in 1 year. We can use the relationship between time, distance and speed, along with unit conversions, to show this.
distance = (speed)×(time)
Here, we know the speed--the speed of light--and can express it in any units...let's use km/s, since the answer is in units of km. In the equation below, we use 3×10⁵ km/s for the speed. For the time, we use 1 year and convert this to seconds.
distance = (3×10⁵ km/s)×(1 year)
distance = (3×10⁵ km/s)×(1 year)×(365 days/1 yr)×(24 hours/1 day)×(60 min/1 hr)×(60 sec/1 min) = 9.46×10¹² km
Recall that a light year is the distance that light travels in 1 year. We can use the relationship between time, distance and speed, along with unit conversions, to show this.
distance = (speed)×(time)
Here, we know the speed--the speed of light--and can express it in any units...let's use km/s, since the answer is in units of km. In the equation below, we use 3×10⁵ km/s for the speed. For the time, we use 1 year and convert this to seconds.
distance = (3×10⁵ km/s)×(1 year)
distance = (3×10⁵ km/s)×(1 year)×(365 days/1 yr)×(24 hours/1 day)×(60 min/1 hr)×(60 sec/1 min) = 9.46×10¹² km
This is equal to 9.46 trillion km.
How long does it take light from the Sun to reach Saturn, in minutes?
Start with the average distance from the Sun to Saturn in km, which is 1.4 billion km.
Show Answer
Light from the Sun is traveling at the speed of light, or 3×10⁵ km/s.
time = (distance)/(speed) = (1.4×10⁹ km)/(3×105 km/s) = 4,667 seconds
(4667 sec)(1 min/60 sec) = 78 minutes
We can thus say that Saturn is 78 light minutes away from the Sun.
How about the closest star to the Sun? That’s a red star named Proxima Centauri, and it is staggering 40,208,000,000,000 km (40 trillion km or 4×10¹³ km) away. In light units, however, this distance is 4 light years. It takes light 4 years to reach Proxima Centauri. The distances in light units to some nearby astronomical objects are shown in Figure 4. Light units are very convenient for expressing distances to stars that have intriguing planets orbiting them, as this tells us how long a radio signal would take to arrive at the star system. Also, light units remind us that we have a way of looking into the past! Notice in Figure 4 that the Andromeda galaxy is 2.5 million light years away. This means that light from Andromeda takes 2.5 million years to reach us, and that consequently we are seeing Andromeda as it looked 2.5 million years ago. This gives astronomers a way to see how the oldest galaxies in the universe, that are more than 13 billion light years away, looked when they were very young!
Concept Check: Distances
In Figure 4, the distance of 12 light minutes from Earth to Mars is actually the average, as the distance from Earth to Mars varies from 3 light minutes to 22 light minutes (at the furthest distance, it is on the opposite side of the Sun compared to Earth). When Mars and the Earth are at their closest distance, how long does it take light from the Sun to reach Mars?
It may help to make a sketch of the alignment of the Sun, Mars and Earth when Mars and Earth are closest to each other.
Show Sketch and Answer
The left panel shows the alignment of the Sun, Earth, and Mars when Mars is closest to the Earth. The time for sunlight to reach the Earth is 8 light minutes and the time for light to travel from Earth to Mars is 3 light minutes at closest approach. Thus, the total time is 8 light min + 3 light min = 11 light min
Other units of distance in astronomy
If you look up the distance to an astronomical object, the units will vary. For example, the distance to the star Vega might be reported in light years or parsecs -- it is 25 light years away which is the same as 7.8 parsecs. The Oort cloud surrounding our solar system is 50,000 AU away. Let's introduce these units as well.
Astronomical Units
When reporting distances within solar systems, astronomical units (AU) are typically used. One AU is defined to be the average distance from the Earth to the Sun. Mercury and Venus are closer to the Sun than the Earth and thus have distances in AU that are less than 1 AU. Saturn is at about 10 AU from the Sun and Neptune is at 30 AU.
When you read about the distance of an exoplanet from its host star, these are also reported in AU and have the exact same meaning as in our solar system. The exoplanet Proxima b orbits the red star Proxima Centauri, and Proxima b is an average distance of 0.0485 AU away from Proxima Centauri. This means Proxima b is very close to its star: it is nearly 2 orders of magnitude closer to Proxima Centauri than the Earth is from the Sun.
Parsecs
Parsecs (abbreviated pc) and light years have similar values:
1 pc = 3.26 light years
It is usually a matter of context in deciding which units to use although it is usually more intuitive for students to use light units.
The word parsec is a portmanteau of the words "parallax" and "arcsecond" and is defined as "the distance at which we have a parallax of one second." Parallax is an angular measure, meaning it has units of degrees or radians (or arcminutes and arcseconds). The apparent shift in the direction of an object as a result of the motion of the observer is called parallax. We call the shift in the apparent direction of a star due to Earth’s orbital motion stellar parallax. The Greeks made dedicated efforts to observe stellar parallax, even enlisting the aid of Greek soldiers with the clearest vision, but to no avail. The brighter (and presumably nearer) stars just did not seem to shift as the Greeks observed them in the spring and then again in the fall (when Earth is on the opposite side of the Sun). In reality, stellar parallax angles were too small to measure with scientific instruments until the 19th century.
Concept Check: Angular Units
The basis for angular units is that there are 360° or 2$\pi$ radians in a full circle. Arcseconds and arcminutes are simply divisions of a degree into smaller units, where 1 degree contains 60 arcminutes (abbreviated as 60$'$) and 1 arcminute contains 60 arcseconds (abbreviated as 60$''$).
The best way to visualize parallax angles is to hold up something like a pencil at a distance of just a few inches from your nose. Now, hold up another pencil at the greatest distance that you can reach (as demonstrated below). If you wink your eyes (left then right), you'll see that the pencil that is closest to your face appears to have a much larger shift (right to left) than the distant pencil.
We use the same principle to measure distances to stars. Stars that are close to us will have larger parallaxes than more distant stars. Winking our eyes won't work for this measurement because the baseline (the distance between our eyes) is too small. Instead, we use the baseline of the Earth's orbit to see apparent position of the foreground stars jump relative to the background stars.
The parallax angle is abbreviated as p . It can be shown using simple trigonometry that the distance to a star is inversely proportional to its parallax angle:
$$d = \frac{1}{p}$$
where \(p\) is reported in arcseconds and \(d\) is given in parsecs.
Key Concepts and Summary
The scale of space and time in the universe is so enormous that we need strategies to organize a basic understanding of where and when. The cosmic calendar re-scales the 13.8 billion year age of the universe into a "cosmic year", effectively capturing the timing for the rise of life and the very recent appearance of modern humans. The exponential spatial scale of the universe is captured as powers of ten, to compare the smallest and largest sizes and distances. A common unit for distances is light travel time: light could travel the circumference of the Earth seven times in just one second. It takes light 8 minutes to travel from the Sun to the Earth; 4.3 years to travel from Earth to the nearest star system, alpha Centauri, and 2.5 million years to travel to the closest spiral galaxy, Andromeda. Another important distance scale in astronomy is the distance from the Sun to the Earth: 1 Astronomical Unit or 1 AU. As we look out into the universe, determining the distances to other stars is accomplished with high school level trigonometry: measuring the shift of foreground stars relative to more distant stars.
Review Questions
Summary Questions
- How does the "cosmic calendar" help in understanding when key events happened for the development of life on Earth?
- How do you compare the size (or any property) of two objects using powers of ten?
- How does the smallest size we can observe compare with the largest size? Give an example of two objects that vary by 8 orders of magnitude. How about 17 orders of magnitude?
- What are light units? Why is it convenient for astronomers to use light units when expressing distances?
- How many light years are there in 1 parsec? Describe the unit parsec and why it is named the way it is.
- How can parallax be used to estimate the distance to an object?
Exercises
- Using the speed in Table 2, how long will your hair grow in one month?
- The Voyager 1 spacecraft is traveling at a speed of 38,000 miles per hour (17 km/s). Express this speed in light years per second (ly/s). How long would it take Voyager 1 to reach the closest star to the Sun, Proxima Centauri, which is 4.3 light years away?
- There are some additional exercises using powers of ten and scientific notation here (with solutions).
To approach the subject of astrobiology – specifically, of exploring possibilities that other life exists beyond the Earth – it is worthwhile to ponder the size and age of the cosmos. In this grand scheme, when and where did life on Earth first appear? The moment when the first life appeared is not precisely known, but several lines of evidence provide compelling clues for the timing of the rise of life on Earth.
Learning Objectives
By the end of this chapter, you will be able to:
- Explain the idea of the "cosmic calendar" and the timing of key events for life
- Express small and large numbers using powers of ten
- Describe the range of sizes for objects in the universe
- Explain light units such as light years and light seconds
The Big Bang and the Expanding Universe
Hubble's Law
In 1929, Edwin Hubble published a now-famous paper in the Publications of the National Academy of Science titled, "A Relation between Distance and Radial Velocity in Extragalactic Nebulae.'' As mentioned in the previous chapter, this work showed that M31 and M33 were beyond the known boundaries of our galaxy. In this paper he included a Table of data (reproduced below) showing distances, r, and radial velocities, v, to a couple of dozen "extragalactic nebulae,'' objects that we now understand to be other galaxies.
The "radial'' velocity is the component of velocity along our line of sight to an object. We defer a discussion of how the galactic velocities were measured to the chapter on spectroscopy, but for now, trust us... measuring radial velocities of galaxies is bread-and-butter astronomy.
Hubble sorted the galaxies by distance and immediately noticed a correlation: the more distant galaxies generally had larger radial velocities than closer galaxies. It was also clear that most galaxies - especially those at large distances - are moving away from us (by convention, positive velocities recede from us and negative velocities approach us). A few scientists of the day had already predicted this result as a critical test for a Big Bang.
Hubble plotted up his data and derived the best-fit linear velocity-distance relation. There is some scatter in Hubble's diagram. Some of this was the result of errors in the data, particularly the distances to galaxies. However, our Milky Way is one of a few dozen galaxies in what we call the Local Group. Galaxies in clusters are gravitationally bound and have orbital velocities that are larger than velocities from the expansion of the universe. Some of the velocities of galaxies in the Local Group (like the Andromeda Galaxy) are directed toward us -- those galaxies have negative velocities. Hubble's law really applies only to distant galaxies beyond the Local Group.
The speed with which galaxies are moving apart is called the recession speed. Let's think about what this linear relation between distance and recession speed means. Imagine that Galaxy A is initially at a distance d, and Galaxy B is initially at a distance 2d. Now, let enough time pass so that Galaxy A is at a distance 2d. If the expansion of space is constant everywhere, then Galaxy B will have moved to a distance 4d in that same time interval. Speed is distance divided by time; since Galaxy B travels twice the distance of Galaxy A in the same time interval, it must be traveling at twice the speed. When the expansion of the universe is constant, distance is proportional to recession velocity.
Concept Check
Can you think of how it might be possible to deduce the age of the universe from Hubble's data?
At first glance, it is tempting to conclude that the universe is expanding away from us - that we are the center of the universe. In fact, there is nothing special about our place in the universe. From the perspective of observers in every galaxy, most other galaxies seem to be receding. Indeed, alien astronomers in other galaxies have probably already published these same results, showing the relation between the distance and velocity of other galaxies. Like Hubble, they will know that they are not at the center of the universe.
The linear relationship between distance and recession velocity in Hubble's diagram (above) is expressed by a simple equation:
$$v = H_0 d$$
The astute reader will immediately recognize this as the equation of a straight line: Here, H0 is the slope of the line and the y-intercept is zero. This equation says that the recession velocity of a galaxy is proportional to its distance. The constant of proportionality, H0, is called Hubble's constant. Mathematically, it is the slope of the line in the velocity-distance relation. The units of H0 are physically meaningful: they have units of speed per distance (typically, km/s per megaparsec, Mpc). Assuming that Hubble's constant is really constant (i.e., not changing over time), then once this value is determined, you can measure the velocity of a galaxy (with spectroscopy) to derive its distance. Galaxies with larger velocities are farther away. So, Equation 1 is a powerful way to estimate distances to other galaxies. But, keep in mind the chicken and egg problem - we had to measure velocities and distances for some galaxies to derive the Hubble relationship. Once that was done, we were able to lean on the linear model to find distances to other galaxies.
The Hubble constant tells us something rather surprising. The units of 1/H0, (or distance / velocity) are time, and this "time'' is none other than the age of the universe. It is incredible that we can calculate the slope of the line in Hubble's data and solve for the age of the universe. The only rookie mistake has to do with the units - make sure that the speed (distance per time - usually km/s) and distance (usually Mpc) are converted to the same units so that distance really cancels out. And then, you will want to convert to more useful units than seconds: years or billions of years.
So, to recap, Edwin Hubble measured distances to the nearest galaxies, proving that they were outside of the Milky Way. He measured the velocities of other galaxies and found a correlation between distance and recession speed, providing observational evidence that the universe is expanding, and yielding an estimate for the age of the universe. This work provided a resolution to Olbers' paradox: the universe is not infinitely old (we can calculate its age), and because it is expanding, the light from stars in the most distant galaxies has been redshifted out of the optical bandpass (a concept we will discuss more in later chapters). Hubble's work changed our perspective of our place in the universe, and astronomers honored his contributions by naming a space observatory after him: the Hubble Space Telescope (HST) has been a workhorse telescope for the community since the mid-1990's.
We started with a presentation of Edwin Hubble's observations of the expanding universe because it was intuitively easy to understand. However, the Belgian priest George Lemaitre deserves a lot of credit for pioneering modern cosmology. In 1927, two years before Hubble's famous paper, Lemaitre published a paper with the rather wordy title: "A homogeneous universe of constant mass and growing radius accounting for the radial velocity of extragalactic nebulae." We now know Lemaitre's model as "Hubble's law" but it was Lemaitre who worked out the theory of the expanding universe with pencil and paper, based on Einstein's theory of general relativity. He proposed that the recession velocity of galaxies (extragalactic nebulae) could be explained by this expansion, and he derived the first estimate for the rate of expansion, which is now known as the Hubble constant, H0. Lemaitre gets extra credit for persisting in the face of a harsh critic; Einstein himself reportedly told him: "Sir, your calculations are correct, but your physics is atrocious." In the 1930's the idea that the universe was expanding was an extraordinary claim, and it would require extraordinary evidence (to borrow a phrase from Carl Sagan) before this theory was accepted. This evidence is described in the supplementary chapter "An Expanding Universe."
Our Place in Time: The Cosmic Calendar
The universe emerged at the moment of the Big Bang, 13.8 billion years ago. This is our starting point for time. Key events since this moment, including the formation of our galaxy and our solar system, can be identified in a memorable way by compressing all of time into one calendar year. This idea for the “cosmic calendar” was first articulated by astronomer Carl Sagan. On this cosmic calendar (Figure 1), each month represents a little over a billion years. Each day covers a span of around 40 million years. The very first stars and galaxies form in late January, and our home galaxy, the Milky Way, forms in early March. Our solar system comes on the scene in early September, and the first life on Earth probably formed by mid- to late-September.
Life starts as very simple cells and gradually evolves into more, with the first multicellular life appearing in November, and the first plants on December 20th. Primates, including humans, appear on December 31. In fact, modern humans show up on December 31, at 11:52 PM, which is on the order of the real-time equivalent of hundreds of thousands of years ago. In the bottom panel of Figure 1, which zooms in on the last 60 seconds on December 31, we see that all of modern science, including the development of both the telescope and microscope in the 17th century, happen in the last second at 11:59 PM.
There are a few ways to think about this time frame. On one hand, technologically advanced humans on Earth are newcomers. Humans have been sending out radio waves for less than one cosmic second. However, considering that the first life to appear on Earth took only a few cosmic weeks to form, perhaps the initial formation of life on other worlds will be a relatively speedy process. When considering just how many planets there are in the cosmos, it is tempting to think that the odds of life existing on at least one other planet are good.
Our Place in Space
Space also emerged at the moment of the Big Bang, and it has been expanding ever since. Contemplating the size of the cosmos can seem mind-bending but we can ground ourselves by starting with some size comparisons of more familiar objects. When comparing the sizes of two objects, a good first step is to be clear as to what is being compared, as the word size can mean different things -- length and volume, for example, are do not measure the same thing. Here, let's compare the length of some different objects, where the length is the distance from one end to the other end. Of course not all objects are symmetric so you may need to be more specific about how you are defining length, depending on what is being compared. For example, bacteria come in different shapes, such as rods, spheres, and spirals. In specifying a bacterium’s size, you would need to be clear about the start and end points of the measurement. In astronomy, galaxies also come in different shapes – ellipsoids, spirals, and irregular shapes – so it is important to know which dimension (say left to right or top to bottom) the length is referring to.
Units of length are important to consider. Lengths and distances are one-dimensional measures and are expressed in units such as meters or miles. Of course, the length of any object can be expressed in any units: what's important is that the objects being compared have the same units. Let's compare the size of a grapefruit and a bacterium. The length of a typical grapefruit is around 10 inches, which is the same as 25.4 centimeters (cm), 0.254 meters (m), 0.000254 kilometers (km) or 0.000158 miles. These are all equivalent measures, and it is a matter of convenience when choosing units. When directly comparing two measurements, all that matters is that the units chosen for the grapefruit are the same as those for a bacterium. We know that bacteria are very small, and a typical size is reported in units of micrometers (μm), where the prefix micro indicates 0.000001 meters. So, we can compare a grapefruit and a bacterium using meters (m): a grapefruit is 0.254 m and a bacterium is 0.000001 m. Clearly, the grapefruit is larger than the bacterium, and we can find exactly how much larger by dividing the two sizes: (0.254 m)/(0.000001 m) = 254,000. Dividing the two sizes (or taking the ratio) shows that the grapefruit is 254,000 times larger than the bacterium. We could still use a way to simply our notation, as it's easy to accidentally leave off one of the zeroes in the size of the bacterium. That's where "powers of ten" notation becomes useful.
Powers of Ten
Scaling to the largest sizes we will consider, a galaxy is a vast collection of stars that are held together by gravity. The length of a typical spiral galaxy, like the Milky Way, is about 1,000,000,000,000,000,000,000 meters (m), or a billion trillion m. This is a huge number, with 21 zeros after the one (this length is called a sextillion meters). The number may seem more intuitive when expressed as one billion trillion, as billion and trillion are familiar values that show up in our daily life (for example, billionaires are often in the news, and although no trillionaires yet exist, we intuitively know how much money they would have). When writing these numbers the prefixes M and G are sometimes used, where M stands for a million or the prefix "Mega" and G for a billion or the prefix "Giga".
One additional way to express these number is by using powers of ten. A million expressed in powers of ten is 106, since there are 6 zeros. Similarly, the Milky Way’s size can be written as 1021 m. There is also a prefix for 1021, called zetta and abbreviated by a Z. The Milky Way’s size can be expressed as 1021 m, 1 Zm or 1 sextillion m. This link to the National Institute of Standards and Technology lists the common prefixes that we use. In this table, we see that a yoctosecond is a very small measure of time – it is a mere septillionth of a second or 10-24 s. We will make regular use of powers of ten notation in this course, as we will be dealing with immensely large and small numbers.
In the context of comparing such a wide range of phenomena as this subject warrants, a good first step is to estimate the order of magnitude of the scale of an object. The easiest way to do this is to write the measurement in scientific notation and consider only the exponent. Notice that we need to identify the units of measurement as well as the order of magnitude to avoid ambiguity.
To get a better feel for very large and very small numbers in nature, the following film, created by Charles and Ray Eames in the 1970s, explores the very largest and very smallest numbers using powers of ten. Note that since the creation of this film, scientific advances have aided in the more complete understanding of the largest and smallest scales so that we now have more exacting probes of the largest scales and the smallest scales shown in the film. Our maps of galaxy clusters and investigations to the observable limits of our universe have improved to the extent that we can accurately identify the distribution of millions of galaxies while our understanding of the standard model of particle physics has been confirmed down to the centers of atomic nuclei.
https://www.youtube.com/watch?v=0fKBhvDjuy0
Copyright © Eames Office, LLC. All rights reserved.
The smallest measurable sizes bring us inside the nucleus of an atom, where subatomic particles called protons, with a size of just 10-15 m, are found. On the largest scale, the size of the observable universe is estimated to be about 1026 m. These are such vastly different sizes it is hard to even imagine comparing them, but it can be done very simply. The question of “how many times larger” one object is compared to another object can be found by dividing the two numbers: 1026 m/10-15 m = 1041 (for a review on working with powers of ten and scientific notation, please see Appendix B). The answer tells us that the observable universe is 1041 times larger, or “41 powers of ten,” larger than a proton. This can also be stated by saying that the universe is 41 orders of magnitude larger than a proton.
This type of analysis is powerful. Compared to the entire size of an atom, the nucleus is about 10,000 times smaller (104, or 4 orders of magnitude). This tells us that an atom – the fundamental building block of matter – is mostly empty space. The universe, it turns out, is also filled with huge voids of empty space.
Concept Check: Exponential sizes
Storage devices come in different sizes, and a small flash drive might have 64 MB of space and a large drive could have 500 GB. The small flash drive has 64 million bytes of space, where a million is 1,000,000 – one with six zeros. The "M "in MB stands for the prefix Mega, meaning million, and "B" is the abbreviation for bytes. Note that G is the prefix Giga, meaning billion.
To compare the size of a 512 MB flash drive to a 64 MB flash drive, this can answered in one step by dividing the two sizes: 512 MB/64 MB = 8. The 512 MB is eight times larger than the 64 MB drive. To state it another way, you would need eight 64 MB drives to equal one 512 MB drive. Notice that the answer, eight, has no units (or, we say is “dimensionless”). This makes sense – since both sizes are in MB, we compared “apples to apples”.
If the question asked how many times larger a 512 GB drive is compared to a 64 MB drive, you would need to make the units agree before dividing the numbers. Do this!
Show Solution
There are a few different ways to approach this: you could convert from GB to MB, from MB to GB, or convert both units into B. Let's convert 512 GB into MB, so that both quantities will have the same units:
512 GB × (103 MB/1 GB) = 512×103 MB
Now, we can divide the two quantities since they are both in MB: (512,000 MB/64 MB) = 8000
It takes eight thousand 64 MB flash drives to equal one 512 GB drive.
If the conversion directly from GB to MB was not clear, we can do this in two steps:
512 GB × (109 B/1 GB) × (1 MB/106 B) = 512×109×10-6 B = 512×103 MB = 512,000 MB
Stars
The power of a star can be measured in Watts (W), just like light bulbs. The Sun's power output is 3.8×1026 W and the power of the star Arcturus is 6.5×1028 W.
(a) How many times more powerful is Arcturus than the Sun? (b) How many times less powerful is the Sun than Arcturus?
Show Answer
(a) We can simply divide the power of Arcturus by the power of the Sun to find this:
(6.5×1028 W)/(3.8×1026 W) = 171
(b) 0.0058 or (1/171)
Light Units and Speed
To explore the chemistry and possible biology of other worlds, ideally we would send humans there to run experiments. Humans have been to the Moon to collect rocks, and there are currently several rovers that are controlled from Earth analyzing rocks and soil on the surface of Mars. There are plans to send humans to Mars in the next decade or two. Why not send humans sooner? There turn out to be many challenges to physically traveling beyond the Earth, but the distances involved are foremost.
We are familiar with long distances on Earth. The distance from NYC to Sydney, Australia is about 10,000 miles (16,000 km) and a typical jet flies at a speed of 575 mph, so this flight takes over 17 hours. How about the distance from Earth to the Moon or Mars? The Moon is around 240,000 miles (384,000 km) away and Mars is over 200 million miles from Earth. In 2020, the Perseverance spacecraft travelled at 24,600 mph to Mars and still took about 7 months to get there. The amount of time it takes to travel somewhere is the distance divided by the speed you are traveling, or:
time = (distance)/(speed)
If you are traveling to a place 30 miles away at a steady speed of 60 mph, then it takes you (30 miles)/(60 mph) = 0.5 hour to get there.
Concept Check: Distances, speed and time
If it takes 18 days for a rover moving at a steady speed to travel a distance of 6 km, how fast was the rover moving?
Show Answer
speed = (distance)/(time)
speed =(6 km)/(18 hours) = 1/3 km/hr = 0.33 km/hr
In fact, this is the maximum speed that the Perseverance rover can reach.
Perhaps you can just travel at faster speeds to get someplace far, like Mars, more quickly? While this idea works well for speeds on Earth (and hence we have supersonic jets and bullet trains), there is a limit to how fast anything can travel. This cosmic speed limit is called the speed of light, and nothing can travel faster. In fact, only light, which has no mass, can travel at the speed of light; any object with mass can never reach this speed due to the effects of Einstein’s theory of special relativity. So, the fastest possible way to reach a distant world is to send light. This may not seem very helpful at first, but light can contain information – think about radio or TV signals – so this is a potential way to send communications to distant worlds.
How long would light take to reach Mars? The speed of light, which is denoted by the symbol c, can be expressed in any units, such as km/hr, mph, or feet/s. Two common choices are m/s and km/s:
c = 300,000 km/s = 3×10⁵ km/s = 3×10⁸ m/s
(For comparison, a variety of speeds that we may encounter in astrobiology are listed in Table 2.) The distance to Mars when it is closest to the Earth is 55 million km. Using the simple relationship for time, distance, and speed, we arrive at an answer of 183 seconds. That’s fast – only about 3 minutes! And definitely faster than the 7 months the Perseverance spacecraft took. This way of thinking about distances, times, and the speed of light is so useful, in fact, that astronomers often use light units to express distances. The Sun is 93 million miles away from Earth. If we do the same calculation for how long light from the Sun takes to reach us on Earth, it is 8 minutes. That’s about three times as long as light takes to get to and from Mars. We can now express the distances d to the Sun and Mars, in light units: dSun = 8 light minutes and dMars = 3 light minutes
| Scenario | Speed | Scenario | Speed |
| Drift speed of the continents | 3 × 10⁻⁹ m/s | Orbital speed of the Earth around the Sun | 30 km/s |
| Growth speed of human hair | 5 × 10⁻⁹ m/s | Escape speed from the Solar System (at the distance of Earth) | 40 km/s |
| Automobile | 100 km/hour = 28 m/s | Fastest human-made object | 110 km/s |
| Rotational speed of the Earth at the Equator | 1700 km/hour = 480 m/s | Orbital speed of the Sun around the Galaxy | 220 km/s |
| Orbital speed in low-Earth orbit | 8 km/s | Escape speed from the Galaxy (at the location of the Sun) | 310 km/s |
| Escape speed at Earth's surface | 11 km/s | Speed of light = c | 3 × 10⁵ km/s |
Worked Example: Light Units
Show that 1 light year is equal to 9.46 trillion km.
Recall that a light year is the distance that light travels in 1 year. We can use the relationship between time, distance and speed, along with unit conversions, to show this.
distance = (speed)×(time)
Here, we know the speed--the speed of light--and can express it in any units...let's use km/s, since the answer is in units of km. In the equation below, we use 3×10⁵ km/s for the speed. For the time, we use 1 year and convert this to seconds.
distance = (3×10⁵ km/s)×(1 year)
distance = (3×10⁵ km/s)×(1 year)×(365 days/1 yr)×(24 hours/1 day)×(60 min/1 hr)×(60 sec/1 min) = 9.46×10¹² km
Recall that a light year is the distance that light travels in 1 year. We can use the relationship between time, distance and speed, along with unit conversions, to show this.
distance = (speed)×(time)
Here, we know the speed--the speed of light--and can express it in any units...let's use km/s, since the answer is in units of km. In the equation below, we use 3×10⁵ km/s for the speed. For the time, we use 1 year and convert this to seconds.
distance = (3×10⁵ km/s)×(1 year)
distance = (3×10⁵ km/s)×(1 year)×(365 days/1 yr)×(24 hours/1 day)×(60 min/1 hr)×(60 sec/1 min) = 9.46×10¹² km
This is equal to 9.46 trillion km.
How long does it take light from the Sun to reach Saturn, in minutes?
Start with the average distance from the Sun to Saturn in km, which is 1.4 billion km.
Show Answer
Light from the Sun is traveling at the speed of light, or 3×10⁵ km/s.
time = (distance)/(speed) = (1.4×10⁹ km)/(3×105 km/s) = 4,667 seconds
(4667 sec)(1 min/60 sec) = 78 minutes
We can thus say that Saturn is 78 light minutes away from the Sun.
How about the closest star to the Sun? That’s a red star named Proxima Centauri, and it is staggering 40,208,000,000,000 km (40 trillion km or 4×10¹³ km) away. In light units, however, this distance is 4 light years. It takes light 4 years to reach Proxima Centauri. The distances in light units to some nearby astronomical objects are shown in Figure 4. Light units are very convenient for expressing distances to stars that have intriguing planets orbiting them, as this tells us how long a radio signal would take to arrive at the star system. Also, light units remind us that we have a way of looking into the past! Notice in Figure 4 that the Andromeda galaxy is 2.5 million light years away. This means that light from Andromeda takes 2.5 million years to reach us, and that consequently we are seeing Andromeda as it looked 2.5 million years ago. This gives astronomers a way to see how the oldest galaxies in the universe, that are more than 13 billion light years away, looked when they were very young!
Concept Check: Distances
In Figure 4, the distance of 12 light minutes from Earth to Mars is actually the average, as the distance from Earth to Mars varies from 3 light minutes to 22 light minutes (at the furthest distance, it is on the opposite side of the Sun compared to Earth). When Mars and the Earth are at their closest distance, how long does it take light from the Sun to reach Mars?
It may help to make a sketch of the alignment of the Sun, Mars and Earth when Mars and Earth are closest to each other.
Show Sketch and Answer
The left panel shows the alignment of the Sun, Earth, and Mars when Mars is closest to the Earth. The time for sunlight to reach the Earth is 8 light minutes and the time for light to travel from Earth to Mars is 3 light minutes at closest approach. Thus, the total time is 8 light min + 3 light min = 11 light min
Other units of distance in astronomy
If you look up the distance to an astronomical object, the units will vary. For example, the distance to the star Vega might be reported in light years or parsecs -- it is 25 light years away which is the same as 7.8 parsecs. The Oort cloud surrounding our solar system is 50,000 AU away. Let's introduce these units as well.
Astronomical Units
When reporting distances within solar systems, astronomical units (AU) are typically used. One AU is defined to be the average distance from the Earth to the Sun. Mercury and Venus are closer to the Sun than the Earth and thus have distances in AU that are less than 1 AU. Saturn is at about 10 AU from the Sun and Neptune is at 30 AU.
When you read about the distance of an exoplanet from its host star, these are also reported in AU and have the exact same meaning as in our solar system. The exoplanet Proxima b orbits the red star Proxima Centauri, and Proxima b is an average distance of 0.0485 AU away from Proxima Centauri. This means Proxima b is very close to its star: it is nearly 2 orders of magnitude closer to Proxima Centauri than the Earth is from the Sun.
Parsecs
Parsecs (abbreviated pc) and light years have similar values:
1 pc = 3.26 light years
It is usually a matter of context in deciding which units to use although it is usually more intuitive for students to use light units.
Key Concepts and Summary
The scale of space and time in the universe is so enormous that we need strategies to organize a basic understanding of where and when. The cosmic calendar re-scales the 13.8 billion year age of the universe into a "cosmic year", effectively capturing the timing for the rise of life and the very recent appearance of modern humans. The exponential spatial scale of the universe is captured as powers of ten, to compare the smallest and largest sizes and distances. A common unit for distances is light travel time: light could travel the circumference of the Earth seven times in just one second. It takes light 8 minutes to travel from the Sun to the Earth; 4.3 years to travel from Earth to the nearest star system, alpha Centauri, and 2.5 million years to travel to the closest spiral galaxy, Andromeda. Another important distance scale in astronomy is the distance from the Sun to the Earth: 1 Astronomical Unit or 1 AU.
Review Questions
Summary Questions
- How does the "cosmic calendar" help in understanding when key events happened for the development of life on Earth?
- How do you compare the size (or any property) of two objects using powers of ten?
- How does the smallest size we can observe compare with the largest size? Give an example of two objects that vary by 8 orders of magnitude. How about 17 orders of magnitude?
- What are light units? Why is it convenient for astronomers to use light units when expressing distances?
Exercises
- Using the speed in Table 2, how long will your hair grow in one month?
- The Voyager 1 spacecraft is traveling at a speed of 38,000 miles per hour (17 km/s). Express this speed in light years per second (ly/s). How long would it take Voyager 1 to reach the closest star to the Sun, Proxima Centauri, which is 4.3 light years away?
- There are some additional exercises using powers of ten and scientific notation here (with solutions).
ionized gas consisting mostly of charged particles
ionized gas consisting mostly of charged particles
To approach the subject of astrobiology – specifically, of exploring possibilities that other life exists beyond the Earth – it is worthwhile to ponder the size and age of the cosmos. In this grand scheme, when and where did life on Earth first appear? The moment when the first life appeared is not precisely known, but several lines of evidence provide compelling clues for the timing of the rise of life on Earth.
Learning Objectives
By the end of this chapter, you will be able to:
- Explain the idea of the "cosmic calendar" and the timing of key events for life
- Express small and large numbers using powers of ten
- Describe the range of sizes for objects in the universe
- Explain light units such as light years and light seconds
Our Place in Time: The Cosmic Calendar
The universe emerged at the moment of the Big Bang, 13.8 billion years ago. This is our starting point for time. Key events since this moment, including the formation of our galaxy and our solar system, can be identified in a memorable way by compressing all of time into one calendar year. This idea for the “cosmic calendar” was first articulated by astronomer Carl Sagan. On this cosmic calendar (Figure 1), each month represents a little over a billion years. Each day covers a span of around 40 million years. The very first stars and galaxies form in late January, and our home galaxy, the Milky Way, forms in early March. Our solar system comes on the scene in early September, and the first life on Earth probably formed by mid- to late-September.
Life starts as very simple cells and gradually evolves into more, with the first multicellular life appearing in November, and the first plants on December 20th. Primates, including humans, appear on December 31. In fact, modern humans show up on December 31, at 11:52 PM, which is on the order of the real-time equivalent of hundreds of thousands of years ago. In the bottom panel of Figure 1, which zooms in on the last 60 seconds on December 31, we see that all of modern science, including the development of both the telescope and microscope in the 17th century, happen in the last second at 11:59 PM.
There are a few ways to think about this time frame. On one hand, technologically advanced humans on Earth are newcomers. Humans have been sending out radio waves for less than one cosmic second. However, considering that the first life to appear on Earth took only a few cosmic weeks to form, perhaps the initial formation of life on other worlds will be a relatively speedy process. When considering just how many planets there are in the cosmos, it is tempting to think that the odds of life existing on at least one other planet are good.
The Big Bang and the Expanding Universe
Hubble's Law
In 1929, Edwin Hubble published a now-famous paper in the Publications of the National Academy of Science titled, "A Relation between Distance and Radial Velocity in Extragalactic Nebulae.'' As mentioned in the previous chapter, this work showed that M31 and M33 were beyond the known boundaries of our galaxy. In this paper he included a Table of data (reproduced below) showing distances, r, and radial velocities, v, to a couple of dozen "extragalactic nebulae,'' objects that we now understand to be other galaxies.
The "radial'' velocity is the component of velocity along our line of sight to an object. We defer a discussion of how the galactic velocities were measured to the chapter on spectroscopy, but for now, trust us... measuring radial velocities of galaxies is bread-and-butter astronomy.
Hubble sorted the galaxies by distance and immediately noticed a correlation: the more distant galaxies generally had larger radial velocities than closer galaxies. It was also clear that most galaxies - especially those at large distances - are moving away from us (by convention, positive velocities recede from us and negative velocities approach us). A few scientists of the day had already predicted this result as a critical test for a Big Bang.
Hubble plotted up his data and derived the best-fit linear velocity-distance relation. There is some scatter in Hubble's diagram. Some of this was the result of errors in the data, particularly the distances to galaxies. However, our Milky Way is one of a few dozen galaxies in what we call the Local Group. Galaxies in clusters are gravitationally bound and have orbital velocities that are larger than velocities from the expansion of the universe. Some of the velocities of galaxies in the Local Group (like the Andromeda Galaxy) are directed toward us -- those galaxies have negative velocities. Hubble's law really applies only to distant galaxies beyond the Local Group.
The speed with which galaxies are moving apart is called the recession speed. Let's think about what this linear relation between distance and recession speed means. Imagine that Galaxy A is initially at a distance d, and Galaxy B is initially at a distance 2d. Now, let enough time pass so that Galaxy A is at a distance 2d. If the expansion of space is constant everywhere, then Galaxy B will have moved to a distance 4d in that same time interval. Speed is distance divided by time; since Galaxy B travels twice the distance of Galaxy A in the same time interval, it must be traveling at twice the speed. When the expansion of the universe is constant, distance is proportional to recession velocity.
Concept Check
Can you think of how it might be possible to deduce the age of the universe from Hubble's data?
At first glance, it is tempting to conclude that the universe is expanding away from us - that we are the center of the universe. In fact, there is nothing special about our place in the universe. From the perspective of observers in every galaxy, most other galaxies seem to be receding. Indeed, alien astronomers in other galaxies have probably already published these same results, showing the relation between the distance and velocity of other galaxies. Like Hubble, they will know that they are not at the center of the universe.
The linear relationship between distance and recession velocity in Hubble's diagram (above) is expressed by a simple equation:
$$v = H_0 d$$
The astute reader will immediately recognize this as the equation of a straight line: Here, H0 is the slope of the line and the y-intercept is zero. This equation says that the recession velocity of a galaxy is proportional to its distance. The constant of proportionality, H0, is called Hubble's constant. Mathematically, it is the slope of the line in the velocity-distance relation. The units of H0 are physically meaningful: they have units of speed per distance (typically, km/s per megaparsec, Mpc). Assuming that Hubble's constant is really constant (i.e., not changing over time), then once this value is determined, you can measure the velocity of a galaxy (with spectroscopy) to derive its distance. Galaxies with larger velocities are farther away. So, Equation 1 is a powerful way to estimate distances to other galaxies. But, keep in mind the chicken and egg problem - we had to measure velocities and distances for some galaxies to derive the Hubble relationship. Once that was done, we were able to lean on the linear model to find distances to other galaxies.
The Hubble constant tells us something rather surprising. The units of 1/H0, (or distance / velocity) are time, and this "time'' is none other than the age of the universe. It is incredible that we can calculate the slope of the line in Hubble's data and solve for the age of the universe. The only rookie mistake has to do with the units - make sure that the speed (distance per time - usually km/s) and distance (usually Mpc) are converted to the same units so that distance really cancels out. And then, you will want to convert to more useful units than seconds: years or billions of years.
So, to recap, Edwin Hubble measured distances to the nearest galaxies, proving that they were outside of the Milky Way. He measured the velocities of other galaxies and found a correlation between distance and recession speed, providing observational evidence that the universe is expanding, and yielding an estimate for the age of the universe. This work provided a resolution to Olbers' paradox: the universe is not infinitely old (we can calculate its age), and because it is expanding, the light from stars in the most distant galaxies has been redshifted out of the optical bandpass (a concept we will discuss more in later chapters). Hubble's work changed our perspective of our place in the universe, and astronomers honored his contributions by naming a space observatory after him: the Hubble Space Telescope (HST) has been a workhorse telescope for the community since the mid-1990's.
We started with a presentation of Edwin Hubble's observations of the expanding universe because it was intuitively easy to understand. However, the Belgian priest George Lemaitre deserves a lot of credit for pioneering modern cosmology. In 1927, two years before Hubble's famous paper, Lemaitre published a paper with the rather wordy title: "A homogeneous universe of constant mass and growing radius accounting for the radial velocity of extragalactic nebulae." We now know Lemaitre's model as "Hubble's law" but it was Lemaitre who worked out the theory of the expanding universe with pencil and paper, based on Einstein's theory of general relativity. He proposed that the recession velocity of galaxies (extragalactic nebulae) could be explained by this expansion, and he derived the first estimate for the rate of expansion, which is now known as the Hubble constant, H0. Lemaitre gets extra credit for persisting in the face of a harsh critic; Einstein himself reportedly told him: "Sir, your calculations are correct, but your physics is atrocious." In the 1930's the idea that the universe was expanding was an extraordinary claim, and it would require extraordinary evidence (to borrow a phrase from Carl Sagan) before this theory was accepted. This evidence is described in the supplementary chapter "An Expanding Universe."
Our Place in Space
Space also emerged at the moment of the Big Bang, and it has been expanding ever since. Contemplating the size of the cosmos can seem mind-bending but we can ground ourselves by starting with some size comparisons of more familiar objects. When comparing the sizes of two objects, a good first step is to be clear as to what is being compared, as the word size can mean different things -- length and volume, for example, are do not measure the same thing. Here, let's compare the length of some different objects, where the length is the distance from one end to the other end. Of course not all objects are symmetric so you may need to be more specific about how you are defining length, depending on what is being compared. For example, bacteria come in different shapes, such as rods, spheres, and spirals. In specifying a bacterium’s size, you would need to be clear about the start and end points of the measurement. In astronomy, galaxies also come in different shapes – ellipsoids, spirals, and irregular shapes – so it is important to know which dimension (say left to right or top to bottom) the length is referring to.
Units of length are important to consider. Lengths and distances are one-dimensional measures and are expressed in units such as meters or miles. Of course, the length of any object can be expressed in any units: what's important is that the objects being compared have the same units. Let's compare the size of a grapefruit and a bacterium. The length of a typical grapefruit is around 10 inches, which is the same as 25.4 centimeters (cm), 0.254 meters (m), 0.000254 kilometers (km) or 0.000158 miles. These are all equivalent measures, and it is a matter of convenience when choosing units. When directly comparing two measurements, all that matters is that the units chosen for the grapefruit are the same as those for a bacterium. We know that bacteria are very small, and a typical size is reported in units of micrometers (μm), where the prefix micro indicates 0.000001 meters. So, we can compare a grapefruit and a bacterium using meters (m): a grapefruit is 0.254 m and a bacterium is 0.000001 m. Clearly, the grapefruit is larger than the bacterium, and we can find exactly how much larger by dividing the two sizes: (0.254 m)/(0.000001 m) = 254,000. Dividing the two sizes (or taking the ratio) shows that the grapefruit is 254,000 times larger than the bacterium. We could still use a way to simply our notation, as it's easy to accidentally leave off one of the zeroes in the size of the bacterium. That's where "powers of ten" notation becomes useful.
Powers of Ten
Scaling to the largest sizes we will consider, a galaxy is a vast collection of stars that are held together by gravity. The length of a typical spiral galaxy, like the Milky Way, is about 1,000,000,000,000,000,000,000 meters (m), or a billion trillion m. This is a huge number, with 21 zeros after the one (this length is called a sextillion meters). The number may seem more intuitive when expressed as one billion trillion, as billion and trillion are familiar values that show up in our daily life (for example, billionaires are often in the news, and although no trillionaires yet exist, we intuitively know how much money they would have). When writing these numbers the prefixes M and G are sometimes used, where M stands for a million or the prefix "Mega" and G for a billion or the prefix "Giga".
One additional way to express these number is by using powers of ten. A million expressed in powers of ten is 106, since there are 6 zeros. Similarly, the Milky Way’s size can be written as 1021 m. There is also a prefix for 1021, called zetta and abbreviated by a Z. The Milky Way’s size can be expressed as 1021 m, 1 Zm or 1 sextillion m. This link to the National Institute of Standards and Technology lists the common prefixes that we use. In this table, we see that a yoctosecond is a very small measure of time – it is a mere septillionth of a second or 10-24 s. We will make regular use of powers of ten notation in this course, as we will be dealing with immensely large and small numbers.
In the context of comparing such a wide range of phenomena as this subject warrants, a good first step is to estimate the order of magnitude of the scale of an object. The easiest way to do this is to write the measurement in scientific notation and consider only the exponent. Notice that we need to identify the units of measurement as well as the order of magnitude to avoid ambiguity.
To get a better feel for very large and very small numbers in nature, the following film, created by Charles and Ray Eames in the 1970s, explores the very largest and very smallest numbers using powers of ten. Note that since the creation of this film, scientific advances have aided in the more complete understanding of the largest and smallest scales so that we now have more exacting probes of the largest scales and the smallest scales shown in the film. Our maps of galaxy clusters and investigations to the observable limits of our universe have improved to the extent that we can accurately identify the distribution of millions of galaxies while our understanding of the standard model of particle physics has been confirmed down to the centers of atomic nuclei.
https://www.youtube.com/watch?v=0fKBhvDjuy0
Copyright © Eames Office, LLC. All rights reserved.
The smallest measurable sizes bring us inside the nucleus of an atom, where subatomic particles called protons, with a size of just 10-15 m, are found. On the largest scale, the size of the observable universe is estimated to be about 1026 m. These are such vastly different sizes it is hard to even imagine comparing them, but it can be done very simply. The question of “how many times larger” one object is compared to another object can be found by dividing the two numbers: 1026 m/10-15 m = 1041 (for a review on working with powers of ten and scientific notation, please see Appendix B). The answer tells us that the observable universe is 1041 times larger, or “41 powers of ten,” larger than a proton. This can also be stated by saying that the universe is 41 orders of magnitude larger than a proton.
This type of analysis is powerful. Compared to the entire size of an atom, the nucleus is about 10,000 times smaller (104, or 4 orders of magnitude). This tells us that an atom – the fundamental building block of matter – is mostly empty space. The universe, it turns out, is also filled with huge voids of empty space.
Concept Check: Exponential sizes
Storage devices come in different sizes, and a small flash drive might have 64 MB of space and a large drive could have 500 GB. The small flash drive has 64 million bytes of space, where a million is 1,000,000 – one with six zeros. The "M "in MB stands for the prefix Mega, meaning million, and "B" is the abbreviation for bytes. Note that G is the prefix Giga, meaning billion.
To compare the size of a 512 MB flash drive to a 64 MB flash drive, this can answered in one step by dividing the two sizes: 512 MB/64 MB = 8. The 512 MB is eight times larger than the 64 MB drive. To state it another way, you would need eight 64 MB drives to equal one 512 MB drive. Notice that the answer, eight, has no units (or, we say is “dimensionless”). This makes sense – since both sizes are in MB, we compared “apples to apples”.
If the question asked how many times larger a 512 GB drive is compared to a 64 MB drive, you would need to make the units agree before dividing the numbers. Do this!
Show Solution
There are a few different ways to approach this: you could convert from GB to MB, from MB to GB, or convert both units into B. Let's convert 512 GB into MB, so that both quantities will have the same units:
512 GB × (103 MB/1 GB) = 512×103 MB
Now, we can divide the two quantities since they are both in MB: (512,000 MB/64 MB) = 8000
It takes eight thousand 64 MB flash drives to equal one 512 GB drive.
If the conversion directly from GB to MB was not clear, we can do this in two steps:
512 GB × (109 B/1 GB) × (1 MB/106 B) = 512×109×10-6 B = 512×103 MB = 512,000 MB
Stars
The power of a star can be measured in Watts (W), just like light bulbs. The Sun's power output is 3.8×1026 W and the power of the star Arcturus is 6.5×1028 W.
(a) How many times more powerful is Arcturus than the Sun? (b) How many times less powerful is the Sun than Arcturus?
Show Answer
(a) We can simply divide the power of Arcturus by the power of the Sun to find this:
(6.5×1028 W)/(3.8×1026 W) = 171
(b) 0.0058 or (1/171)
Light Units and Speed
To explore the chemistry and possible biology of other worlds, ideally we would send humans there to run experiments. Humans have been to the Moon to collect rocks, and there are currently several rovers that are controlled from Earth analyzing rocks and soil on the surface of Mars. There are plans to send humans to Mars in the next decade or two. Why not send humans sooner? There turn out to be many challenges to physically traveling beyond the Earth, but the distances involved are foremost.
We are familiar with long distances on Earth. The distance from NYC to Sydney, Australia is about 10,000 miles (16,000 km) and a typical jet flies at a speed of 575 mph, so this flight takes over 17 hours. How about the distance from Earth to the Moon or Mars? The Moon is around 240,000 miles (384,000 km) away and Mars is over 200 million miles from Earth. In 2020, the Perseverance spacecraft travelled at 24,600 mph to Mars and still took about 7 months to get there. The amount of time it takes to travel somewhere is the distance divided by the speed you are traveling, or:
time = (distance)/(speed)
If you are traveling to a place 30 miles away at a steady speed of 60 mph, then it takes you (30 miles)/(60 mph) = 0.5 hour to get there.
Concept Check: Distances, speed and time
If it takes 18 days for a rover moving at a steady speed to travel a distance of 6 km, how fast was the rover moving?
Show Answer
speed = (distance)/(time)
speed =(6 km)/(18 hours) = 1/3 km/hr = 0.33 km/hr
In fact, this is the maximum speed that the Perseverance rover can reach.
Perhaps you can just travel at faster speeds to get someplace far, like Mars, more quickly? While this idea works well for speeds on Earth (and hence we have supersonic jets and bullet trains), there is a limit to how fast anything can travel. This cosmic speed limit is called the speed of light, and nothing can travel faster. In fact, only light, which has no mass, can travel at the speed of light; any object with mass can never reach this speed due to the effects of Einstein’s theory of special relativity. So, the fastest possible way to reach a distant world is to send light. This may not seem very helpful at first, but light can contain information – think about radio or TV signals – so this is a potential way to send communications to distant worlds.
How long would light take to reach Mars? The speed of light, which is denoted by the symbol c, can be expressed in any units, such as km/hr, mph, or feet/s. Two common choices are m/s and km/s:
c = 300,000 km/s = 3×10⁵ km/s = 3×10⁸ m/s
(For comparison, a variety of speeds that we may encounter in astrobiology are listed in Table 2.) The distance to Mars when it is closest to the Earth is 55 million km. Using the simple relationship for time, distance, and speed, we arrive at an answer of 183 seconds. That’s fast – only about 3 minutes! And definitely faster than the 7 months the Perseverance spacecraft took. This way of thinking about distances, times, and the speed of light is so useful, in fact, that astronomers often use light units to express distances. The Sun is 93 million miles away from Earth. If we do the same calculation for how long light from the Sun takes to reach us on Earth, it is 8 minutes. That’s about three times as long as light takes to get to and from Mars. We can now express the distances d to the Sun and Mars, in light units: dSun = 8 light minutes and dMars = 3 light minutes
| Scenario | Speed | Scenario | Speed |
| Drift speed of the continents | 3 × 10⁻⁹ m/s | Orbital speed of the Earth around the Sun | 30 km/s |
| Growth speed of human hair | 5 × 10⁻⁹ m/s | Escape speed from the Solar System (at the distance of Earth) | 40 km/s |
| Automobile | 100 km/hour = 28 m/s | Fastest human-made object | 110 km/s |
| Rotational speed of the Earth at the Equator | 1700 km/hour = 480 m/s | Orbital speed of the Sun around the Galaxy | 220 km/s |
| Orbital speed in low-Earth orbit | 8 km/s | Escape speed from the Galaxy (at the location of the Sun) | 310 km/s |
| Escape speed at Earth's surface | 11 km/s | Speed of light = c | 3 × 10⁵ km/s |
Worked Example: Light Units
Show that 1 light year is equal to 9.46 trillion km.
Recall that a light year is the distance that light travels in 1 year. We can use the relationship between time, distance and speed, along with unit conversions, to show this.
distance = (speed)×(time)
Here, we know the speed--the speed of light--and can express it in any units...let's use km/s, since the answer is in units of km. In the equation below, we use 3×10⁵ km/s for the speed. For the time, we use 1 year and convert this to seconds.
distance = (3×10⁵ km/s)×(1 year)
distance = (3×10⁵ km/s)×(1 year)×(365 days/1 yr)×(24 hours/1 day)×(60 min/1 hr)×(60 sec/1 min) = 9.46×10¹² km
Recall that a light year is the distance that light travels in 1 year. We can use the relationship between time, distance and speed, along with unit conversions, to show this.
distance = (speed)×(time)
Here, we know the speed--the speed of light--and can express it in any units...let's use km/s, since the answer is in units of km. In the equation below, we use 3×10⁵ km/s for the speed. For the time, we use 1 year and convert this to seconds.
distance = (3×10⁵ km/s)×(1 year)
distance = (3×10⁵ km/s)×(1 year)×(365 days/1 yr)×(24 hours/1 day)×(60 min/1 hr)×(60 sec/1 min) = 9.46×10¹² km
This is equal to 9.46 trillion km.
How long does it take light from the Sun to reach Saturn, in minutes?
Start with the average distance from the Sun to Saturn in km, which is 1.4 billion km.
Show Answer
Light from the Sun is traveling at the speed of light, or 3×10⁵ km/s.
time = (distance)/(speed) = (1.4×10⁹ km)/(3×105 km/s) = 4,667 seconds
(4667 sec)(1 min/60 sec) = 78 minutes
We can thus say that Saturn is 78 light minutes away from the Sun.
How about the closest star to the Sun? That’s a red star named Proxima Centauri, and it is staggering 40,208,000,000,000 km (40 trillion km or 4×10¹³ km) away. In light units, however, this distance is 4 light years. It takes light 4 years to reach Proxima Centauri. The distances in light units to some nearby astronomical objects are shown in Figure 4. Light units are very convenient for expressing distances to stars that have intriguing planets orbiting them, as this tells us how long a radio signal would take to arrive at the star system. Also, light units remind us that we have a way of looking into the past! Notice in Figure 4 that the Andromeda galaxy is 2.5 million light years away. This means that light from Andromeda takes 2.5 million years to reach us, and that consequently we are seeing Andromeda as it looked 2.5 million years ago. This gives astronomers a way to see how the oldest galaxies in the universe, that are more than 13 billion light years away, looked when they were very young!
Concept Check: Distances
In Figure 4, the distance of 12 light minutes from Earth to Mars is actually the average, as the distance from Earth to Mars varies from 3 light minutes to 22 light minutes (at the furthest distance, it is on the opposite side of the Sun compared to Earth). When Mars and the Earth are at their closest distance, how long does it take light from the Sun to reach Mars?
It may help to make a sketch of the alignment of the Sun, Mars and Earth when Mars and Earth are closest to each other.
Show Sketch and Answer
The left panel shows the alignment of the Sun, Earth, and Mars when Mars is closest to the Earth. The time for sunlight to reach the Earth is 8 light minutes and the time for light to travel from Earth to Mars is 3 light minutes at closest approach. Thus, the total time is 8 light min + 3 light min = 11 light min
Other units of distance in astronomy
If you look up the distance to an astronomical object, the units will vary. For example, the distance to the star Vega might be reported in light years or parsecs -- it is 25 light years away which is the same as 7.8 parsecs. The Oort cloud surrounding our solar system is 50,000 AU away. Let's introduce these units as well.
Astronomical Units
When reporting distances within solar systems, astronomical units (AU) are typically used. One AU is defined to be the average distance from the Earth to the Sun. Mercury and Venus are closer to the Sun than the Earth and thus have distances in AU that are less than 1 AU. Saturn is at about 10 AU from the Sun and Neptune is at 30 AU.
When you read about the distance of an exoplanet from its host star, these are also reported in AU and have the exact same meaning as in our solar system. The exoplanet Proxima b orbits the red star Proxima Centauri, and Proxima b is an average distance of 0.0485 AU away from Proxima Centauri. This means Proxima b is very close to its star: it is nearly 2 orders of magnitude closer to Proxima Centauri than the Earth is from the Sun.
Parsecs
Parsecs (abbreviated pc) and light years have similar values:
1 pc = 3.26 light years
It is usually a matter of context in deciding which units to use although it is usually more intuitive for students to use light units.
Key Concepts and Summary
The scale of space and time in the universe is so enormous that we need strategies to organize a basic understanding of where and when. The cosmic calendar re-scales the 13.8 billion year age of the universe into a "cosmic year", effectively capturing the timing for the rise of life and the very recent appearance of modern humans. The exponential spatial scale of the universe is captured as powers of ten, to compare the smallest and largest sizes and distances. A common unit for distances is light travel time: light could travel the circumference of the Earth seven times in just one second. It takes light 8 minutes to travel from the Sun to the Earth; 4.3 years to travel from Earth to the nearest star system, alpha Centauri, and 2.5 million years to travel to the closest spiral galaxy, Andromeda. Another important distance scale in astronomy is the distance from the Sun to the Earth: 1 Astronomical Unit or 1 AU.
Review Questions
Summary Questions
- How does the "cosmic calendar" help in understanding when key events happened for the development of life on Earth?
- How do you compare the size (or any property) of two objects using powers of ten?
- How does the smallest size we can observe compare with the largest size? Give an example of two objects that vary by 8 orders of magnitude. How about 17 orders of magnitude?
- What are light units? Why is it convenient for astronomers to use light units when expressing distances?
Exercises
- Using the speed in Table 2, how long will your hair grow in one month?
- The Voyager 1 spacecraft is traveling at a speed of 38,000 miles per hour (17 km/s). Express this speed in light years per second (ly/s). How long would it take Voyager 1 to reach the closest star to the Sun, Proxima Centauri, which is 4.3 light years away?
- There are some additional exercises using powers of ten and scientific notation here (with solutions).
To approach the subject of astrobiology – specifically, of exploring possibilities that other life exists beyond the Earth – it is worthwhile to ponder the size and age of the cosmos. In this grand scheme, when and where did life on Earth first appear? The moment when the first life appeared is not precisely known, but several lines of evidence provide compelling clues for the timing of the rise of life on Earth.
Learning Objectives
By the end of this chapter, you will be able to:
- Explain the idea of the "cosmic calendar" and the timing of key events for life
- Express small and large numbers using powers of ten
- Describe the range of sizes for objects in the universe
- Explain light units such as light years and light seconds
Our Place in Time: The Cosmic Calendar
The universe emerged at the moment of the Big Bang, 13.8 billion years ago. This is our starting point for time. Key events since this moment, including the formation of our galaxy and our solar system, can be identified in a memorable way by compressing all of time into one calendar year. This idea for the “cosmic calendar” was first articulated by astronomer Carl Sagan. On this cosmic calendar (Figure 1), each month represents a little over a billion years. Each day covers a span of around 40 million years. The very first stars and galaxies form in late January, and our home galaxy, the Milky Way, forms in early March. Our solar system comes on the scene in early September, and the first life on Earth probably formed by mid- to late-September.
Life starts as very simple cells and gradually evolves into more, with the first multicellular life appearing in November, and the first plants on December 20th. Primates, including humans, appear on December 31. In fact, modern humans show up on December 31, at 11:52 PM, which is on the order of the real-time equivalent of hundreds of thousands of years ago. In the bottom panel of Figure 1, which zooms in on the last 60 seconds on December 31, we see that all of modern science, including the development of both the telescope and microscope in the 17th century, happen in the last second at 11:59 PM.
There are a few ways to think about this time frame. On one hand, technologically advanced humans on Earth are newcomers. Humans have been sending out radio waves for less than one cosmic second. However, considering that the first life to appear on Earth took only a few cosmic weeks to form, perhaps the initial formation of life on other worlds will be a relatively speedy process. When considering just how many planets there are in the cosmos, it is tempting to think that the odds of life existing on at least one other planet are good.
The Big Bang and the Expanding Universe
Hubble's Law
In 1929, Edwin Hubble published a now-famous paper in the Publications of the National Academy of Science titled, "A Relation between Distance and Radial Velocity in Extragalactic Nebulae.'' In this paper he included a Table of data (reproduced below) showing distances, r, and radial velocities, v, to a couple of dozen "extragalactic nebulae,'' objects that we now understand to be other galaxies.
The "radial'' velocity is the component of velocity along our line of sight to an object. We defer a discussion of how the galactic velocities were measured to the chapter on spectroscopy, but for now, trust us... measuring radial velocities of galaxies is bread-and-butter astronomy.
Hubble sorted the galaxies by distance and immediately noticed a correlation: the more distant galaxies generally had larger radial velocities than closer galaxies. It was also clear that most galaxies - especially those at large distances - are moving away from us (by convention, positive velocities recede from us and negative velocities approach us). A few scientists of the day had already predicted this result as a critical test for a Big Bang.
Hubble plotted up his data and derived the best-fit linear velocity-distance relation. There is some scatter in Hubble's diagram. Some of this was the result of errors in the data, particularly the distances to galaxies. However, our Milky Way is one of a few dozen galaxies in what we call the Local Group. Galaxies in clusters are gravitationally bound and have orbital velocities that are larger than velocities from the expansion of the universe. Some of the velocities of galaxies in the Local Group (like the Andromeda Galaxy) are directed toward us -- those galaxies have negative velocities. Hubble's law really applies only to distant galaxies beyond the Local Group.
The speed with which galaxies are moving apart is called the recession speed. Let's think about what this linear relation between distance and recession speed means. Imagine that Galaxy A is initially at a distance d, and Galaxy B is initially at a distance 2d. Now, let enough time pass so that Galaxy A is at a distance 2d. If the expansion of space is constant everywhere, then Galaxy B will have moved to a distance 4d in that same time interval. Speed is distance divided by time; since Galaxy B travels twice the distance of Galaxy A in the same time interval, it must be traveling at twice the speed. When the expansion of the universe is constant, distance is proportional to recession velocity.
Concept Check
Can you think of how it might be possible to deduce the age of the universe from Hubble's data?
At first glance, it is tempting to conclude that the universe is expanding away from us - that we are the center of the universe. In fact, there is nothing special about our place in the universe. From the perspective of observers in every galaxy, most other galaxies seem to be receding. Indeed, alien astronomers in other galaxies have probably already published these same results, showing the relation between the distance and velocity of other galaxies. Like Hubble, they will know that they are not at the center of the universe.
The linear relationship between distance and recession velocity in Hubble's diagram (above) is expressed by a simple equation:
$$v = H_0 d$$
The astute reader will immediately recognize this as the equation of a straight line: Here, H0 is the slope of the line and the y-intercept is zero. This equation says that the recession velocity of a galaxy is proportional to its distance. The constant of proportionality, H0, is called Hubble's constant. Mathematically, it is the slope of the line in the velocity-distance relation. The units of H0 are physically meaningful: they have units of speed per distance (typically, km/s per megaparsec, Mpc). Assuming that Hubble's constant is really constant (i.e., not changing over time), then once this value is determined, you can measure the velocity of a galaxy (with spectroscopy) to derive its distance. Galaxies with larger velocities are farther away. So, Equation 1 is a powerful way to estimate distances to other galaxies. But, keep in mind the chicken and egg problem - we had to measure velocities and distances for some galaxies to derive the Hubble relationship. Once that was done, we were able to lean on the linear model to find distances to other galaxies.
The Hubble constant tells us something rather surprising. The units of 1/H0, (or distance / velocity) are time, and this "time'' is none other than the age of the universe. It is incredible that we can calculate the slope of the line in Hubble's data and solve for the age of the universe. The only rookie mistake has to do with the units - make sure that the speed (distance per time - usually km/s) and distance (usually Mpc) are converted to the same units so that distance really cancels out. And then, you will want to convert to more useful units than seconds: years or billions of years.
So, to recap, Edwin Hubble measured distances to the nearest galaxies, proving that they were outside of the Milky Way. He measured the velocities of other galaxies and found a correlation between distance and recession speed, providing observational evidence that the universe is expanding, and yielding an estimate for the age of the universe. This work provided a resolution to Olbers' paradox: the universe is not infinitely old (we can calculate its age), and because it is expanding, the light from stars in the most distant galaxies has been redshifted out of the optical bandpass (a concept we will discuss more in later chapters). Hubble's work changed our perspective of our place in the universe, and astronomers honored his contributions by naming a space observatory after him: the Hubble Space Telescope (HST) has been a workhorse telescope for the community since the mid-1990's.
We started with a presentation of Edwin Hubble's observations of the expanding universe because it was intuitively easy to understand. However, the Belgian priest George Lemaitre deserves a lot of credit for pioneering modern cosmology. In 1927, two years before Hubble's famous paper, Lemaitre published a paper with the rather wordy title: "A homogeneous universe of constant mass and growing radius accounting for the radial velocity of extragalactic nebulae." We now know Lemaitre's model as "Hubble's law" but it was Lemaitre who worked out the theory of the expanding universe with pencil and paper, based on Einstein's theory of general relativity. He proposed that the recession velocity of galaxies (extragalactic nebulae) could be explained by this expansion, and he derived the first estimate for the rate of expansion, which is now known as the Hubble constant, H0. Lemaitre gets extra credit for persisting in the face of a harsh critic; Einstein himself reportedly told him: "Sir, your calculations are correct, but your physics is atrocious." In the 1930's the idea that the universe was expanding was an extraordinary claim, and it would require extraordinary evidence (to borrow a phrase from Carl Sagan) before this theory was accepted. This evidence is described in the supplementary chapter "An Expanding Universe."
Our Place in Space
Space also emerged at the moment of the Big Bang, and it has been expanding ever since. Contemplating the size of the cosmos can seem mind-bending but we can ground ourselves by starting with some size comparisons of more familiar objects. When comparing the sizes of two objects, a good first step is to be clear as to what is being compared, as the word size can mean different things -- length and volume, for example, are do not measure the same thing. Here, let's compare the length of some different objects, where the length is the distance from one end to the other end. Of course not all objects are symmetric so you may need to be more specific about how you are defining length, depending on what is being compared. For example, bacteria come in different shapes, such as rods, spheres, and spirals. In specifying a bacterium’s size, you would need to be clear about the start and end points of the measurement. In astronomy, galaxies also come in different shapes – ellipsoids, spirals, and irregular shapes – so it is important to know which dimension (say left to right or top to bottom) the length is referring to.
Units of length are important to consider. Lengths and distances are one-dimensional measures and are expressed in units such as meters or miles. Of course, the length of any object can be expressed in any units: what's important is that the objects being compared have the same units. Let's compare the size of a grapefruit and a bacterium. The length of a typical grapefruit is around 10 inches, which is the same as 25.4 centimeters (cm), 0.254 meters (m), 0.000254 kilometers (km) or 0.000158 miles. These are all equivalent measures, and it is a matter of convenience when choosing units. When directly comparing two measurements, all that matters is that the units chosen for the grapefruit are the same as those for a bacterium. We know that bacteria are very small, and a typical size is reported in units of micrometers (μm), where the prefix micro indicates 0.000001 meters. So, we can compare a grapefruit and a bacterium using meters (m): a grapefruit is 0.254 m and a bacterium is 0.000001 m. Clearly, the grapefruit is larger than the bacterium, and we can find exactly how much larger by dividing the two sizes: (0.254 m)/(0.000001 m) = 254,000. Dividing the two sizes (or taking the ratio) shows that the grapefruit is 254,000 times larger than the bacterium. We could still use a way to simply our notation, as it's easy to accidentally leave off one of the zeroes in the size of the bacterium. That's where "powers of ten" notation becomes useful.
Powers of Ten
Scaling to the largest sizes we will consider, a galaxy is a vast collection of stars that are held together by gravity. The length of a typical spiral galaxy, like the Milky Way, is about 1,000,000,000,000,000,000,000 meters (m), or a billion trillion m. This is a huge number, with 21 zeros after the one (this length is called a sextillion meters). The number may seem more intuitive when expressed as one billion trillion, as billion and trillion are familiar values that show up in our daily life (for example, billionaires are often in the news, and although no trillionaires yet exist, we intuitively know how much money they would have). When writing these numbers the prefixes M and G are sometimes used, where M stands for a million or the prefix "Mega" and G for a billion or the prefix "Giga".
One additional way to express these number is by using powers of ten. A million expressed in powers of ten is 106, since there are 6 zeros. Similarly, the Milky Way’s size can be written as 1021 m. There is also a prefix for 1021, called zetta and abbreviated by a Z. The Milky Way’s size can be expressed as 1021 m, 1 Zm or 1 sextillion m. This link to the National Institute of Standards and Technology lists the common prefixes that we use. In this table, we see that a yoctosecond is a very small measure of time – it is a mere septillionth of a second or 10-24 s. We will make regular use of powers of ten notation in this course, as we will be dealing with immensely large and small numbers.
In the context of comparing such a wide range of phenomena as this subject warrants, a good first step is to estimate the order of magnitude of the scale of an object. The easiest way to do this is to write the measurement in scientific notation and consider only the exponent. Notice that we need to identify the units of measurement as well as the order of magnitude to avoid ambiguity.
To get a better feel for very large and very small numbers in nature, the following film, created by Charles and Ray Eames in the 1970s, explores the very largest and very smallest numbers using powers of ten. Note that since the creation of this film, scientific advances have aided in the more complete understanding of the largest and smallest scales so that we now have more exacting probes of the largest scales and the smallest scales shown in the film. Our maps of galaxy clusters and investigations to the observable limits of our universe have improved to the extent that we can accurately identify the distribution of millions of galaxies while our understanding of the standard model of particle physics has been confirmed down to the centers of atomic nuclei.
https://www.youtube.com/watch?v=0fKBhvDjuy0
Copyright © Eames Office, LLC. All rights reserved.
The smallest measurable sizes bring us inside the nucleus of an atom, where subatomic particles called protons, with a size of just 10-15 m, are found. On the largest scale, the size of the observable universe is estimated to be about 1026 m. These are such vastly different sizes it is hard to even imagine comparing them, but it can be done very simply. The question of “how many times larger” one object is compared to another object can be found by dividing the two numbers: 1026 m/10-15 m = 1041 (for a review on working with powers of ten and scientific notation, please see Appendix B). The answer tells us that the observable universe is 1041 times larger, or “41 powers of ten,” larger than a proton. This can also be stated by saying that the universe is 41 orders of magnitude larger than a proton.
This type of analysis is powerful. Compared to the entire size of an atom, the nucleus is about 10,000 times smaller (104, or 4 orders of magnitude). This tells us that an atom – the fundamental building block of matter – is mostly empty space. The universe, it turns out, is also filled with huge voids of empty space.
Concept Check: Exponential sizes
Storage devices come in different sizes, and a small flash drive might have 64 MB of space and a large drive could have 500 GB. The small flash drive has 64 million bytes of space, where a million is 1,000,000 – one with six zeros. The "M "in MB stands for the prefix Mega, meaning million, and "B" is the abbreviation for bytes. Note that G is the prefix Giga, meaning billion.
To compare the size of a 512 MB flash drive to a 64 MB flash drive, this can answered in one step by dividing the two sizes: 512 MB/64 MB = 8. The 512 MB is eight times larger than the 64 MB drive. To state it another way, you would need eight 64 MB drives to equal one 512 MB drive. Notice that the answer, eight, has no units (or, we say is “dimensionless”). This makes sense – since both sizes are in MB, we compared “apples to apples”.
If the question asked how many times larger a 512 GB drive is compared to a 64 MB drive, you would need to make the units agree before dividing the numbers. Do this!
Show Solution
There are a few different ways to approach this: you could convert from GB to MB, from MB to GB, or convert both units into B. Let's convert 512 GB into MB, so that both quantities will have the same units:
512 GB × (103 MB/1 GB) = 512×103 MB
Now, we can divide the two quantities since they are both in MB: (512,000 MB/64 MB) = 8000
It takes eight thousand 64 MB flash drives to equal one 512 GB drive.
If the conversion directly from GB to MB was not clear, we can do this in two steps:
512 GB × (109 B/1 GB) × (1 MB/106 B) = 512×109×10-6 B = 512×103 MB = 512,000 MB
Stars
The power of a star can be measured in Watts (W), just like light bulbs. The Sun's power output is 3.8×1026 W and the power of the star Arcturus is 6.5×1028 W.
(a) How many times more powerful is Arcturus than the Sun? (b) How many times less powerful is the Sun than Arcturus?
Show Answer
(a) We can simply divide the power of Arcturus by the power of the Sun to find this:
(6.5×1028 W)/(3.8×1026 W) = 171
(b) 0.0058 or (1/171)
Light Units and Speed
To explore the chemistry and possible biology of other worlds, ideally we would send humans there to run experiments. Humans have been to the Moon to collect rocks, and there are currently several rovers that are controlled from Earth analyzing rocks and soil on the surface of Mars. There are plans to send humans to Mars in the next decade or two. Why not send humans sooner? There turn out to be many challenges to physically traveling beyond the Earth, but the distances involved are foremost.
We are familiar with long distances on Earth. The distance from NYC to Sydney, Australia is about 10,000 miles (16,000 km) and a typical jet flies at a speed of 575 mph, so this flight takes over 17 hours. How about the distance from Earth to the Moon or Mars? The Moon is around 240,000 miles (384,000 km) away and Mars is over 200 million miles from Earth. In 2020, the Perseverance spacecraft travelled at 24,600 mph to Mars and still took about 7 months to get there. The amount of time it takes to travel somewhere is the distance divided by the speed you are traveling, or:
time = (distance)/(speed)
If you are traveling to a place 30 miles away at a steady speed of 60 mph, then it takes you (30 miles)/(60 mph) = 0.5 hour to get there.
Concept Check: Distances, speed and time
If it takes 18 days for a rover moving at a steady speed to travel a distance of 6 km, how fast was the rover moving?
Show Answer
speed = (distance)/(time)
speed =(6 km)/(18 hours) = 1/3 km/hr = 0.33 km/hr
In fact, this is the maximum speed that the Perseverance rover can reach.
Perhaps you can just travel at faster speeds to get someplace far, like Mars, more quickly? While this idea works well for speeds on Earth (and hence we have supersonic jets and bullet trains), there is a limit to how fast anything can travel. This cosmic speed limit is called the speed of light, and nothing can travel faster. In fact, only light, which has no mass, can travel at the speed of light; any object with mass can never reach this speed due to the effects of Einstein’s theory of special relativity. So, the fastest possible way to reach a distant world is to send light. This may not seem very helpful at first, but light can contain information – think about radio or TV signals – so this is a potential way to send communications to distant worlds.
How long would light take to reach Mars? The speed of light, which is denoted by the symbol c, can be expressed in any units, such as km/hr, mph, or feet/s. Two common choices are m/s and km/s:
c = 300,000 km/s = 3×10⁵ km/s = 3×10⁸ m/s
(For comparison, a variety of speeds that we may encounter in astrobiology are listed in Table 2.) The distance to Mars when it is closest to the Earth is 55 million km. Using the simple relationship for time, distance, and speed, we arrive at an answer of 183 seconds. That’s fast – only about 3 minutes! And definitely faster than the 7 months the Perseverance spacecraft took. This way of thinking about distances, times, and the speed of light is so useful, in fact, that astronomers often use light units to express distances. The Sun is 93 million miles away from Earth. If we do the same calculation for how long light from the Sun takes to reach us on Earth, it is 8 minutes. That’s about three times as long as light takes to get to and from Mars. We can now express the distances d to the Sun and Mars, in light units: dSun = 8 light minutes and dMars = 3 light minutes
| Scenario | Speed | Scenario | Speed |
| Drift speed of the continents | 3 × 10⁻⁹ m/s | Orbital speed of the Earth around the Sun | 30 km/s |
| Growth speed of human hair | 5 × 10⁻⁹ m/s | Escape speed from the Solar System (at the distance of Earth) | 40 km/s |
| Automobile | 100 km/hour = 28 m/s | Fastest human-made object | 110 km/s |
| Rotational speed of the Earth at the Equator | 1700 km/hour = 480 m/s | Orbital speed of the Sun around the Galaxy | 220 km/s |
| Orbital speed in low-Earth orbit | 8 km/s | Escape speed from the Galaxy (at the location of the Sun) | 310 km/s |
| Escape speed at Earth's surface | 11 km/s | Speed of light = c | 3 × 10⁵ km/s |
Worked Example: Light Units
Show that 1 light year is equal to 9.46 trillion km.
Recall that a light year is the distance that light travels in 1 year. We can use the relationship between time, distance and speed, along with unit conversions, to show this.
distance = (speed)×(time)
Here, we know the speed--the speed of light--and can express it in any units...let's use km/s, since the answer is in units of km. In the equation below, we use 3×10⁵ km/s for the speed. For the time, we use 1 year and convert this to seconds.
distance = (3×10⁵ km/s)×(1 year)
distance = (3×10⁵ km/s)×(1 year)×(365 days/1 yr)×(24 hours/1 day)×(60 min/1 hr)×(60 sec/1 min) = 9.46×10¹² km
Recall that a light year is the distance that light travels in 1 year. We can use the relationship between time, distance and speed, along with unit conversions, to show this.
distance = (speed)×(time)
Here, we know the speed--the speed of light--and can express it in any units...let's use km/s, since the answer is in units of km. In the equation below, we use 3×10⁵ km/s for the speed. For the time, we use 1 year and convert this to seconds.
distance = (3×10⁵ km/s)×(1 year)
distance = (3×10⁵ km/s)×(1 year)×(365 days/1 yr)×(24 hours/1 day)×(60 min/1 hr)×(60 sec/1 min) = 9.46×10¹² km
This is equal to 9.46 trillion km.
How long does it take light from the Sun to reach Saturn, in minutes?
Start with the average distance from the Sun to Saturn in km, which is 1.4 billion km.
Show Answer
Light from the Sun is traveling at the speed of light, or 3×10⁵ km/s.
time = (distance)/(speed) = (1.4×10⁹ km)/(3×105 km/s) = 4,667 seconds
(4667 sec)(1 min/60 sec) = 78 minutes
We can thus say that Saturn is 78 light minutes away from the Sun.
How about the closest star to the Sun? That’s a red star named Proxima Centauri, and it is staggering 40,208,000,000,000 km (40 trillion km or 4×10¹³ km) away. In light units, however, this distance is 4 light years. It takes light 4 years to reach Proxima Centauri. The distances in light units to some nearby astronomical objects are shown in Figure 4. Light units are very convenient for expressing distances to stars that have intriguing planets orbiting them, as this tells us how long a radio signal would take to arrive at the star system. Also, light units remind us that we have a way of looking into the past! Notice in Figure 4 that the Andromeda galaxy is 2.5 million light years away. This means that light from Andromeda takes 2.5 million years to reach us, and that consequently we are seeing Andromeda as it looked 2.5 million years ago. This gives astronomers a way to see how the oldest galaxies in the universe, that are more than 13 billion light years away, looked when they were very young!
Concept Check: Distances
In Figure 4, the distance of 12 light minutes from Earth to Mars is actually the average, as the distance from Earth to Mars varies from 3 light minutes to 22 light minutes (at the furthest distance, it is on the opposite side of the Sun compared to Earth). When Mars and the Earth are at their closest distance, how long does it take light from the Sun to reach Mars?
It may help to make a sketch of the alignment of the Sun, Mars and Earth when Mars and Earth are closest to each other.
Show Sketch and Answer
The left panel shows the alignment of the Sun, Earth, and Mars when Mars is closest to the Earth. The time for sunlight to reach the Earth is 8 light minutes and the time for light to travel from Earth to Mars is 3 light minutes at closest approach. Thus, the total time is 8 light min + 3 light min = 11 light min
Other units of distance in astronomy
If you look up the distance to an astronomical object, the units will vary. For example, the distance to the star Vega might be reported in light years or parsecs -- it is 25 light years away which is the same as 7.8 parsecs. The Oort cloud surrounding our solar system is 50,000 AU away. Let's introduce these units as well.
Astronomical Units
When reporting distances within solar systems, astronomical units (AU) are typically used. One AU is defined to be the average distance from the Earth to the Sun. Mercury and Venus are closer to the Sun than the Earth and thus have distances in AU that are less than 1 AU. Saturn is at about 10 AU from the Sun and Neptune is at 30 AU.
When you read about the distance of an exoplanet from its host star, these are also reported in AU and have the exact same meaning as in our solar system. The exoplanet Proxima b orbits the red star Proxima Centauri, and Proxima b is an average distance of 0.0485 AU away from Proxima Centauri. This means Proxima b is very close to its star: it is nearly 2 orders of magnitude closer to Proxima Centauri than the Earth is from the Sun.
Parsecs
Parsecs (abbreviated pc) and light years have similar values:
1 pc = 3.26 light years
It is usually a matter of context in deciding which units to use although it is usually more intuitive for students to use light units.
Key Concepts and Summary
The scale of space and time in the universe is so enormous that we need strategies to organize a basic understanding of where and when. The cosmic calendar re-scales the 13.8 billion year age of the universe into a "cosmic year", effectively capturing the timing for the rise of life and the very recent appearance of modern humans. The exponential spatial scale of the universe is captured as powers of ten, to compare the smallest and largest sizes and distances. A common unit for distances is light travel time: light could travel the circumference of the Earth seven times in just one second. It takes light 8 minutes to travel from the Sun to the Earth; 4.3 years to travel from Earth to the nearest star system, alpha Centauri, and 2.5 million years to travel to the closest spiral galaxy, Andromeda. Another important distance scale in astronomy is the distance from the Sun to the Earth: 1 Astronomical Unit or 1 AU.
Review Questions
Summary Questions
- How does the "cosmic calendar" help in understanding when key events happened for the development of life on Earth?
- How do you compare the size (or any property) of two objects using powers of ten?
- How does the smallest size we can observe compare with the largest size? Give an example of two objects that vary by 8 orders of magnitude. How about 17 orders of magnitude?
- What are light units? Why is it convenient for astronomers to use light units when expressing distances?
Exercises
- Using the speed in Table 2, how long will your hair grow in one month?
- The Voyager 1 spacecraft is traveling at a speed of 38,000 miles per hour (17 km/s). Express this speed in light years per second (ly/s). How long would it take Voyager 1 to reach the closest star to the Sun, Proxima Centauri, which is 4.3 light years away?
- There are some additional exercises using powers of ten and scientific notation here (with solutions).
To approach the subject of astrobiology – specifically, of exploring possibilities that other life exists beyond the Earth – it is worthwhile to ponder the size and age of the cosmos. In this grand scheme, when and where did life on Earth first appear? The moment when the first life appeared is not precisely known, but several lines of evidence provide compelling clues for the timing of the rise of life on Earth.
Learning Objectives
By the end of this chapter, you will be able to:
- Explain the idea of the "cosmic calendar" and the timing of key events for life
- Express small and large numbers using powers of ten
- Describe the range of sizes for objects in the universe
- Explain light units such as light years and light seconds
- Explain the Hubble law and use the Hubble constant to calculate the age of the universe
Our Place in Time: The Cosmic Calendar
The universe emerged at the moment of the Big Bang, 13.8 billion years ago. This is our starting point for time. Key events since this moment, including the formation of our galaxy and our solar system, can be identified in a memorable way by compressing all of time into one calendar year. This idea for the “cosmic calendar” was first articulated by astronomer Carl Sagan. On this cosmic calendar (Figure 1), each month represents a little over a billion years. Each day covers a span of around 40 million years. The very first stars and galaxies form in late January, and our home galaxy, the Milky Way, forms in early March. Our solar system comes on the scene in early September, and the first life on Earth probably formed by mid- to late-September.
Life starts as very simple cells and gradually evolves into more, with the first multicellular life appearing in November, and the first plants on December 20th. Primates, including humans, appear on December 31. In fact, modern humans show up on December 31, at 11:52 PM, which is on the order of the real-time equivalent of hundreds of thousands of years ago. In the bottom panel of Figure 1, which zooms in on the last 60 seconds on December 31, we see that all of modern science, including the development of both the telescope and microscope in the 17th century, happen in the last second at 11:59 PM.
There are a few ways to think about this time frame. On one hand, technologically advanced humans on Earth are newcomers. Humans have been sending out radio waves for less than one cosmic second. However, considering that the first life to appear on Earth took only a few cosmic weeks to form, perhaps the initial formation of life on other worlds will be a relatively speedy process. When considering just how many planets there are in the cosmos, it is tempting to think that the odds of life existing on at least one other planet are good.
Our Place in Space
Space also emerged at the moment of the Big Bang, and it has been expanding ever since. Contemplating the size of the cosmos can seem mind-bending but we can ground ourselves by starting with some size comparisons of more familiar objects. When comparing the sizes of two objects, a good first step is to be clear as to what is being compared, as the word size can mean different things -- length and volume, for example, are do not measure the same thing. Here, let's compare the length of some different objects, where the length is the distance from one end to the other end. Of course not all objects are symmetric so you may need to be more specific about how you are defining length, depending on what is being compared. For example, bacteria come in different shapes, such as rods, spheres, and spirals. In specifying a bacterium’s size, you would need to be clear about the start and end points of the measurement. In astronomy, galaxies also come in different shapes – ellipsoids, spirals, and irregular shapes – so it is important to know which dimension (say left to right or top to bottom) the length is referring to.
Units of length are important to consider. Lengths and distances are one-dimensional measures and are expressed in units such as meters or miles. Of course, the length of any object can be expressed in any units: what's important is that the objects being compared have the same units. Let's compare the size of a grapefruit and a bacterium. The length of a typical grapefruit is around 10 inches, which is the same as 25.4 centimeters (cm), 0.254 meters (m), 0.000254 kilometers (km) or 0.000158 miles. These are all equivalent measures, and it is a matter of convenience when choosing units. When directly comparing two measurements, all that matters is that the units chosen for the grapefruit are the same as those for a bacterium. We know that bacteria are very small, and a typical size is reported in units of micrometers (μm), where the prefix micro indicates 0.000001 meters. So, we can compare a grapefruit and a bacterium using meters (m): a grapefruit is 0.254 m and a bacterium is 0.000001 m. Clearly, the grapefruit is larger than the bacterium, and we can find exactly how much larger by dividing the two sizes: (0.254 m)/(0.000001 m) = 254,000. Dividing the two sizes (or taking the ratio) shows that the grapefruit is 254,000 times larger than the bacterium. We could still use a way to simply our notation, as it's easy to accidentally leave off one of the zeroes in the size of the bacterium. That's where "powers of ten" notation becomes useful.
Powers of Ten
Scaling to the largest sizes we will consider, a galaxy is a vast collection of stars that are held together by gravity. The length of a typical spiral galaxy, like the Milky Way, is about 1,000,000,000,000,000,000,000 meters (m), or a billion trillion m. This is a huge number, with 21 zeros after the one (this length is called a sextillion meters). The number may seem more intuitive when expressed as one billion trillion, as billion and trillion are familiar values that show up in our daily life (for example, billionaires are often in the news, and although no trillionaires yet exist, we intuitively know how much money they would have). When writing these numbers the prefixes M and G are sometimes used, where M stands for a million or the prefix "Mega" and G for a billion or the prefix "Giga".
One additional way to express these number is by using powers of ten. A million expressed in powers of ten is 106, since there are 6 zeros. Similarly, the Milky Way’s size can be written as 1021 m. There is also a prefix for 1021, called zetta and abbreviated by a Z. The Milky Way’s size can be expressed as 1021 m, 1 Zm or 1 sextillion m. This link to the National Institute of Standards and Technology lists the common prefixes that we use. In this table, we see that a yoctosecond is a very small measure of time – it is a mere septillionth of a second or 10-24 s. We will make regular use of powers of ten notation in this course, as we will be dealing with immensely large and small numbers.
In the context of comparing such a wide range of phenomena as this subject warrants, a good first step is to estimate the order of magnitude of the scale of an object. The easiest way to do this is to write the measurement in scientific notation and consider only the exponent. Notice that we need to identify the units of measurement as well as the order of magnitude to avoid ambiguity.
To get a better feel for very large and very small numbers in nature, the following film, created by Charles and Ray Eames in the 1970s, explores the very largest and very smallest numbers using powers of ten. Note that since the creation of this film, scientific advances have aided in the more complete understanding of the largest and smallest scales so that we now have more exacting probes of the largest scales and the smallest scales shown in the film. Our maps of galaxy clusters and investigations to the observable limits of our universe have improved to the extent that we can accurately identify the distribution of millions of galaxies while our understanding of the standard model of particle physics has been confirmed down to the centers of atomic nuclei.
https://www.youtube.com/watch?v=0fKBhvDjuy0
Copyright © Eames Office, LLC. All rights reserved.
The smallest measurable sizes bring us inside the nucleus of an atom, where subatomic particles called protons, with a size of just 10-15 m, are found. On the largest scale, the size of the observable universe is estimated to be about 1026 m. These are such vastly different sizes it is hard to even imagine comparing them, but it can be done very simply. The question of “how many times larger” one object is compared to another object can be found by dividing the two numbers: 1026 m/10-15 m = 1041 (for a review on working with powers of ten and scientific notation, please see Appendix B). The answer tells us that the observable universe is 1041 times larger, or “41 powers of ten,” larger than a proton. This can also be stated by saying that the universe is 41 orders of magnitude larger than a proton.
This type of analysis is powerful. Compared to the entire size of an atom, the nucleus is about 10,000 times smaller (104, or 4 orders of magnitude). This tells us that an atom – the fundamental building block of matter – is mostly empty space. The universe, it turns out, is also filled with huge voids of empty space.
Concept Check: Exponential sizes
Storage devices come in different sizes, and a small flash drive might have 64 MB of space and a large drive could have 500 GB. The small flash drive has 64 million bytes of space, where a million is 1,000,000 – one with six zeros. The "M "in MB stands for the prefix Mega, meaning million, and "B" is the abbreviation for bytes. Note that G is the prefix Giga, meaning billion.
To compare the size of a 512 MB flash drive to a 64 MB flash drive, this can answered in one step by dividing the two sizes: 512 MB/64 MB = 8. The 512 MB is eight times larger than the 64 MB drive. To state it another way, you would need eight 64 MB drives to equal one 512 MB drive. Notice that the answer, eight, has no units (or, we say is “dimensionless”). This makes sense – since both sizes are in MB, we compared “apples to apples”.
If the question asked how many times larger a 512 GB drive is compared to a 64 MB drive, you would need to make the units agree before dividing the numbers. Do this!
Show Solution
There are a few different ways to approach this: you could convert from GB to MB, from MB to GB, or convert both units into B. Let's convert 512 GB into MB, so that both quantities will have the same units:
512 GB × (103 MB/1 GB) = 512×103 MB
Now, we can divide the two quantities since they are both in MB: (512,000 MB/64 MB) = 8000
It takes eight thousand 64 MB flash drives to equal one 512 GB drive.
If the conversion directly from GB to MB was not clear, we can do this in two steps:
512 GB × (109 B/1 GB) × (1 MB/106 B) = 512×109×10-6 B = 512×103 MB = 512,000 MB
Stars
The power of a star can be measured in Watts (W), just like light bulbs. The Sun's power output is 3.8×1026 W and the power of the star Arcturus is 6.5×1028 W.
(a) How many times more powerful is Arcturus than the Sun? (b) How many times less powerful is the Sun than Arcturus?
Show Answer
(a) We can simply divide the power of Arcturus by the power of the Sun to find this:
(6.5×1028 W)/(3.8×1026 W) = 171
(b) 0.0058 or (1/171)
Light Units and Speed
To explore the chemistry and possible biology of other worlds, ideally we would send humans there to run experiments. Humans have been to the Moon to collect rocks, and there are currently several rovers that are controlled from Earth analyzing rocks and soil on the surface of Mars. There are plans to send humans to Mars in the next decade or two. Why not send humans sooner? There turn out to be many challenges to physically traveling beyond the Earth, but the distances involved are foremost.
We are familiar with long distances on Earth. The distance from NYC to Sydney, Australia is about 10,000 miles (16,000 km) and a typical jet flies at a speed of 575 mph, so this flight takes over 17 hours. How about the distance from Earth to the Moon or Mars? The Moon is around 240,000 miles (384,000 km) away and Mars is over 200 million miles from Earth. In 2020, the Perseverance spacecraft travelled at 24,600 mph to Mars and still took about 7 months to get there. The amount of time it takes to travel somewhere is the distance divided by the speed you are traveling, or:
time = (distance)/(speed)
If you are traveling to a place 30 miles away at a steady speed of 60 mph, then it takes you (30 miles)/(60 mph) = 0.5 hour to get there.
Concept Check: Distances, speed and time
If it takes 18 days for a rover moving at a steady speed to travel a distance of 6 km, how fast was the rover moving?
Show Answer
speed = (distance)/(time)
speed =(6 km)/(18 hours) = 1/3 km/hr = 0.33 km/hr
In fact, this is the maximum speed that the Perseverance rover can reach.
Perhaps you can just travel at faster speeds to get someplace far, like Mars, more quickly? While this idea works well for speeds on Earth (and hence we have supersonic jets and bullet trains), there is a limit to how fast anything can travel. This cosmic speed limit is called the speed of light, and nothing can travel faster. In fact, only light, which has no mass, can travel at the speed of light; any object with mass can never reach this speed due to the effects of Einstein’s theory of special relativity. So, the fastest possible way to reach a distant world is to send light. This may not seem very helpful at first, but light can contain information – think about radio or TV signals – so this is a potential way to send communications to distant worlds.
How long would light take to reach Mars? The speed of light, which is denoted by the symbol c, can be expressed in any units, such as km/hr, mph, or feet/s. Two common choices are m/s and km/s:
c = 300,000 km/s = 3×10⁵ km/s = 3×10⁸ m/s
(For comparison, a variety of speeds that we may encounter in astrobiology are listed in Table 2.) The distance to Mars when it is closest to the Earth is 55 million km. Using the simple relationship for time, distance, and speed, we arrive at an answer of 183 seconds. That’s fast – only about 3 minutes! And definitely faster than the 7 months the Perseverance spacecraft took. This way of thinking about distances, times, and the speed of light is so useful, in fact, that astronomers often use light units to express distances. The Sun is 93 million miles away from Earth. If we do the same calculation for how long light from the Sun takes to reach us on Earth, it is 8 minutes. That’s about three times as long as light takes to get to and from Mars. We can now express the distances d to the Sun and Mars, in light units: dSun = 8 light minutes and dMars = 3 light minutes
| Scenario | Speed | Scenario | Speed |
| Drift speed of the continents | 3 × 10⁻⁹ m/s | Orbital speed of the Earth around the Sun | 30 km/s |
| Growth speed of human hair | 5 × 10⁻⁹ m/s | Escape speed from the Solar System (at the distance of Earth) | 40 km/s |
| Automobile | 100 km/hour = 28 m/s | Fastest human-made object | 110 km/s |
| Rotational speed of the Earth at the Equator | 1700 km/hour = 480 m/s | Orbital speed of the Sun around the Galaxy | 220 km/s |
| Orbital speed in low-Earth orbit | 8 km/s | Escape speed from the Galaxy (at the location of the Sun) | 310 km/s |
| Escape speed at Earth's surface | 11 km/s | Speed of light = c | 3 × 10⁵ km/s |
Worked Example: Light Units
Show that 1 light year is equal to 9.46 trillion km.
Recall that a light year is the distance that light travels in 1 year. We can use the relationship between time, distance and speed, along with unit conversions, to show this.
distance = (speed)×(time)
Here, we know the speed--the speed of light--and can express it in any units...let's use km/s, since the answer is in units of km. In the equation below, we use 3×10⁵ km/s for the speed. For the time, we use 1 year and convert this to seconds.
distance = (3×10⁵ km/s)×(1 year)
distance = (3×10⁵ km/s)×(1 year)×(365 days/1 yr)×(24 hours/1 day)×(60 min/1 hr)×(60 sec/1 min) = 9.46×10¹² km
Recall that a light year is the distance that light travels in 1 year. We can use the relationship between time, distance and speed, along with unit conversions, to show this.
distance = (speed)×(time)
Here, we know the speed--the speed of light--and can express it in any units...let's use km/s, since the answer is in units of km. In the equation below, we use 3×10⁵ km/s for the speed. For the time, we use 1 year and convert this to seconds.
distance = (3×10⁵ km/s)×(1 year)
distance = (3×10⁵ km/s)×(1 year)×(365 days/1 yr)×(24 hours/1 day)×(60 min/1 hr)×(60 sec/1 min) = 9.46×10¹² km
This is equal to 9.46 trillion km.
How long does it take light from the Sun to reach Saturn, in minutes?
Start with the average distance from the Sun to Saturn in km, which is 1.4 billion km.
Show Answer
Light from the Sun is traveling at the speed of light, or 3×10⁵ km/s.
time = (distance)/(speed) = (1.4×10⁹ km)/(3×105 km/s) = 4,667 seconds
(4667 sec)(1 min/60 sec) = 78 minutes
We can thus say that Saturn is 78 light minutes away from the Sun.
How about the closest star to the Sun? That’s a red star named Proxima Centauri, and it is staggering 40,208,000,000,000 km (40 trillion km or 4×10¹³ km) away. In light units, however, this distance is 4 light years. It takes light 4 years to reach Proxima Centauri. The distances in light units to some nearby astronomical objects are shown in Figure 4. Light units are very convenient for expressing distances to stars that have intriguing planets orbiting them, as this tells us how long a radio signal would take to arrive at the star system. Also, light units remind us that we have a way of looking into the past! Notice in Figure 4 that the Andromeda galaxy is 2.5 million light years away. This means that light from Andromeda takes 2.5 million years to reach us, and that consequently we are seeing Andromeda as it looked 2.5 million years ago. This gives astronomers a way to see how the oldest galaxies in the universe, that are more than 13 billion light years away, looked when they were very young!
Concept Check: Distances
In Figure 4, the distance of 12 light minutes from Earth to Mars is actually the average, as the distance from Earth to Mars varies from 3 light minutes to 22 light minutes (at the furthest distance, it is on the opposite side of the Sun compared to Earth). When Mars and the Earth are at their closest distance, how long does it take light from the Sun to reach Mars?
It may help to make a sketch of the alignment of the Sun, Mars and Earth when Mars and Earth are closest to each other.
Show Sketch and Answer
The left panel shows the alignment of the Sun, Earth, and Mars when Mars is closest to the Earth. The time for sunlight to reach the Earth is 8 light minutes and the time for light to travel from Earth to Mars is 3 light minutes at closest approach. Thus, the total time is 8 light min + 3 light min = 11 light min
Other units of distance in astronomy
If you look up the distance to an astronomical object, the units will vary. For example, the distance to the star Vega might be reported in light years or parsecs -- it is 25 light years away which is the same as 7.8 parsecs. The Oort cloud surrounding our solar system is 50,000 AU away. Let's introduce these units as well.
Astronomical Units
When reporting distances within solar systems, astronomical units (AU) are typically used. One AU is defined to be the average distance from the Earth to the Sun. Mercury and Venus are closer to the Sun than the Earth and thus have distances in AU that are less than 1 AU. Saturn is at about 10 AU from the Sun and Neptune is at 30 AU.
When you read about the distance of an exoplanet from its host star, these are also reported in AU and have the exact same meaning as in our solar system. The exoplanet Proxima b orbits the red star Proxima Centauri, and Proxima b is an average distance of 0.0485 AU away from Proxima Centauri. This means Proxima b is very close to its star: it is nearly 2 orders of magnitude closer to Proxima Centauri than the Earth is from the Sun.
Parsecs
Parsecs (abbreviated pc) and light years have similar values:
1 pc = 3.26 light years
It is usually a matter of context in deciding which units to use although it is usually more intuitive for students to use light units.
The Big Bang and the Expanding Universe
Hubble's Law
In 1929, Edwin Hubble published a now-famous paper in the Publications of the National Academy of Science titled, "A Relation between Distance and Radial Velocity in Extragalactic Nebulae.'' In this paper he included a Table of data (reproduced below) showing distances, r, and radial velocities, v, to a couple of dozen "extragalactic nebulae,'' objects that we now understand to be other galaxies.
The "radial'' velocity is the component of velocity along our line of sight to an object. We defer a discussion of how the galactic velocities were measured to the chapter on spectroscopy, but for now, trust us... measuring radial velocities of galaxies is bread-and-butter astronomy.
Hubble sorted the galaxies by distance and immediately noticed a correlation: the more distant galaxies generally had larger radial velocities than closer galaxies. It was also clear that most galaxies - especially those at large distances - are moving away from us (by convention, positive velocities recede from us and negative velocities approach us). A few scientists of the day had already predicted this result as a critical test for a Big Bang.
Hubble plotted up his data and derived the best-fit linear velocity-distance relation. There is some scatter in Hubble's diagram. Some of this was the result of errors in the data, particularly the distances to galaxies. However, our Milky Way is one of a few dozen galaxies in what we call the Local Group. Galaxies in clusters are gravitationally bound and have orbital velocities that are larger than velocities from the expansion of the universe. Some of the velocities of galaxies in the Local Group (like the Andromeda Galaxy) are directed toward us -- those galaxies have negative velocities. Hubble's law really applies only to distant galaxies beyond the Local Group.
The speed with which galaxies are moving apart is called the recession speed. Let's think about what this linear relation between distance and recession speed means. Imagine that Galaxy A is initially at a distance d, and Galaxy B is initially at a distance 2d. Now, let enough time pass so that Galaxy A is at a distance 2d. If the expansion of space is constant everywhere, then Galaxy B will have moved to a distance 4d in that same time interval. Speed is distance divided by time; since Galaxy B travels twice the distance of Galaxy A in the same time interval, it must be traveling at twice the speed. When the expansion of the universe is constant, distance is proportional to recession velocity.
Concept Check
Can you think of how it might be possible to deduce the age of the universe from Hubble's data?
At first glance, it is tempting to conclude that the universe is expanding away from us - that we are the center of the universe. In fact, there is nothing special about our place in the universe. From the perspective of observers in every galaxy, most other galaxies seem to be receding. Indeed, alien astronomers in other galaxies have probably already published these same results, showing the relation between the distance and velocity of other galaxies. Like Hubble, they will know that they are not at the center of the universe.
The linear relationship between distance and recession velocity in Hubble's diagram (above) is expressed by a simple equation:
$$v = H_0 d$$
The astute reader will immediately recognize this as the equation of a straight line: Here, H0 is the slope of the line and the y-intercept is zero. This equation says that the recession velocity of a galaxy is proportional to its distance. The constant of proportionality, H0, is called Hubble's constant. Mathematically, it is the slope of the line in the velocity-distance relation. The units of H0 are physically meaningful: they have units of speed per distance (typically, km/s per megaparsec, Mpc). Assuming that Hubble's constant is really constant (i.e., not changing over time), then once this value is determined, you can measure the velocity of a galaxy (with spectroscopy) to derive its distance. Galaxies with larger velocities are farther away. So, Equation 1 is a powerful way to estimate distances to other galaxies. But, keep in mind the chicken and egg problem - we had to measure velocities and distances for some galaxies to derive the Hubble relationship. Once that was done, we were able to lean on the linear model to find distances to other galaxies.
The Hubble constant tells us something rather surprising. The units of 1/H0, (or distance / velocity) are time, and this "time'' is none other than the age of the universe. It is incredible that we can calculate the slope of the line in Hubble's data and solve for the age of the universe. The only rookie mistake has to do with the units - make sure that the speed (distance per time - usually km/s) and distance (usually Mpc) are converted to the same units so that distance really cancels out. And then, you will want to convert to more useful units than seconds: years or billions of years.
So, to recap, Edwin Hubble measured distances to the nearest galaxies, proving that they were outside of the Milky Way. He measured the velocities of other galaxies and found a correlation between distance and recession speed, providing observational evidence that the universe is expanding, and yielding an estimate for the age of the universe. This work provided a resolution to Olbers' paradox: the universe is not infinitely old (we can calculate its age), and because it is expanding, the light from stars in the most distant galaxies has been redshifted out of the optical bandpass (a concept we will discuss more in later chapters). Hubble's work changed our perspective of our place in the universe, and astronomers honored his contributions by naming a space observatory after him: the Hubble Space Telescope (HST) has been a workhorse telescope for the community since the mid-1990's.
We started with a presentation of Edwin Hubble's observations of the expanding universe because it was intuitively easy to understand. However, the Belgian priest George Lemaitre deserves a lot of credit for pioneering modern cosmology. In 1927, two years before Hubble's famous paper, Lemaitre published a paper with the rather wordy title: "A homogeneous universe of constant mass and growing radius accounting for the radial velocity of extragalactic nebulae." We now know Lemaitre's model as "Hubble's law" but it was Lemaitre who worked out the theory of the expanding universe with pencil and paper, based on Einstein's theory of general relativity. He proposed that the recession velocity of galaxies (extragalactic nebulae) could be explained by this expansion, and he derived the first estimate for the rate of expansion, which is now known as the Hubble constant, H0. Lemaitre gets extra credit for persisting in the face of a harsh critic; Einstein himself reportedly told him: "Sir, your calculations are correct, but your physics is atrocious." In the 1930's the idea that the universe was expanding was an extraordinary claim, and it would require extraordinary evidence (to borrow a phrase from Carl Sagan) before this theory was accepted. This evidence is described in the supplementary chapter "An Expanding Universe."
Key Concepts and Summary
The scale of space and time in the universe is so enormous that we need strategies to organize a basic understanding of where and when. The cosmic calendar re-scales the 13.8 billion year age of the universe into a "cosmic year", effectively capturing the timing for the rise of life and the very recent appearance of modern humans. The exponential spatial scale of the universe is captured as powers of ten, to compare the smallest and largest sizes and distances. A common unit for distances is light travel time: light could travel the circumference of the Earth seven times in just one second. It takes light 8 minutes to travel from the Sun to the Earth; 4.3 years to travel from Earth to the nearest star system, alpha Centauri, and 2.5 million years to travel to the closest spiral galaxy, Andromeda. Another important distance scale in astronomy is the distance from the Sun to the Earth: 1 Astronomical Unit or 1 AU. The Hubble law measures the speed at which the universe is expanding, and enables us to estimate the age of the universe.
Review Questions
Summary Questions
- How does the "cosmic calendar" help in understanding when key events happened for the development of life on Earth?
- How do you compare the size (or any property) of two objects using powers of ten?
- How does the smallest size we can observe compare with the largest size? Give an example of two objects that vary by 8 orders of magnitude. How about 17 orders of magnitude?
- What are light units? Why is it convenient for astronomers to use light units when expressing distances?
- How does measuring the rate of expansion of the universe enable us to estimate its age?
Exercises
- Using the speed in Table 2, how long will your hair grow in one month?
- The Voyager 1 spacecraft is traveling at a speed of 38,000 miles per hour (17 km/s). Express this speed in light years per second (ly/s). How long would it take Voyager 1 to reach the closest star to the Sun, Proxima Centauri, which is 4.3 light years away?
- There are some additional exercises using powers of ten and scientific notation here (with solutions).
To approach the subject of astrobiology – specifically, of exploring possibilities that other life exists beyond the Earth – it is worthwhile to ponder the size and age of the cosmos. In this grand scheme, when and where did life on Earth first appear? The moment when the first life appeared is not precisely known, but several lines of evidence provide compelling clues for the timing of the rise of life on Earth.
Learning Objectives
By the end of this chapter, you will be able to:
- Explain the idea of the "cosmic calendar" and the timing of key events for life
- Express small and large numbers using powers of ten
- Describe the range of sizes for objects in the universe
- Explain light units such as light years and light seconds
- Explain the Hubble law and use the Hubble constant to calculate the age of the universe
Our Place in Time: The Cosmic Calendar
The universe emerged at the moment of the Big Bang, 13.8 billion years ago. This is our starting point for time. Key events since this moment, including the formation of our galaxy and our solar system, can be identified in a memorable way by compressing all of time into one calendar year. This idea for the “cosmic calendar” was first articulated by astronomer Carl Sagan. On this cosmic calendar (Figure 1), each month represents a little over a billion years. Each day covers a span of around 40 million years. The very first stars and galaxies form in late January, and our home galaxy, the Milky Way, forms in early March. Our solar system comes on the scene in early September, and the first life on Earth probably formed by mid- to late-September.
Life starts as very simple cells and gradually evolves into more, with the first multicellular life appearing in November, and the first plants on December 20th. Primates, including humans, appear on December 31. In fact, modern humans show up on December 31, at 11:52 PM, which is on the order of the real-time equivalent of hundreds of thousands of years ago. In the bottom panel of Figure 1, which zooms in on the last 60 seconds on December 31, we see that all of modern science, including the development of both the telescope and microscope in the 17th century, happen in the last second at 11:59 PM.
There are a few ways to think about this time frame. On one hand, technologically advanced humans on Earth are newcomers. Humans have been sending out radio waves for less than one cosmic second. However, considering that the first life to appear on Earth took only a few cosmic weeks to form, perhaps the initial formation of life on other worlds will be a relatively speedy process. When considering just how many planets there are in the cosmos, it is tempting to think that the odds of life existing on at least one other planet are good.
Our Place in Space
Space also emerged at the moment of the Big Bang, and it has been expanding ever since. Contemplating the size of the cosmos can seem mind-bending but we can ground ourselves by starting with some size comparisons of more familiar objects. When comparing the sizes of two objects, a good first step is to be clear as to what is being compared, as the word size can mean different things -- length and volume, for example, are do not measure the same thing. Here, let's compare the length of some different objects, where the length is the distance from one end to the other end. Of course not all objects are symmetric so you may need to be more specific about how you are defining length, depending on what is being compared. For example, bacteria come in different shapes, such as rods, spheres, and spirals. In specifying a bacterium’s size, you would need to be clear about the start and end points of the measurement. In astronomy, galaxies also come in different shapes – ellipsoids, spirals, and irregular shapes – so it is important to know which dimension (say left to right or top to bottom) the length is referring to.
Units of length are important to consider. Lengths and distances are one-dimensional measures and are expressed in units such as meters or miles. Of course, the length of any object can be expressed in any units: what's important is that the objects being compared have the same units. Let's compare the size of a grapefruit and a bacterium. The length of a typical grapefruit is around 10 inches, which is the same as 25.4 centimeters (cm), 0.254 meters (m), 0.000254 kilometers (km) or 0.000158 miles. These are all equivalent measures, and it is a matter of convenience when choosing units. When directly comparing two measurements, all that matters is that the units chosen for the grapefruit are the same as those for a bacterium. We know that bacteria are very small, and a typical size is reported in units of micrometers (μm), where the prefix micro indicates 0.000001 meters. So, we can compare a grapefruit and a bacterium using meters (m): a grapefruit is 0.254 m and a bacterium is 0.000001 m. Clearly, the grapefruit is larger than the bacterium, and we can find exactly how much larger by dividing the two sizes: (0.254 m)/(0.000001 m) = 254,000. Dividing the two sizes (or taking the ratio) shows that the grapefruit is 254,000 times larger than the bacterium. We could still use a way to simply our notation, as it's easy to accidentally leave off one of the zeroes in the size of the bacterium. That's where "powers of ten" notation becomes useful.
Powers of Ten
Scaling to the largest sizes we will consider, a galaxy is a vast collection of stars that are held together by gravity. The length of a typical spiral galaxy, like the Milky Way, is about 1,000,000,000,000,000,000,000 meters (m), or a billion trillion m. This is a huge number, with 21 zeros after the one (this length is called a sextillion meters). The number may seem more intuitive when expressed as one billion trillion, as billion and trillion are familiar values that show up in our daily life (for example, billionaires are often in the news, and although no trillionaires yet exist, we intuitively know how much money they would have). When writing these numbers the prefixes M and G are sometimes used, where M stands for a million or the prefix "Mega" and G for a billion or the prefix "Giga".
One additional way to express these number is by using powers of ten. A million expressed in powers of ten is 106, since there are 6 zeros. Similarly, the Milky Way’s size can be written as 1021 m. There is also a prefix for 1021, called zetta and abbreviated by a Z. The Milky Way’s size can be expressed as 1021 m, 1 Zm or 1 sextillion m. This link to the National Institute of Standards and Technology lists the common prefixes that we use. In this table, we see that a yoctosecond is a very small measure of time – it is a mere septillionth of a second or 10-24 s. We will make regular use of powers of ten notation in this course, as we will be dealing with immensely large and small numbers.
In the context of comparing such a wide range of phenomena as this subject warrants, a good first step is to estimate the order of magnitude of the scale of an object. The easiest way to do this is to write the measurement in scientific notation and consider only the exponent. Notice that we need to identify the units of measurement as well as the order of magnitude to avoid ambiguity.
To get a better feel for very large and very small numbers in nature, the following film, created by Charles and Ray Eames in the 1970s, explores the very largest and very smallest numbers using powers of ten. Note that since the creation of this film, scientific advances have aided in the more complete understanding of the largest and smallest scales so that we now have more exacting probes of the largest scales and the smallest scales shown in the film. Our maps of galaxy clusters and investigations to the observable limits of our universe have improved to the extent that we can accurately identify the distribution of millions of galaxies while our understanding of the standard model of particle physics has been confirmed down to the centers of atomic nuclei.
https://www.youtube.com/watch?v=0fKBhvDjuy0
Copyright © Eames Office, LLC. All rights reserved.
The smallest measurable sizes bring us inside the nucleus of an atom, where subatomic particles called protons, with a size of just 10-15 m, are found. On the largest scale, the size of the observable universe is estimated to be about 1026 m. These are such vastly different sizes it is hard to even imagine comparing them, but it can be done very simply. The question of “how many times larger” one object is compared to another object can be found by dividing the two numbers: 1026 m/10-15 m = 1041 (for a review on working with powers of ten and scientific notation, please see Appendix B). The answer tells us that the observable universe is 1041 times larger, or “41 powers of ten,” larger than a proton. This can also be stated by saying that the universe is 41 orders of magnitude larger than a proton.
This type of analysis is powerful. Compared to the entire size of an atom, the nucleus is about 10,000 times smaller (104, or 4 orders of magnitude). This tells us that an atom – the fundamental building block of matter – is mostly empty space. The universe, it turns out, is also filled with huge voids of empty space.
Concept Check: Exponential sizes
Storage devices come in different sizes, and a small flash drive might have 64 MB of space and a large drive could have 500 GB. The small flash drive has 64 million bytes of space, where a million is 1,000,000 – one with six zeros. The "M "in MB stands for the prefix Mega, meaning million, and "B" is the abbreviation for bytes. Note that G is the prefix Giga, meaning billion.
To compare the size of a 512 MB flash drive to a 64 MB flash drive, this can answered in one step by dividing the two sizes: 512 MB/64 MB = 8. The 512 MB is eight times larger than the 64 MB drive. To state it another way, you would need eight 64 MB drives to equal one 512 MB drive. Notice that the answer, eight, has no units (or, we say is “dimensionless”). This makes sense – since both sizes are in MB, we compared “apples to apples”.
If the question asked how many times larger a 512 GB drive is compared to a 64 MB drive, you would need to make the units agree before dividing the numbers. Do this!
Show Solution
There are a few different ways to approach this: you could convert from GB to MB, from MB to GB, or convert both units into B. Let's convert 512 GB into MB, so that both quantities will have the same units:
512 GB × (103 MB/1 GB) = 512×103 MB
Now, we can divide the two quantities since they are both in MB: (512,000 MB/64 MB) = 8000
It takes eight thousand 64 MB flash drives to equal one 512 GB drive.
If the conversion directly from GB to MB was not clear, we can do this in two steps:
512 GB × (109 B/1 GB) × (1 MB/106 B) = 512×109×10-6 B = 512×103 MB = 512,000 MB
Stars
The power of a star can be measured in Watts (W), just like light bulbs. The Sun's power output is 3.8×1026 W and the power of the star Arcturus is 6.5×1028 W.
(a) How many times more powerful is Arcturus than the Sun? (b) How many times less powerful is the Sun than Arcturus?
Show Answer
(a) We can simply divide the power of Arcturus by the power of the Sun to find this:
(6.5×1028 W)/(3.8×1026 W) = 171
(b) 0.0058 or (1/171)
Light Units and Speed
To explore the chemistry and possible biology of other worlds, ideally we would send humans there to run experiments. Humans have been to the Moon to collect rocks, and there are currently several rovers that are controlled from Earth analyzing rocks and soil on the surface of Mars. There are plans to send humans to Mars in the next decade or two. Why not send humans sooner? There turn out to be many challenges to physically traveling beyond the Earth, but the distances involved are foremost.
We are familiar with long distances on Earth. The distance from NYC to Sydney, Australia is about 10,000 miles (16,000 km) and a typical jet flies at a speed of 575 mph, so this flight takes over 17 hours. How about the distance from Earth to the Moon or Mars? The Moon is around 240,000 miles (384,000 km) away and Mars is over 200 million miles from Earth. In 2020, the Perseverance spacecraft travelled at 24,600 mph to Mars and still took about 7 months to get there. The amount of time it takes to travel somewhere is the distance divided by the speed you are traveling, or:
time = (distance)/(speed)
If you are traveling to a place 30 miles away at a steady speed of 60 mph, then it takes you (30 miles)/(60 mph) = 0.5 hour to get there.
Concept Check: Distances, speed and time
If it takes 18 days for a rover moving at a steady speed to travel a distance of 6 km, how fast was the rover moving?
Show Answer
speed = (distance)/(time)
speed =(6 km)/(18 hours) = 1/3 km/hr = 0.33 km/hr
In fact, this is the maximum speed that the Perseverance rover can reach.
Perhaps you can just travel at faster speeds to get someplace far, like Mars, more quickly? While this idea works well for speeds on Earth (and hence we have supersonic jets and bullet trains), there is a limit to how fast anything can travel. This cosmic speed limit is called the speed of light, and nothing can travel faster. In fact, only light, which has no mass, can travel at the speed of light; any object with mass can never reach this speed due to the effects of Einstein’s theory of special relativity. So, the fastest possible way to reach a distant world is to send light. This may not seem very helpful at first, but light can contain information – think about radio or TV signals – so this is a potential way to send communications to distant worlds.
How long would light take to reach Mars? The speed of light, which is denoted by the symbol c, can be expressed in any units, such as km/hr, mph, or feet/s. Two common choices are m/s and km/s:
c = 300,000 km/s = 3×10⁵ km/s = 3×10⁸ m/s
(For comparison, a variety of speeds that we may encounter in astrobiology are listed in Table 2.) The distance to Mars when it is closest to the Earth is 55 million km. Using the simple relationship for time, distance, and speed, we arrive at an answer of 183 seconds. That’s fast – only about 3 minutes! And definitely faster than the 7 months the Perseverance spacecraft took. This way of thinking about distances, times, and the speed of light is so useful, in fact, that astronomers often use light units to express distances. The Sun is 93 million miles away from Earth. If we do the same calculation for how long light from the Sun takes to reach us on Earth, it is 8 minutes. That’s about three times as long as light takes to get to and from Mars. We can now express the distances d to the Sun and Mars, in light units: dSun = 8 light minutes and dMars = 3 light minutes
| Scenario | Speed | Scenario | Speed |
| Drift speed of the continents | 3 × 10⁻⁹ m/s | Orbital speed of the Earth around the Sun | 30 km/s |
| Growth speed of human hair | 5 × 10⁻⁹ m/s | Escape speed from the Solar System (at the distance of Earth) | 40 km/s |
| Automobile | 100 km/hour = 28 m/s | Fastest human-made object | 110 km/s |
| Rotational speed of the Earth at the Equator | 1700 km/hour = 480 m/s | Orbital speed of the Sun around the Galaxy | 220 km/s |
| Orbital speed in low-Earth orbit | 8 km/s | Escape speed from the Galaxy (at the location of the Sun) | 310 km/s |
| Escape speed at Earth's surface | 11 km/s | Speed of light = c | 3 × 10⁵ km/s |
Worked Example: Light Units
Show that 1 light year is equal to 9.46 trillion km.
Recall that a light year is the distance that light travels in 1 year. We can use the relationship between time, distance and speed, along with unit conversions, to show this.
distance = (speed)×(time)
Here, we know the speed--the speed of light--and can express it in any units...let's use km/s, since the answer is in units of km. In the equation below, we use 3×10⁵ km/s for the speed. For the time, we use 1 year and convert this to seconds.
distance = (3×10⁵ km/s)×(1 year)
distance = (3×10⁵ km/s)×(1 year)×(365 days/1 yr)×(24 hours/1 day)×(60 min/1 hr)×(60 sec/1 min) = 9.46×10¹² km
Recall that a light year is the distance that light travels in 1 year. We can use the relationship between time, distance and speed, along with unit conversions, to show this.
distance = (speed)×(time)
Here, we know the speed--the speed of light--and can express it in any units...let's use km/s, since the answer is in units of km. In the equation below, we use 3×10⁵ km/s for the speed. For the time, we use 1 year and convert this to seconds.
distance = (3×10⁵ km/s)×(1 year)
distance = (3×10⁵ km/s)×(1 year)×(365 days/1 yr)×(24 hours/1 day)×(60 min/1 hr)×(60 sec/1 min) = 9.46×10¹² km
This is equal to 9.46 trillion km.
How long does it take light from the Sun to reach Saturn, in minutes?
Start with the average distance from the Sun to Saturn in km, which is 1.4 billion km.
Show Answer
Light from the Sun is traveling at the speed of light, or 3×10⁵ km/s.
time = (distance)/(speed) = (1.4×10⁹ km)/(3×105 km/s) = 4,667 seconds
(4667 sec)(1 min/60 sec) = 78 minutes
We can thus say that Saturn is 78 light minutes away from the Sun.
How about the closest star to the Sun? That’s a red star named Proxima Centauri, and it is staggering 40,208,000,000,000 km (40 trillion km or 4×10¹³ km) away. In light units, however, this distance is 4 light years. It takes light 4 years to reach Proxima Centauri. The distances in light units to some nearby astronomical objects are shown in Figure 4. Light units are very convenient for expressing distances to stars that have intriguing planets orbiting them, as this tells us how long a radio signal would take to arrive at the star system. Also, light units remind us that we have a way of looking into the past! Notice in Figure 4 that the Andromeda galaxy is 2.5 million light years away. This means that light from Andromeda takes 2.5 million years to reach us, and that consequently we are seeing Andromeda as it looked 2.5 million years ago. This gives astronomers a way to see how the oldest galaxies in the universe, that are more than 13 billion light years away, looked when they were very young!
Concept Check: Distances
In Figure 4, the distance of 12 light minutes from Earth to Mars is actually the average, as the distance from Earth to Mars varies from 3 light minutes to 22 light minutes (at the furthest distance, it is on the opposite side of the Sun compared to Earth). When Mars and the Earth are at their closest distance, how long does it take light from the Sun to reach Mars?
It may help to make a sketch of the alignment of the Sun, Mars and Earth when Mars and Earth are closest to each other.
Show Sketch and Answer
The left panel shows the alignment of the Sun, Earth, and Mars when Mars is closest to the Earth. The time for sunlight to reach the Earth is 8 light minutes and the time for light to travel from Earth to Mars is 3 light minutes at closest approach. Thus, the total time is 8 light min + 3 light min = 11 light min
Other units of distance in astronomy
If you look up the distance to an astronomical object, the units will vary. For example, the distance to the star Vega might be reported in light years or parsecs -- it is 25 light years away which is the same as 7.8 parsecs. The Oort cloud surrounding our solar system is 50,000 AU away. Let's introduce these units as well.
Astronomical Units
When reporting distances within solar systems, astronomical units (AU) are typically used. One AU is defined to be the average distance from the Earth to the Sun. Mercury and Venus are closer to the Sun than the Earth and thus have distances in AU that are less than 1 AU. Saturn is at about 10 AU from the Sun and Neptune is at 30 AU.
When you read about the distance of an exoplanet from its host star, these are also reported in AU and have the exact same meaning as in our solar system. The exoplanet Proxima b orbits the red star Proxima Centauri, and Proxima b is an average distance of 0.0485 AU away from Proxima Centauri. This means Proxima b is very close to its star: it is nearly 2 orders of magnitude closer to Proxima Centauri than the Earth is from the Sun.
Parsecs
Parsecs (abbreviated pc) and light years have similar values:
1 pc = 3.26 light years
It is usually a matter of context in deciding which units to use although it is usually more intuitive for students to use light units.
The Big Bang and the Expanding Universe
Hubble's Law
In 1929, Edwin Hubble published a now-famous paper in the Publications of the National Academy of Science titled, "A Relation between Distance and Radial Velocity in Extragalactic Nebulae.'' In this paper he included a Table of data (reproduced below) showing distances, r, and radial velocities, v, to a couple of dozen "extragalactic nebulae,'' objects that we now understand to be other galaxies.
The "radial'' velocity is the component of velocity along our line of sight to an object. We defer a discussion of how the galactic velocities were measured to the chapter on spectroscopy, but for now, trust us... measuring radial velocities of galaxies is bread-and-butter astronomy.
Hubble sorted the galaxies by distance and immediately noticed a correlation: the more distant galaxies generally had larger radial velocities than closer galaxies. It was also clear that most galaxies - especially those at large distances - are moving away from us (by convention, positive velocities recede from us and negative velocities approach us). A few scientists of the day had already predicted this result as a critical test for a Big Bang.
Hubble plotted up his data and derived the best-fit linear velocity-distance relation. There is some scatter in Hubble's diagram. Some of this was the result of errors in the data, particularly the distances to galaxies. However, our Milky Way is one of a few dozen galaxies in what we call the Local Group. Galaxies in clusters are gravitationally bound and have orbital velocities that are larger than velocities from the expansion of the universe. Some of the velocities of galaxies in the Local Group (like the Andromeda Galaxy) are directed toward us -- those galaxies have negative velocities. Hubble's law really applies only to distant galaxies beyond the Local Group.
The speed with which galaxies are moving apart is called the recession speed. Let's think about what this linear relation between distance and recession speed means. Imagine that Galaxy A is initially at a distance d, and Galaxy B is initially at a distance 2d. Now, let enough time pass so that Galaxy A is at a distance 2d. If the expansion of space is constant everywhere, then Galaxy B will have moved to a distance 4d in that same time interval. Speed is distance divided by time; since Galaxy B travels twice the distance of Galaxy A in the same time interval, it must be traveling at twice the speed. When the expansion of the universe is constant, distance is proportional to recession velocity.
Concept Check
Can you think of how it might be possible to deduce the age of the universe from Hubble's data?
At first glance, it is tempting to conclude that the universe is expanding away from us - that we are the center of the universe. In fact, there is nothing special about our place in the universe. From the perspective of observers in every galaxy, most other galaxies seem to be receding. Indeed, alien astronomers in other galaxies have probably already published these same results, showing the relation between the distance and velocity of other galaxies. Like Hubble, they will know that they are not at the center of the universe.
The linear relationship between distance and recession velocity in Hubble's diagram (above) is expressed by a simple equation:
$$v = H_0 d$$
The astute reader will immediately recognize this as the equation of a straight line: Here, H0 is the slope of the line and the y-intercept is zero. This equation says that the recession velocity of a galaxy is proportional to its distance. The constant of proportionality, H0, is called Hubble's constant. Mathematically, it is the slope of the line in the velocity-distance relation. The units of H0 are physically meaningful: they have units of speed per distance (typically, km/s per megaparsec or million parsecs, Mpc). Assuming that Hubble's constant is really constant (i.e., not changing over time), then once this value is determined, you can measure the velocity of a galaxy (with spectroscopy) to derive its distance. Galaxies with larger velocities are farther away. So, Equation 1 is a powerful way to estimate distances to other galaxies. But, keep in mind the chicken and egg problem - we had to measure velocities and distances for some galaxies to derive the Hubble relationship. Once that was done, we were able to lean on the linear model to find distances to other galaxies.
The Hubble constant tells us something rather surprising. The units of 1/H0, (or distance / velocity) are time, and this "time'' is none other than the age of the universe. It is incredible that we can calculate the slope of the line in Hubble's data and solve for the age of the universe. The only rookie mistake has to do with the units - make sure that the speed (distance per time - usually km/s) and distance (usually Mpc) are converted to the same units so that distance really cancels out. And then, you will want to convert to more useful units than seconds: years or billions of years.
So, to recap, Edwin Hubble measured distances to the nearest galaxies, proving that they were outside of the Milky Way. He measured the velocities of other galaxies and found a correlation between distance and recession speed, providing observational evidence that the universe is expanding, and yielding an estimate for the age of the universe. This work provided a resolution to Olbers' paradox: the universe is not infinitely old (we can calculate its age), and because it is expanding, the light from stars in the most distant galaxies has been redshifted out of the optical bandpass (a concept we will discuss more in later chapters). Hubble's work changed our perspective of our place in the universe, and astronomers honored his contributions by naming a space observatory after him: the Hubble Space Telescope (HST) has been a workhorse telescope for the community since the mid-1990's.
We started with a presentation of Edwin Hubble's observations of the expanding universe because it was intuitively easy to understand. However, the Belgian priest George Lemaitre deserves a lot of credit for pioneering modern cosmology. In 1927, two years before Hubble's famous paper, Lemaitre published a paper with the rather wordy title: "A homogeneous universe of constant mass and growing radius accounting for the radial velocity of extragalactic nebulae." We now know Lemaitre's model as "Hubble's law" but it was Lemaitre who worked out the theory of the expanding universe with pencil and paper, based on Einstein's theory of general relativity. He proposed that the recession velocity of galaxies (extragalactic nebulae) could be explained by this expansion, and he derived the first estimate for the rate of expansion, which is now known as the Hubble constant, H0. Lemaitre gets extra credit for persisting in the face of a harsh critic; Einstein himself reportedly told him: "Sir, your calculations are correct, but your physics is atrocious." In the 1930s the idea that the universe was expanding was an extraordinary claim, and it would require extraordinary evidence (to borrow a phrase from Carl Sagan) before this theory was accepted. This evidence is described in the supplementary chapter "An Expanding Universe."
Key Concepts and Summary
The scale of space and time in the universe is so enormous that we need strategies to organize a basic understanding of where and when. The cosmic calendar re-scales the 13.8 billion year age of the universe into a "cosmic year", effectively capturing the timing for the rise of life and the very recent appearance of modern humans. The exponential spatial scale of the universe is captured as powers of ten, to compare the smallest and largest sizes and distances. A common unit for distances is light travel time: light could travel the circumference of the Earth seven times in just one second. It takes light 8 minutes to travel from the Sun to the Earth; 4.3 years to travel from Earth to the nearest star system, alpha Centauri, and 2.5 million years to travel to the closest spiral galaxy, Andromeda. Another important distance scale in astronomy is the distance from the Sun to the Earth: 1 Astronomical Unit or 1 AU. The Hubble law measures the speed at which the universe is expanding, and enables us to estimate the age of the universe.
Review Questions
Summary Questions
- How does the "cosmic calendar" help in understanding when key events happened for the development of life on Earth?
- How do you compare the size (or any property) of two objects using powers of ten?
- How does the smallest size we can observe compare with the largest size? Give an example of two objects that vary by 8 orders of magnitude. How about 17 orders of magnitude?
- What are light units? Why is it convenient for astronomers to use light units when expressing distances?
- How does measuring the rate of expansion of the universe enable us to estimate its age?
Exercises
- Using the speed in Table 2, how long will your hair grow in one month?
- The Voyager 1 spacecraft is traveling at a speed of 38,000 miles per hour (17 km/s). Express this speed in light years per second (ly/s). How long would it take Voyager 1 to reach the closest star to the Sun, Proxima Centauri, which is 4.3 light years away?
- There are some additional exercises using powers of ten and scientific notation here (with solutions).
All matter, life included, is made up of atoms. Here we discuss the inner workings of atoms. This will be relevant as we work to understand the chemistry and biology of life.
Learning Objectives
By the end of this chapter, you will be able to:
- Describe atoms and how they relate to chemical elements
- Understand the properties of the subatomic particles electrons, protons, and neutrons
- Explain what ions and isotopes of an atom are
- Describe the cosmic abundance of different elements
Atomic Theory
Atomic theory provides a microscopic explanation of the many macroscopic properties of matter that you can directly test yourself in a chemistry laboratory. Every piece of matter we interact with, whether living or non-living, is made out of atoms.
The word atom comes from the Greek word for "indivisible." This naming is based on an idea held by some ancient philosophers---the Atomists, as discussed in the History of Astrobiology chapter---that all matter is composed of small, finite particles that differ in shape and size and that join together in different ways.
A modern understanding of atomic theory began in the early 1800s with John Dalton, an English schoolteacher. Through observations and experiments, Dalton demonstrated that atoms exist and correspond to different elements. Pure elements consist of only one type of atom, which has certain properties characteristic of that element. As an example, Figure 1 shows a pure copper penny, which means the penny is entirely made up of copper atoms that are linked or bonded together.
Because an element consists of only one kind of atom, an element cannot be broken down into a different substance. All atoms of a given element have identical chemical properties. Inversely, atoms of a given element differ in properties from atoms of all other elements.
An atom is the smallest unit of an element that can participate in a chemical reaction. Atoms are neither created nor destroyed during a chemical reaction; they are instead rearranged to yield substances that are different from the substances present before the reaction (Figure 2). This property is captured in the law of conversation of matter. Because the number and nature of atoms remains constant before and after a chemical reaction (it is only the configuration of atoms that changes), the total mass of matter before and after a chemical reaction also remains constant.
Going Subatomic
After establishing the existence of atoms, the inquiring mind is tempted to explore deeper: what are atoms themselves made of?
Discovery of Subatomic Particles
The first evidence of subatomic particles came in the late 1800s when different rays, meaning beams of light or radiation, were used to probe the structure of atoms. Rays differ in energy level and source. Some rays were found to emanate from certain elements, which we now call radioactive.
In 1897, the English physicist J. J. Thomson was the first to discover a subatomic particle from investigations of a type of ray called cathode rays. Thomson found that cathode rays are made up of actual particles that are much smaller than atoms. Experiments showed that these particles could be extracted from any atom, and that they carried a discrete amount of negative electric charge. He named these particles electrons.
Soon thereafter, Marie Curie discovered radium, a radioactive element, in 1898. Curie's pioneering work in developing the theory of radiation was recognized by a Nobel Prize in Physics, and her work discovering the radioactive elements polonium and radium was awarded a Nobel Prize in Chemistry. Marie Curie was the first woman to be awarded a Nobel Prize, and she is one of only four people (as well as the only woman) to win the Nobel Prize twice.
Ernest Rutherford, a physicist from New Zealand who largely spent his scientific career in Canada and England, showed that radium can be used to produce alpha (α) rays, beams of tiny, high-speed, positively charged particles called alpha particles. Between 1908 and 1913, Rutherford directed a series of experiments using alpha rays in collaboration with, Hans Geiger, later famous for the Geiger counter, and Ernest Marsden, an undergraduate student at the time.
Geiger and Marsden aimed alpha rays at a very thin foil of gold and other various metals. They found that alpha particles did one of three things: (1) most of the alpha particles passed right through the foil, (2) some particles were diverted slightly, and (3) a very small number of particles were deflected almost straight back towards the source of the alpha rays. Rutherford described the behavior of the small number of particles being deflected back as follows:
It was quite the most incredible event that has ever happened to me in my life. It was almost as incredible as if you fired a 15-inch shell at a piece of tissue paper and it came back and hit you1
Let us examine what can be learned by the three different behaviors exhibited by alpha particles in this experiment. Undeflected alpha particles were not affected by the foil at all, so they must have travelled through essentially empty space inside the atom. Because most particles passed right through, this suggests that an atom largely consists of empty space.
We know that alpha particles are positively charged, and that like charges repel each other (like how the ends of magnets that have the same charge will repel each other rather than attract). The deflected alpha particles therefore must have encountered another positive charge within an atom that repelled the alpha particles, causing their paths to be diverted or deflecting the particles straight back towards the source. The smaller number of diverted and deflected particles suggests the existence of a nucleus, a small, positively charged body at the center of each atom.
These experiments led to an understanding of the atom as a small, positively charged nucleus, in which most of the mass of the atom is concentrated, surrounded by negatively charged electrons. Because atoms are electrically neutral, the positive charge of the nucleus must be balanced by the negative charge of electrons.
After many more experiments, Rutherford established that the nuclei (the plural of nucleus) of all other elements contain the nucleus of a hydrogen atom. He named this more fundamental "building block" particle a proton to refer to the positively charged, subatomic particle found in the nucleus of atoms. We now know that the nucleus of hydrogen atoms consist of just a single proton.
The nucleus was known to contain almost all the mass of an atom, but it was found that the number of protons accounted for only half, or less, of the mass of the nucleus. It was proposed that there existed neutral particles in the nucleus as well as the positively charged protons. However, detecting uncharged particles is very challenging as they do not interact with charged particles. It was not until 1932 that James Chadwick, a British physicist, found evidence of of these neutral particles now called neutrons. Neutrons are uncharged, subatomic particles found in the nuclei of atoms with approximately the same mass as a proton.
Atomic Structure
We now understand that each atom is composed of a very small nucleus, made up of positively charged protons and uncharged neutrons, and that this nucleus is surrounded by a much larger volume of space in which negatively charged electrons exist.
The nucleus contains the majority of an atom’s mass because protons and neutrons are much heavier than electrons, whereas electrons occupy almost all of an atom’s volume. The diameter of an atom is on the order of 10−10 m, whereas the diameter of the nucleus is roughly 10−15 m---about 100,000 times smaller. To contextualize this, if an atom's nucleus was the size of a blueberry, the diameter of the atom would be roughly the size of a football stadium (Figure 3).
Properties of Electrons, Protons, and Neutrons
Atoms—and the protons, neutrons, and electrons that compose them—are extremely small. For example, mass may typically be measured in terms of grams (g); a classic M&M is about 1 g. The mass of a single carbon atom is less than 2 × 10⁻²³ g. An electron is over a thousand times less massive, with a mass on the order of 1 × 10⁻²⁶ g. Protons and electrons also carry electric charge in very small amounts that are unwieldy to express using more typical units.
When describing the properties of atoms and their subatomic particles, we therefore make use of appropriately small units of measure. Rather than grams, we use the atomic mass unit (amu), which is approximately the mass of one proton. For electric charge, we use the fundamental unit of charge (e), which is equivalent to the electric charge on a single proton. In other words, a proton has a mass of ~1 amu and a charge of +1 e. Table 1 summarizes the properties of these subatomic particles.
| Name | Location | Charge (e) | Mass (amu) | Mass (g) |
|---|---|---|---|---|
| electron | outside nucleus | -1 | 0.00055 | 0.00091 × 10⁻²⁴ |
| proton | nucleus | +1 | 1.00727 | 1.67262 × 10⁻²⁴ |
| neutron | nucleus | 0 | 1.00866 | 1.67493 × 10⁻²⁴ |
Characterizing Atoms
Recall that all atoms of a given element have identical and unique chemical properties. The chemical properties of an atom are a function of the subatomic particles contained with that atom.
A defining trait of an element is its atomic number (Z), the amount of protons in the nucleus of an atom of that element. The atomic number determines the identity of the atom. For example, helium has an atomic number of 2. All helium atoms therefore have two protons, and all atoms with two protons are helium atoms. This is true regardless of how many neutrons and electrons an atom has.
For neutral atoms, atoms that carry no electric charge, the positive charge from protons must be balanced out by the negative charge of electrons. For example, we know that a helium atom contains two protons. A neutral helium atom must therefore also contain two electrons. For neutral atoms, this means that the atomic number also corresponds to the number of electrons in the atom.
An atom's mass number (A) gives the total number of protons and neutrons in the atom. Recall that an element is defined by its atomic number (Z), the number of protons in its atoms neuclei, regardless of the number of neutrons. We can use the mass number to calculate the number of neutrons in an atom as the difference between the mass number and the atomic number, i.e. A - Z = the number of neutrons. For example, if a helium atom, which has two protons, has a mass number of 4, we can calculate that this helium atom has 2 neutrons (4-2).
Ions
Recall that neutral atoms contain the same number of positively charged protons and negatively charged electrons; the charges from the protons and electrons cancel each other out so that the atom has a net zero electric charge. An ion is an atom that does carry an electric charge because there are either more electrons or less electrons than there are protons. The electric charge of an atom is define as follows:
Atomic charge = number of protons − number of electrons
Atoms typically acquire charge by gaining or losing electrons. An atom that gains one or more electrons electrons will carry a negative charge. These negatively charged ions are called anions. Positively charged atoms, called cations, have lost one or more electrons.
As an example, consider the helium (He) atom characterized in Figure 4. Recall that helium has an atomic number of 2, which indicates that all helium atoms have two protons. A neutral helium atom therefore has two electrons. If a helium atom gains one electron, it will have three electrons total (2+1) and become an anion with a charge of -1 e. If a helium atom loses one electron, it will have one electron left (2-1) and become a cation with a charge of +1 e. The helium atom in Figure 4 has a charge of +2 e, meaning it has lost both of its electrons.
Isotopes
The number of protons in an atom defines the type of element it is; if the number of protons in an atom changes, the type of atom it is also changes. The number of electrons can change and defines the charge of the atom. What about the number of neutrons?
During the early 1900s, it was discovered that an element could have atoms with different masses. Despite the different masses of these atoms, they were otherwise indistinguishable from one another. The difference in masses corresponded more closely to the mass of neutrons and protons, which have similar masses, than the mass of electrons, which are less massive by about a factor of 2,000 (see Table 1). It was therefore deduced that these atoms have different masses because they possess different numbers of neutrons.
Such atoms are called isotopes---atoms of the same element that have differing amounts of neutrons.
An isotope of an element is specified by the mass number (A) written as a superscript to the left of the element symbol (see Figure 4). For example, magnesium naturally occurs in the form of three different isotopes that have mass numbers of 24, 25, and 26. These isotopes would be written as 24Mg, 25Mg, and 26Mg respectively. These isotope symbols are read "element, mass number." For instance, 24Mg is read as “magnesium 24,” and can be written as “magnesium-24” or “Mg-24.”
Unstable Isotopes
Not all isotopes of an element are stable. Unstable elements undergo a process known as radioactive decay, in which the subatomic particles in a an atom changes. These unstable elements are described as radioactive. As unstable nuclei decay, they often change from one isotope into another and sometimes into different elements depending on whether the number of neutrons or protons changes in the nucleus. The rate of radioactive decay is commonly characterized by half-life, the amount of time in which approximately half the number of atoms will have decayed.
Let's consider as an example uranium-238, which can also be written [latex]_{92}^{238}\text{U}[/latex], meaning it has 92 protons and and 238-92=146 neutrons. Uranium-238 has a half-life of 4.5 billion years. If we had a sample of 12 uranium-238 atoms, then after 4.5 billion years we expect that 6 of those atoms will have undergone radioactive decay. In other words, over 4.5 billion years, each uranium-238 atom has a half/half or 50% chance of decaying.
When uranium-238 decays, it emits an alpha particle; an alpha particle consists of two protons and two neutrons. Because it gives rise to an alpha particle, this process is known as alpha decay and can produce alpha rays.
Recall that uranium-238 has 92 protons and and 238-92=146 neutrons. With the emission of an alpha particle, a uranium-238 atom loses two protons and two neutrons. This decay results in an atom with 90 protons and 144 neutrons. Because the number of protons has changed, the nature of the atom has also changed. An atom with 90 protons, and therefore an atomic number of 90, is a thorium (Th) atom. The mass number of this atom is the combined number of protons and neutrons it has, 90+144=234. Therefore, we see that when undergoing radioactive decay, a uranium-238 atom has decayed into a thorium-234 atom.
The process of radioactive decay is happening around us all the time. If a radioactive nucleus decays into another radioactive nucleus, then another decay can happen. This chain of reactions is called a "decay chain". Eventually, the resulting nucleus may be stable and no longer decay. Most of the nuclei in the natural world appear to be stable, but there is a possibility that all nuclei will eventually decay if given enough time. We do not yet know if "stable" nuclei are just extremely long lived.
Cosmic Abundance of Elements
After the Big Bang, there were only a few elements in existence: hydrogen, helium, and a sprinkling of lithium. As described in the section "Assembling the Periodic Table," we know that the majority of the remaining elements, including most of those which make up the Earth, were formed at the cores of stars. These elements were then distributed throughout the cosmos through their violent and explosive deaths.
We have used spectroscopy to identify the chemical composition of other stars, giant molecular clouds, and even the gas around and between galaxies. These measurements allow us to calculate the abundance of various elements and isotopes. We see that the universal abundance of elements match what is expected from the processes that create them.
These observations of abundances throughout the universe suggest that the laws governing chemistry and physics that we observe on Earth also operate the same way on any other planet at any other location in our galaxy and beyond. Therefore, if we can understand the chemical origins of life on Earth and in our solar system, we would gain insights into when, where, and how life might arise on other worlds.
Figure 5 shows the relative abundances of different elements in the Solar System. What are the most common elements?

Concept Check
All life on Earth is based on four elements: hydrogen (H), carbon (C), nitrogen (N) and oxygen (O). How common are each of these elements in the solar system, according to Figure 5?
Why might life not use the element helium (He) for life? Explain your answer!
Hydrogen, carbon, nitrogen, and oxygen form the basis of life, but how do we move from single atoms to complicated living things? To take the first step, we consider the chemistry of how atoms bond together to form molecules.
Key Concepts and Summary
Atoms are fundamental units in chemistry that explain the Periodic Table as a sequence with increasing numbers of protons. The nucleus of an atom is comprised of positively charged protons and uncharged neutrons. It is the number of protons in the nucleus that defines the element - isotopes of elements have different numbers of neutrons. In an electrically neutral atom, the number of electrons equals the number of protons. After the Big Bang, the only elements that emerged were hydrogen, helium, and traces of lithium. All other elements were forged in the cores of stars or during highly energetic explosions. The elements in the universe today are generally decreasing in abundance with increasing atomic mass (i.e., highest atomic mass elements are rarest), but this trend is modulated by even-odd atomic numbers, a signature of the fusion of alpha particles.
Review Questions
Summary Questions
- What is an atom?
- How are atoms relate to chemical elements?
- What is the difference between an atom and a molecule?
- What three "subatomic" particles are found inside an atom? Describe the similarities and differences between them.
- How are different isotopes of a particular element distinguished? What are some reasons that certain isotopes are more common than others?
- Which elements are the most common and which elements are the least common in our universe? How does astrophysics help explain this?
Activities
- Building atoms. Open the "Build an atom" simulator (https://phet.colorado.edu/en/simulations/build-an-atom) and select the Atom option. Build the following:
- hydrogen, deuterium, tritium
- lithium (is this atom stable?)
- carbon, carbon-12, carbon-13
All matter, life included, is made up of atoms. Here we discuss the inner workings of atoms. This will be relevant as we work to understand the chemistry and biology of life.
Learning Objectives
By the end of this chapter, you will be able to:
- Describe atoms and how they relate to chemical elements
- Understand the properties of the subatomic particles electrons, protons, and neutrons
- Explain what ions and isotopes of an atom are
- Describe the cosmic abundance of different elements
Atomic Theory
Atomic theory provides a microscopic explanation of the many macroscopic properties of matter that you can directly test yourself in a chemistry laboratory. Every piece of matter we interact with, whether living or non-living, is made out of atoms.
The word atom comes from the Greek word for "indivisible." This naming is based on an idea held by some ancient philosophers---the Atomists, as discussed in the History of Astrobiology chapter---that all matter is composed of small, finite particles that differ in shape and size and that join together in different ways.
A modern understanding of atomic theory began in the early 1800s with John Dalton, an English schoolteacher. Through observations and experiments, Dalton demonstrated that atoms exist and correspond to different elements. Pure elements consist of only one type of atom, which has certain properties characteristic of that element. As an example, Figure 1 shows a pure copper penny, which means the penny is entirely made up of copper atoms that are linked or bonded together.
Because an element consists of only one kind of atom, an element cannot be broken down into a different substance. All atoms of a given element have identical chemical properties. Inversely, atoms of a given element differ in properties from atoms of all other elements.
An atom is the smallest unit of an element that can participate in a chemical reaction. Atoms are neither created nor destroyed during a chemical reaction; they are instead rearranged to yield substances that are different from the substances present before the reaction (Figure 2). This property is captured in the law of conversation of matter. Because the number and nature of atoms remains constant before and after a chemical reaction (it is only the configuration of atoms that changes), the total mass of matter before and after a chemical reaction also remains constant.
Going Subatomic
After establishing the existence of atoms, the inquiring mind is tempted to explore deeper: what are atoms themselves made of?
Discovery of Subatomic Particles
The first evidence of subatomic particles came in the late 1800s when different rays, meaning beams of light or radiation, were used to probe the structure of atoms. Rays differ in energy level and source. Some rays were found to emanate from certain elements, which we now call radioactive.
In 1897, the English physicist J. J. Thomson was the first to discover a subatomic particle from investigations of a type of ray called cathode rays. Thomson found that cathode rays are made up of actual particles that are much smaller than atoms. Experiments showed that these particles could be extracted from any atom, and that they carried a discrete amount of negative electric charge. He named these particles electrons.
Soon thereafter, Marie Curie discovered radium, a radioactive element, in 1898. Curie's pioneering work in developing the theory of radiation was recognized by a Nobel Prize in Physics, and her work discovering the radioactive elements polonium and radium was awarded a Nobel Prize in Chemistry. Marie Curie was the first woman to be awarded a Nobel Prize, and she is one of only four people (as well as the only woman) to win the Nobel Prize twice.
Ernest Rutherford, a physicist from New Zealand who largely spent his scientific career in Canada and England, showed that radium can be used to produce alpha (α) rays, beams of tiny, high-speed, positively charged particles called alpha particles. Between 1908 and 1913, Rutherford directed a series of experiments using alpha rays in collaboration with, Hans Geiger, later famous for the Geiger counter, and Ernest Marsden, an undergraduate student at the time.
Geiger and Marsden aimed alpha rays at a very thin foil of gold and other various metals. They found that alpha particles did one of three things: (1) most of the alpha particles passed right through the foil, (2) some particles were diverted slightly, and (3) a very small number of particles were deflected almost straight back towards the source of the alpha rays. Rutherford described the behavior of the small number of particles being deflected back as follows:
It was quite the most incredible event that has ever happened to me in my life. It was almost as incredible as if you fired a 15-inch shell at a piece of tissue paper and it came back and hit you1
Let us examine what can be learned by the three different behaviors exhibited by alpha particles in this experiment. Undeflected alpha particles were not affected by the foil at all, so they must have travelled through essentially empty space inside the atom. Because most particles passed right through, this suggests that an atom largely consists of empty space.
We know that alpha particles are positively charged, and that like charges repel each other (like how the ends of magnets that have the same charge will repel each other rather than attract). The deflected alpha particles therefore must have encountered another positive charge within an atom that repelled the alpha particles, causing their paths to be diverted or deflecting the particles straight back towards the source. The smaller number of diverted and deflected particles suggests the existence of a nucleus, a small, positively charged body at the center of each atom.
These experiments led to an understanding of the atom as a small, positively charged nucleus, in which most of the mass of the atom is concentrated, surrounded by negatively charged electrons. Because atoms are electrically neutral, the positive charge of the nucleus must be balanced by the negative charge of electrons.
After many more experiments, Rutherford established that the nuclei (the plural of nucleus) of all other elements contain the nucleus of a hydrogen atom. He named this more fundamental "building block" particle a proton to refer to the positively charged, subatomic particle found in the nucleus of atoms. We now know that the nucleus of hydrogen atoms consist of just a single proton.
The nucleus was known to contain almost all the mass of an atom, but it was found that the number of protons accounted for only half, or less, of the mass of the nucleus. It was proposed that there existed neutral particles in the nucleus as well as the positively charged protons. However, detecting uncharged particles is very challenging as they do not interact with charged particles. It was not until 1932 that James Chadwick, a British physicist, found evidence of of these neutral particles now called neutrons. Neutrons are uncharged, subatomic particles found in the nuclei of atoms with approximately the same mass as a proton.
Atomic Structure
We now understand that each atom is composed of a very small nucleus, made up of positively charged protons and uncharged neutrons, and that this nucleus is surrounded by a much larger volume of space in which negatively charged electrons exist.
The nucleus contains the majority of an atom’s mass because protons and neutrons are much heavier than electrons, whereas electrons occupy almost all of an atom’s volume. The diameter of an atom is on the order of 10−10 m, whereas the diameter of the nucleus is roughly 10−15 m---about 100,000 times smaller. To contextualize this, if an atom's nucleus was the size of a blueberry, the diameter of the atom would be roughly the size of a football stadium (Figure 3).
Properties of Electrons, Protons, and Neutrons
Atoms—and the protons, neutrons, and electrons that compose them—are extremely small. For example, mass may typically be measured in terms of grams (g); a classic M&M is about 1 g. The mass of a single carbon atom is less than 2 × 10⁻²³ g. An electron is over a thousand times less massive, with a mass on the order of 1 × 10⁻²⁶ g. Protons and electrons also carry electric charge in very small amounts that are unwieldy to express using more typical units.
When describing the properties of atoms and their subatomic particles, we therefore make use of appropriately small units of measure. Rather than grams, we use the atomic mass unit (amu), which is approximately the mass of one proton. For electric charge, we use the fundamental unit of charge (e), which is equivalent to the electric charge on a single proton. In other words, a proton has a mass of ~1 amu and a charge of +1 e. Table 1 summarizes the properties of these subatomic particles.
| Name | Location | Charge (e) | Mass (amu) | Mass (g) |
|---|---|---|---|---|
| electron | outside nucleus | -1 | 0.00055 | 0.00091 × 10⁻²⁴ |
| proton | nucleus | +1 | 1.00727 | 1.67262 × 10⁻²⁴ |
| neutron | nucleus | 0 | 1.00866 | 1.67493 × 10⁻²⁴ |
Characterizing Atoms
Recall that all atoms of a given element have identical and unique chemical properties. The chemical properties of an atom are a function of the subatomic particles contained with that atom.
A defining trait of an element is its atomic number (Z), the amount of protons in the nucleus of an atom of that element. The atomic number determines the identity of the atom. For example, helium has an atomic number of 2. All helium atoms therefore have two protons, and all atoms with two protons are helium atoms. This is true regardless of how many neutrons and electrons an atom has.
For neutral atoms, atoms that carry no electric charge, the positive charge from protons must be balanced out by the negative charge of electrons. For example, we know that a helium atom contains two protons. A neutral helium atom must therefore also contain two electrons. For neutral atoms, this means that the atomic number also corresponds to the number of electrons in the atom.
An atom's mass number (A) gives the total number of protons and neutrons in the atom. Recall that an element is defined by its atomic number (Z), the number of protons in its atoms neuclei, regardless of the number of neutrons. We can use the mass number to calculate the number of neutrons in an atom as the difference between the mass number and the atomic number, i.e. A - Z = the number of neutrons. For example, if a helium atom, which has two protons, has a mass number of 4, we can calculate that this helium atom has 2 neutrons (4-2).
Ions
Recall that neutral atoms contain the same number of positively charged protons and negatively charged electrons; the charges from the protons and electrons cancel each other out so that the atom has a net zero electric charge. An ion is an atom that does carry an electric charge because there are either more electrons or less electrons than there are protons. The electric charge of an atom is define as follows:
Atomic charge = number of protons − number of electrons
Atoms typically acquire charge by gaining or losing electrons. An atom that gains one or more electrons electrons will carry a negative charge. These negatively charged ions are called anions. Positively charged atoms, called cations, have lost one or more electrons.
As an example, consider the helium (He) atom characterized in Figure 4. Recall that helium has an atomic number of 2, which indicates that all helium atoms have two protons. A neutral helium atom therefore has two electrons. If a helium atom gains one electron, it will have three electrons total (2+1) and become an anion with a charge of -1 e. If a helium atom loses one electron, it will have one electron left (2-1) and become a cation with a charge of +1 e. The helium atom in Figure 4 has a charge of +2 e, meaning it has lost both of its electrons.
Isotopes
The number of protons in an atom defines the type of element it is; if the number of protons in an atom changes, the type of atom it is also changes. The number of electrons can change and defines the charge of the atom. What about the number of neutrons?
During the early 1900s, it was discovered that an element could have atoms with different masses. Despite the different masses of these atoms, they were otherwise indistinguishable from one another. The difference in masses corresponded more closely to the mass of neutrons and protons, which have similar masses, than the mass of electrons, which are less massive by about a factor of 2,000 (see Table 1). It was therefore deduced that these atoms have different masses because they possess different numbers of neutrons.
Such atoms are called isotopes---atoms of the same element that have differing amounts of neutrons.
An isotope of an element is specified by the mass number (A) written as a superscript to the left of the element symbol (see Figure 4). For example, magnesium naturally occurs in the form of three different isotopes that have mass numbers of 24, 25, and 26. These isotopes would be written as 24Mg, 25Mg, and 26Mg respectively. These isotope symbols are read "element, mass number." For instance, 24Mg is read as “magnesium 24,” and can be written as “magnesium-24” or “Mg-24.”
Unstable Isotopes
Not all isotopes of an element are stable. Unstable elements undergo a process known as radioactive decay, in which the subatomic particles in a an atom changes. These unstable elements are described as radioactive. As unstable nuclei decay, they often change from one isotope into another and sometimes into different elements depending on whether the number of neutrons or protons changes in the nucleus. The rate of radioactive decay is commonly characterized by half-life, the amount of time in which approximately half the number of atoms will have decayed.
Let's consider as an example uranium-238, which can also be written [latex]_{92}^{238}\text{U}[/latex], meaning it has 92 protons and and 238-92=146 neutrons. Uranium-238 has a half-life of 4.5 billion years. If we had a sample of 12 uranium-238 atoms, then after 4.5 billion years we expect that 6 of those atoms will have undergone radioactive decay. In other words, over 4.5 billion years, each uranium-238 atom has a half/half or 50% chance of decaying.
When uranium-238 decays, it emits an alpha particle; an alpha particle consists of two protons and two neutrons. Because it gives rise to an alpha particle, this process is known as alpha decay and can produce alpha rays.
Recall that uranium-238 has 92 protons and and 238-92=146 neutrons. With the emission of an alpha particle, a uranium-238 atom loses two protons and two neutrons. This decay results in an atom with 90 protons and 144 neutrons. Because the number of protons has changed, the nature of the atom has also changed. An atom with 90 protons, and therefore an atomic number of 90, is a thorium (Th) atom. The mass number of this atom is the combined number of protons and neutrons it has, 90+144=234. Therefore, we see that when undergoing radioactive decay, a uranium-238 atom has decayed into a thorium-234 atom.
The process of radioactive decay is happening around us all the time. If a radioactive nucleus decays into another radioactive nucleus, then another decay can happen. This chain of reactions is called a "decay chain". Eventually, the resulting nucleus may be stable and no longer decay. Most of the nuclei in the natural world appear to be stable, but there is a possibility that all nuclei will eventually decay if given enough time. We do not yet know if "stable" nuclei are just extremely long lived.
Cosmic Abundance of Elements
After the Big Bang, there were only a few elements in existence: hydrogen, helium, and a sprinkling of lithium. As described in the section "Assembling the Periodic Table," we know that the majority of the remaining elements, including most of those which make up the Earth, were formed at the cores of stars. These elements were then distributed throughout the cosmos through their violent and explosive deaths.
We have used spectroscopy to identify the chemical composition of other stars, giant molecular clouds, and even the gas around and between galaxies. These measurements allow us to calculate the abundance of various elements and isotopes. We see that the universal abundance of elements match what is expected from the processes that create them.
These observations of abundances throughout the universe suggest that the laws governing chemistry and physics that we observe on Earth also operate the same way on any other planet at any other location in our galaxy and beyond. Therefore, if we can understand the chemical origins of life on Earth and in our solar system, we would gain insights into when, where, and how life might arise on other worlds.
Figure 5 shows the relative abundances of different elements in the Solar System. What are the most common elements?
Concept Check
All life on Earth is based on four elements: hydrogen (H), carbon (C), nitrogen (N) and oxygen (O). How common are each of these elements in the solar system, according to Figure 5?
Why might life not use the element helium (He) for life? Explain your answer!
Hydrogen, carbon, nitrogen, and oxygen form the basis of life, but how do we move from single atoms to complicated living things? To take the first step, we consider the chemistry of how atoms bond together to form molecules.
Key Concepts and Summary
Atoms are fundamental units in chemistry that explain the Periodic Table as a sequence with increasing numbers of protons. The nucleus of an atom is comprised of positively charged protons and uncharged neutrons. It is the number of protons in the nucleus that defines the element - isotopes of elements have different numbers of neutrons. In an electrically neutral atom, the number of electrons equals the number of protons. After the Big Bang, the only elements that emerged were hydrogen, helium, and traces of lithium. All other elements were forged in the cores of stars or during highly energetic explosions. The elements in the universe today are generally decreasing in abundance with increasing atomic mass (i.e., highest atomic mass elements are rarest), but this trend is modulated by even-odd atomic numbers, a signature of the fusion of alpha particles.
Review Questions
Summary Questions
- What is an atom?
- How are atoms relate to chemical elements?
- What is the difference between an atom and a molecule?
- What three "subatomic" particles are found inside an atom? Describe the similarities and differences between them.
- How are different isotopes of a particular element distinguished? What are some reasons that certain isotopes are more common than others?
- Which elements are the most common and which elements are the least common in our universe? How does astrophysics help explain this?
Activities
- Building atoms. Open the "Build an atom" simulator (https://phet.colorado.edu/en/simulations/build-an-atom) and select the Atom option. Build the following:
- hydrogen, deuterium, tritium
- lithium (is this atom stable?)
- carbon, carbon-12, carbon-13
Life needs a source of energy to thrive. This energy can come in different forms, from sunlight to energy released when chemicals react. Light is a type of pure energy, and coded into the light and other kinds of radiation that reach us from objects in the universe is a wide range of information about what those objects are like and how they work. If we can decipher this code and read the messages it contains, we can learn an enormous amount about the cosmos without ever having to leave Earth or its immediate environment.
Learning Objectives
By the end of this chapter, you will be able to:
- Understand that there are different types of energy and that energy is conserved
- Explain the wavelength, frequency and energy of a wave or particle of light
- Discuss the different parts of the electromagnetic spectrum
- Explain how and why the light emitted by an object depends on its temperature
- Explain the difference between the luminosity and brightness of an object
- Explain how the total energy emitted differs for hot and cold objects
- Describe how spectroscopy can provide information about an object, such as a star.
- Discuss the difference between continuous, absorption and emission spectra.
Energy
Different types of energy are all around us -- the electrical energy that powers our technology, the chemical energy that is stored in the food we eat, and the heat energy we feel when when walking in sunlight. These different types of energy can be changed, or converted, from one type to another. For example, the chemical energy in food is converted to energy that allows us to think and move around. We will see other examples of energy transformations in astrobiology, such as the gravitational energy that is converted into heat when a giant cloud of gas and dust collapses and eventually forms stars.
The amount of the energy in the universe is always the same and it is continuously being changed from one form into another. This is the essence of the law of conservation of energy. Other quantities in nature, such as mass and momentum, are also conserved.
Though energy cannot be created or destroyed, it can be transformed into different forms. The two main forms of energy are kinetic energy and potential energy. Kinetic energy is the energy of motion. When an object is moving more quickly, it has more energy. A fast-moving car has more energy than a slow moving car. Thermal energy is actually a form of kinetic energy since higher temperature is really a measure of the average speed of atoms and molecules -- the higher the temperature, the greater the kinetic energy of the atoms and molecules.
Potential energy is the energy that is associated with different positions in space. When you throw a ball high into the air, it has more gravitational potential energy than when it is held in your hand. When an object moves from an area of high potential energy to low potential energy, that energy will be transformed into another form. For example, when an apple falls to the Earth, it will speed up gaining kinetic energy. But potential energy does not need to be related just to gravity. For example, the energy stored in chemicals is in the form of chemical potential energy which can be determined based on the position of different atoms bonded to each other by electric forces of attraction.
A more recently discovered form of energy is the energy associated with mass itself. Einstein's famous equation [latex]E=mc^2[/latex] tells us, that mass-energy equivalence is a fundamental feature of the universe. Any object that has mass therefore also contains energy -- this type of energy is called rest-mass energy. Inside the core of stars, nuclear fusion converts some of the rest-mass of two protons into energy. This process occurs an astounding 1038 times every second and is the source of the energy from the Sun that we receive on Earth.
Light
A great deal of the energy that life on Earth uses comes in one way or another from the Sun's light, although geothermal energy from inside the Earth can also be harnessed. Light from the Sun, or any star, is an example of electromagnetic radiation. Here, the words light and radiation are synonymous, and both are a form of energy. Radiation can sometimes be thought of as dangerous and some types are (for example, gamma rays and X rays), but radiation is a neutral term and is synonymous with energy.
One of the more bizarre aspects of light is the way that it acts, specifically the fact that it can behave like a wave and a particle. In the 17th century, the nature of light was debated and both Isaac Newton and Christiaan Huygens tried to explain it. Newton experimented with lenses and prisms and believed that light was a stream of particles, which he called corpuscles. Huygens, on the other hand, believed that light was a wave that traveled outward in all directions from a source, much like the ripples on a pond that expand outward through the water after a stone is dropped into it. Building upon pioneering work by James Clerk Maxwell and Max Planck, Albert Einstein proposed in 1905 that light can indeed behave both ways, thus solidifying the concept of wave-particle duality, one of the tenets of quantum mechanics. The wave and particle nature of light has now been experimentally verified countless times.
Light as a Wave
Light carries energy and information from one place to another, and this energy is carried in the form of electromagnetic (EM) waves. Other familiar types of waves in nature include sound waves and water waves. All three of these types of waves have some differences and some similarities.
Water and sound waves are mechanical waves and require a medium to travel in. For sound waves, the medium is air and the medium is water for water waves. If you screamed on the surface of the Moon, which has no atmosphere, nobody would hear you as the sound waves have no medium to travel through. (The director Stanley Kubrick got it right in the film 2001: A Space Odyssey.) EM waves do not require water or air or any medium to travel though – they can travel through empty space. This was such a disturbing idea to nineteenth-century scientists that they actually made up a substance to fill all of space—one for which there was no evidence—just so light waves could have something to travel through: they called it the aether. Today, we know that there is no aether and that EM waves have no trouble at all moving through empty space (as all the starlight visible on a clear night must surely be doing).
The speed of a sound wave depends on the medium through which it is traveling. A sound wave moves faster through water than it does through air, for example. However, all electromagnetic waves move at the same speed in empty space (the speed of light—approximately 300,000 kilometers per second, or 300,000,000 meters per second, which can also be written as 3×10⁸ m/s), which turns out to be the fastest possible speed in the universe.
Now for some similarities. All waves are a kind of repeating phenomenon. Whether it is the up-and-down motion of a water wave or the changing electric and magnetic fields in a wave of light, the pattern of disturbance repeats in a cyclical way. Thus, any wave motion can be characterized by a series of crests and troughs. Moving from one crest through a trough to the next crest completes one cycle. The horizontal length covered by one cycle is called the wavelength (λ). Ocean waves provide an analogy: the wavelength is the distance that separates successive wave crests. An example of water waves created when a frog leaps into a pond is shown in Figure 1.

We can also characterize different waves by their frequency, which is the number of wave cycles that pass by per second. If you count 10 crests moving by each second, for example, then the frequency is 10 cycles per second (cps). In honor of Heinrich Hertz, the late nineteenth physicist who, inspired by physicist James Clerk Maxwell’s work, discovered radio waves, a cps is also called a hertz (Hz). Take a look at your radio, for example, and you will see the channel assigned to each radio station is characterized by its frequency, usually in units of kHz (kilohertz, or thousands of hertz) or MHz (megahertz, or millions of hertz).

Concept Check: Wavelength and Frequency
Figure 3 is a schematic showing the wavelengths and frequencies for different colors of light. Red light is at the top and its wavelength (λ) is shown as the distance between two peaks, where the peaks are marked by the vertical black lines. Blue light is on the bottom; notice that it has a shorter wavelength than red light (the length between the two peaks is noticeably shorter).
The frequency of a wave is a measure of how many waves pass by in one second. Let's imagine that the amount of time that elapsed for each of the waves in Figure 3 is 1 second. Looking at red light, two full waves can pass by in this 1 second period, so we say the frequency is 2 cycles per second, or 2 Hz. (Actually, a bit more than two red light wave cycles can pass by, about 2.5, but we will say 2 full waves to keep this example simple.)
- Which color of light has the highest frequency? How about the lowest frequency?
- Which color of light has the shortest wavelength?
Show Answer
- Looking at Figure 3, the most crests pass by in one second for blue light (6 Hz) while the fewest pass by for red light. Thus, blue light has the highest frequency and red light has the lowest.
- Since blue light has the highest frequency, it also has the shortest wavelength. It is easy to see in Figure 3 that λ is shortest for blue light.
Wavelength (λ) and frequency (f) are related because all electromagnetic waves travel at the same speed. The formula for this relationship can be expressed as follows: for any wave motion, the speed at which a wave moves equals the frequency times the wavelength. Waves with longer wavelengths have lower frequencies. Mathematically, we can express this as
[latex]c = \lambda f[/latex]
where the Greek letter for “l”—lambda, λ—is used to denote wavelength and c is the scientific symbol for the speed of light.
The electromagnetic wave model of light (as formulated by James Clerk Maxwell) was one of the great triumphs of nineteenth-century science. In 1887, when Heinrich Hertz actually made invisible electromagnetic waves (what today are called radio waves) on one side of a room and detected them on the other side, it ushered in a new era that led to the modern age of telecommunications. His experiment ultimately led to the technologies of television, cell phones, and today’s wireless networks around the globe.
Light as a Photon
By the beginning of the twentieth century, physicists had to reluctantly accept that sometimes light behaves more like a “particle”—or at least a self-contained packet of energy—than a wave. We call such a packet of electromagnetic energy a photon.
A photon carries a specific amount of energy. How much energy a photon has depends on its frequency. We can use the idea of energy to connect the photon and wave models. How much energy a photon has depends on its frequency. A low-energy radio wave has a low frequency, while a high-energy X-ray at your dentist’s office is a high-frequency wave. Among the colors of visible light, violet-light photons have the highest energy and red-light photons have the lowest.
Test whether the connection between photons and waves is clear to you. In the above example, which photon would have the longer wavelength as a wave: the radio wave or the X-ray? If you answered the radio wave, you are correct. Radio waves have a lower frequency, so the wave cycles are longer
The Electromagnetic Spectrum
Objects in the universe send out an enormous range of radiation, or light. Scientists call this range the electromagnetic (EM) spectrum, which are divided into a number of regions. The spectrum is shown in Figure 4, with some information about the waves in each part or band.

Looking at the EM spectrum in Figure 4, we see that:
- Gamma rays have the highest energy and radio waves have the lowest energy
- Radio waves have the longest wavelength and gamma rays have the shortest wavelength
- Radio waves have the highest frequency and gamma rays have the lowest frequency
These properties of light are summarized by the beautifully simple equation that relates the energy of a photon to its frequency (or wavelength), where h is Planck's constant:
[latex]E=hf[/latex]
This relationship shows the wave-particle duality of light, as the energy of photon (a particle of light) is directly related to its frequency (a wave property). Since h has a constant value, you can immediately get the energy of a particular color of light simply by knowing its frequency (or wavelength, which can be expressed as [latex]\lambda = c / f[/latex]).
Another property of light that has already been mentioned but is worth re-emphasizing is that all types of light travel at the speed of light. Since the speed of light is constant, all light travels at the same speed.
Worked Example: Frequency and Wavelength
Red light has a wavelength of about 650 nm and blue light has a wavelength of about 450 nm. Recall that nm is the abbreviation for nanometers.
What is the frequency of red light?
The frequency of any type of light is related to its wavelength as [latex]f = c / \lambda[/latex], where c is the speed of light.
To use this equation, we must be sure that the units are all consistent. If we use 3×10⁸ m/s for the speed of light, then the wavelength must be in units of meters and the frequency will be in units of Hz (where 1 Hz = 1 cycle per second). So, we must first convert the wavelength from nanometers into meters. One nanometer is one-billionth of a meter: 1 nm = 10-9 m so it follows that 650 nm = 650×10-9 m. Expressed in scientific notation, the wavelength of red light is 6.50×10⁻⁷ m.
[latex]f = c / \lambda[/latex] = (3×10⁸ m/s) ⁄ (6.50×10⁻⁷ m) = 461,538,461,538,461 Hz
That's a huge number of cycles in one second! Expressing this in scientific notation, f = 4.62×10¹⁴ Hz.
The wavelength of visible light (like red and blue) is often reported in THz, where T is the prefix one trillion, or 1012.
Extra 1: Show that the frequency can also be expressed as 462 THz.
Show Answer
The frequency 4.62×10¹⁴ Hz can also be written as 4.62×102×1012 Hz
4.62×102 = 462 and 1012 Hz = 1 THZ, so f = 462 THz
Extra 2: Show that the frequency of blue light (with a wavelength of 450 nm) is 666 THz.
Show Answer
[latex]f = c / \lambda[/latex] = (3×10⁸ m/s) ⁄ (4.50×10⁻⁷ m) = 6.66×10¹⁴ Hz = 666 THz
Types of Electromagnetic Radiation
Throughout our study of astrobiology, we will encounter all types of light. When we collect light using a camera or sensor on the Earth's surface, that light must first travel through the Earth's atmosphere before it reaches the ground. Depending on the type of light, some of it may be partially or completely absorbed by molecules in different parts of the Earth's atmosphere. This means that some types of telescopes need to be above the Earth's atmosphere in order to detect any light. Also, we will see that this absorbed light will show up as a kind of set of Earth's chemical fingerprints in any observations that contain the Earth's atmosphere; this is the basic idea behind biosignatures for life, and we will probe it more deeply in the SETI chapters.
The way that light is absorbed in Earth's atmosphere for each part of the EM spectrum is shown in Figure 5.

We highlight a few properties of each type of light that are of relevance to astrobiology, as well as what types of telescopes are used to study the universe in each type of light.
Radio Waves
Radio waves have the longest wavelengths of any type of radiation -- they can range from a few millimeters all they way up to hundreds of kilometers (for reference, Switzerland is about 300 km across). Radio waves have very low energies and are all around us in our everyday lives. On Earth, cell phones, radio and TV transmissions, satellites and radar all emit radio waves and these pass right through our bodies. Radio waves are also produced in nature by a number of astrophysical objects, including stars and pulsars. The most abundant element in the cosmos -- hydrogen -- also naturally emits radio waves at a very specific wavelength of 21 cm (which corresponds to a frequency of 1420 MHz). As we will see later in the chapter on SETI, astronomers search for signals from advanced extraterrestrial civilizations that are close to the 21 cm radiation that hydrogen produces.

Most radio waves reach the ground, as seen by the "radio window" in Figure 5. The lowest frequency radio waves do not make it to the Earth's surface and this region of the EM spectrum remains unexplored. Because radio waves are long, in general the telescopes (in the case of radio astronomy, these are called dishes or antennae) need to be very large. Some of the first radio observations made to look for signs of intelligent life were carried out by Frank Drake in 1960 using the 85-foot Green Bank Telescope. There is another way to work around the large size needed for dishes through a technique called interferometry. Using this technique, a number of small radio dishes can be made to work in concert and achieve the same precision as a larger dish. The Hat Creek Radio Observatory in northern California, for example, has 28 dishes that are each 6 meters and can all point to the same target on the sky and collectively function as a 40 m dish.
Microwaves
Microwaves are also low energy radiation and have sizes that range from about 1 mm up to 300 mm. The most familiar source of microwaves on Earth is probably microwave ovens. Microwaves are used extensively by satellites to monitor weather on the Earth (Doppler radar maps use microwaves) and for remote sensing of the Earth's surface. The ancient radiation left over from the Big Bang also happens to fall into the microwave part of the EM spectrum. This Cosmic Microwave Background (CMB) radiation was discovered serendipitously in 1965 and has a wavelength of 1.9 mm. The CMB is literally everywhere on the sky and will appear as "background noise" in any observations that include this wavelength.
As seen in Figure 5, some microwave radiation makes it to the ground (the telescope used to detect the CMB in 1965 was on the ground in New Jersey, USA) but some parts are also absorbed by the Earth's atmosphere. The COBE, WMAP, and Planck missions all studied the CMB in more detail and were space-based missions.
Infrared
Infrared light is given off by anything with a temperature. This discovery was made in 1800 by the astronomer William Herschel. Herschel studied the rainbow created when white light was sent through a prism and he found that the invisible region beyond the red edge of the rainbow was hotter than the temperature of the rainbow! Herschel called this type of radiation "calorific rays", or heat rays, and today we refer to these heat rays as infrared (IR) light. Our eyes are only sensitive to visible light (some animals, such as vampire bats and goldfish, can see into the infrared), although we can still "see" this type of light by using an IR camera or night vision goggles. These types of sensors pick up differences in infrared intensity. Since most IR light gets absorbed by the Earth's atmosphere, many IR telescopes are in space.

IR light is of great importance in astronomy because it can penetrate, or travel through, dust that is opaque to visible light. This idea is best shown with a comparison of the same picture taken in visible light and infrared light. Figure 7 shows pictures of the Carina Nebula taken by the Hubble Space Telescope (HST) in visible light (left) and infrared light (right). You can see an enormous amount of stars and other objects in the infrared that are not seen in the visible, as infrared light travels right through the dust while visible light is absorbed by the dust.
The James Webb Space Telescope (JWST), which launched in 2021 and has a mirror 2.7 times larger than the HST (meaning it can collect over 7 times as much light), detects IR light. IR light covers the range of about 1-1000 micrometers, where micrometers are abbreviated as μm and are often referred to as microns; for reference, E. Coli bacteria are 2 microns and a human hair is 100 microns. JWST can sense wavelengths in the range of 0.6-28 microns. One of the main goals of JWST is to study planetary systems and the origin of life. One way JWST is doing this is by studying the atmospheres of exoplanets to see if any molecules needed for life, as we know it, are present. This will be discussed in more detail in the chapters on exoplanets.
Visible Light
Human eyes evolved to detect wavelengths spanning the visible part of the EM spectrum, which covers 400 nm to 750 nm. Stars emit visible light and life on Earth would not exist without the light from the Sun. Microscopes and optical telescopes both take visible light and focus it into an image -- the study of visible light is essential to astrobiology. For example, detailed pictures of the surface of Mars that show evidence for past liquid water are taken with visible cameras like Mastcam-Z on the Perseverance rover.
Visible light is not absorbed by the Earth's atmosphere but it does get distorted as it passes through, thus causing images to become blurry. Stars as viewed from the Earth's surface appear to twinkle for this reason. However, optical (visible) telescopes on the Earth's surface can use techniques such as adaptive optics to correct for the atmospheric distortion of visible light. The Hubble Space Telescope does not need to worry about this when it collects visible light.
Some searches for intelligent extraterrestrial life in the universe are carried out using optical telescopes; these searches typically scan the sky and look for anomalous pulses, perhaps from lasers being used by a distant civilization.
Ultraviolet
Ultraviolet (UV) light has a shorter wavelength than visible light and ranges from about 10-400 nm. Stars hotter than the Sun emit primarily UV light but the Sun emits some UV light, too. This is probably most apparent when you are outside on a sunny day and forgot to bring some sunblock -- your skin will absorb some of the UV (specifically, UVA) light. The fact that stars emit UV radiation is important for many aspects of life, in addition to protecting your skin. UV light can actually break the bonds between the hydrogen and oxygen atoms in a water molecule in a process called photolysis and this can create ozone in the atmosphere, which in turn protects life from dangerous radiation that can damage cells.
UV light is emitted from a range of astrophysical sources, including sites of star formation and planetary aurorae. As seen in Figure 5, nearly all UV radiation is absorbed by the Earth's atmosphere so UV telescopes are almost always in space, although some telescopes on high mountain tops, like the Keck telescopes atop Mauna Kea in Hawaii, have UV instruments. NASA's SWIFT satellite is actively studying the universe in UV light, and the Hubble Space Telescope has been probing a wide range of UV sources since 1990.
X Rays
X rays are a high energy type of radiation, with short wavelengths of just 0.01-10 nm, and they can be absorbed by tissue and bones in our bodies. They can destroy DNA so great care is taken when X ray machines are used to take medical images. Fortunately for life, X rays are absorbed by the Earth's atmosphere so they are not a concern on Earth's surface (but are a great concern for astronauts traveling above the Earth's atmosphere).
X rays are generated by high energy astrophysical phenomena such as supernova as well as the Sun's corona. During a total solar eclipse, the very hot gas in the Sun's corona can be seen. The composition of soil on Mars is studied using X ray instruments on Martian rovers, such as Spirit and Opportunity and the active Perseverance mission.
Gamma Rays
Gamma rays are the most energetic type of radiation in the cosmos and have wavelengths on the order of the size of the nucleus inside an atom. On Earth, gamma rays are produced naturally by lightning and radioactivity. Gamma rays are also created when two neutron stars merge, in addition to the gravitational waves that these events create. Gamma rays produced in neutron star mergers produce many of the heavy elements on the periodic table, such as gold and platinum.
Gamma rays do not make it to the Earth's surface so gamma ray observatories need to be in space. The Fermi Space Telescope has been studying gamma rays on the sky since 2008 and has created a complete map of the sky in gamma rays. The surface composition of a planet can be studied using gamma ray instruments -- the MESSENGER mission to Mercury carried a gamma ray spectrometer.
Multiple Wavebands
To fully understand an object, we ideally want to look at in every type of light that it emits. For many object, this can include all types of radiation, from radio waves to gamma ray. An example of this is shown in Figure 8 for the Crab Nebula:

Understanding Radiation
Some astronomical objects emit mostly infrared radiation, others mostly visible light, and still others mostly ultraviolet radiation. What determines the type of electromagnetic radiation emitted by the Sun, stars, and other dense astronomical objects? The answer often turns out to be their temperature.
At the microscopic level, everything in nature is in motion. A solid is composed of molecules and atoms in continuous vibration: they move back and forth in place, but their motion is much too small for our eyes to make out. A gas consists of atoms or molecules that are flying about freely at high speed, continually bumping into one another and bombarding the surrounding matter. The hotter the solid or gas, the faster the motion of its atoms or molecules. The temperature of something is thus a measure of the average motion energy of the particles that make it up.
This motion at the microscopic level is responsible for much of the EM radiation on Earth and in the universe. As atoms and molecules move about and collide, or vibrate in place, their electrons give off EM radiation. The characteristics of this radiation are determined by the temperature of those atoms and molecules. In a hot material, for example, the individual particles vibrate in place or move rapidly from collisions, so the emitted waves are, on average, more energetic. And recall that higher energy waves have a higher frequency. In cooler materials, the particles have lower energy atomic and molecular motions and thus generate lower energy waves.
Blackbody Radiation and Wien's Law
To further understand the relationship between temperature and light (EM radiation), we consider a type of ideal object called a blackbody. A blackbody absorbs all light that hits it; none of the incoming light is reflected away or passes through the object. The object heats up and gains energy; the object then loses this energy by emitting light at all wavelengths (recall that light is a type of energy). In other words, the object cools off until it reaches the same temperature as its surroundings -- this is called thermodynamic equilibrium -- and it does this by converting the energy it absorbed into energy of motion that is radiated in a specific way (this radiated energy is called thermal or blackbody radiation). A glowing ember of coal cools by radiating energy until it reaches the same temperature as its environment.
Any dense, solid object that has a temperature emits blackbody radiation; this includes people, animals, stove tops, light bulbs, stars and planets. For example, the Earth absorbs EM radiation from the Sun, heats up, and then emits radiation as mostly infrared light. Note that any objects that reflect light, such as a book with a red cover, are not blackbodies. Similarly, if light passes through the object, as with a glass table, it is also not a blackbody. In that respect, the Earth is not a perfect blackbody, since clouds and other particulate matter do reflect some sunlight.
No object in nature is a perfect blackbody but many opaque objects behave like a blackbody so it is a very good approximation and we can use some fairly simple math to learn more about the object. As mentioned above, blackbody radiation is not emitted at just one wavelength or one part of the EM spectrum, but covers all wavelengths. At first this may sound strange -- since humans act like blackbodies, does that mean that our bodies emit dangerous X rays and gamma rays? No, that is not the case (I don't have X ray eyes) and any blackbody emits the most intense radiation at one particular wavelength. Humans have a typical temperature of 98.6°F (or 310 K) and emit the most intense radiation at 9.3 microns (an infrared wavelength, meaning we radiate heat!). The peak wavelength of the radiation that a blackbody gives off depends only on its temperature. This means two very different objects with the same temperature emit identically with the same wavelength of peak intensity. The Earth is just a little bit cooler than a human at 288 K, and its most intense radiation is at 10.1 microns. This relationship between the temperature of a blackbody and its peak wavelength is called Wien's Law and is:
[latex]\lambda_{\rm max} = \frac{ 0.0029 }{T} \rm{~m ~K}[/latex]
where the wavelength is in meters and the temperature is in K (the constant 0.0029 has units of m × K). You can easily verify λmax for a human at 310 K: (0.0029 m K)/(310 K) = 9.3×10⁻⁶ m = 9.3 microns.
The thermal radiation emitted by any blackbody shows a similar shape in the intensity of light at different wavelengths. These shapes are called blackbody curves or thermal energy curves. Figure 9 shows this general shape for blackbody curves for objects of different temperatures. The shape is similar for all temperatures but notice that the intensity for each blackbody curve peaks at a different maximum wavelength.

Notice in Figure 9 that the curves show that, at each temperature, the blackbody objects emit radiation at all wavelengths (all colors) but that the most energy is emitted at a peak wavelength. Physically, this peak corresponds to the average speed of atoms or molecules inside the object, which is a manifestation of its temperature.
The hotter the object, the shorter the peak wavelength -- the object at 5500 K has a shorter λmax (530 nm) than the object at 2500 K (which has λmax of 1160 nm and is in the infrared portion of the EM spectrum). It makes sense, then, that hot objects give off a larger fraction of their energy at shorter wavelengths (higher energies) than do cool objects. You may have observed examples of this rule in everyday life. When a burner on an electric stove is turned on low, it emits only heat, which is infrared radiation, but does not glow with visible light. If the burner is set to a higher temperature, it starts to glow a dull red. At a still-higher setting, it glows a brighter orange-red (shorter wavelength). At even higher temperatures, which cannot be reached with ordinary stoves, metal can appear brilliant yellow or even blue-white.
We can use these ideas to come up with a thermometer for measuring the temperatures of stars. Because many stars give off most of their energy in visible light, the color of light that dominates a star’s appearance is an indicator of its temperature. If one star looks red and another looks blue, which one has the higher temperature? Because blue is the shorter-wavelength color, it is the sign of a hotter star. (Note that the temperatures we associate with different colors in science are not the same as the ones artists use. In art, red is often called a “hot” color and blue a “cool” color. Likewise, we commonly see red on faucet or air conditioning controls to indicate hot temperatures and blue to indicate cold temperatures. Although these are common uses to us in daily life, in nature, it’s the other way around.)
What about the Sun? The Sun has a surface temperature of 5800 K so Wien's law immediately tells us that λmax is 500 nm. Which corresponds to green light. But the Sun doesn't look green, it looks yellow or white! What's going on?! This makes sense when you consider that the Sun is also emitting red light and blue light; these all mix together as a nearly white color. Pure purple stars are also never seen for similar reasons -- the blue and violet mix into a more deep blue color.
C0lor Temperature
Different wavelengths (or frequencies) of light correspond to different colors. But what exactly is color? Is it a property of an object, like its size, or is it something that our brains perceive? Our eyes receive light, which is sent to the brain for processing. When we look at an object, we are seeing the light that is reflected off that object. If there is no light in the room, then we do not see anything at all. When light strikes an object, some of the light is reflected and some of it is absorbed. Human eyes have evolved to see visible light; some other animals, such as birds, can see ultraviolet light! Photoreceptors called cones in the retina of our eyes are sensitive to red, blue, and green light. In that sense, every color can be broken down into a combination of red, blue, and green. This is why television only needs those three colors to accurately simulate reality. In low light conditions, rods in the retina take over and are only sensitive to one color; hence, we see shades of gray.
The Sun emits white light, which contains all colors. As an example, let’s consider what happens when sunlight strikes a house painted red. The white light hits the red house, and only red light is reflected to our eyes; all of the other colors are absorbed by the paint molecules. Pigments are substances that selectively absorb very specific wavelengths of light, leaving only the desired wavelength of light reflected.
How does the color emitted by an object relate to its temperature? Wien’s law gives a mathematical relationship for this and shows that the temperature of a blackbody is inversely proportional to the wavelength of the light emitted. As a more visual example, consider a piece of metal being heated up. First it will turn a dull red color, then orange to white, and eventually it becomes blue when it is hottest. The scale is shown in Figure 10, where the temperatures are in Kelvin.

Light bulbs are designed with color temperature in mind. This is likely a familiar concept to photographers when selecting back lighting for a shoot. For a "candlelight" type background, a bulb of around 2000 K will be best, while a "natural daylight" background is best achieved with a bulb at 4500 K. Most fluorescent light bulbs in classrooms are around 5000 K while those in a library will be closer to 3000 K.
Luminosity and Brightness
Wien's Law shows that blackbodies, like stars, emit the most intense radiation at a specific wavelength, λmax. What exactly is this intensity a measure of?
Luminosity is the total amount of energy that an object (like a star) puts out each second. It has dimensional units of energy per second. In the same way that a 100 W bulb will always put out 100 Watts whether we are standing close or farther away, the luminosity of a star does not depend on our distance from it.
However, astronomers do not measure luminosity directly with a telescope; they measure brightness: the luminosity that is intercepted by a detector such as a photographic plate or a digital camera. If you imagine a spherical surface - a bubble - around a star, then the luminosity is the integrated (total) light from the surface of that bubble. The brightness, which is the luminosity per unit area, decreases as the surface area of the spherical volume increases. This is the same phenomenon that happens with expanding balloons. The balloon has a certain amount of material, usually latex or rubber. Analogous to luminosity, that amount of material is constant, no matter how much air is in the balloon. However, as the balloon expands, that constant amount of material is stretched over a larger surface area. The walls of the balloon get thinner and the amount of material per unit area decreases. The luminosity of a star is constant. The brightness that we measure depends on whether we are "up close" or far away from the star.
This is shown in Figure 11, where the light from a star with luminosity L spreads out into spheres of increasing surface area as it travels away from the star. At a distance d from the star, we can measure the brightness ($B$) by dividing the total power emitted by the star (L) by the surface area of the sphere that the light has now spread into:
[latex]$B = \frac{L}{4 \pi d^2}$[/latex]
This idea—that the apparent brightness of a source (how bright it looks to us) gets weaker with distance in the way we have described—is shown in Figure 11 below. At point 1, the light is concentrated into one box. By the time the light reaches point 2, which is twice as far as point 1, it is now spread out into four squares.
Concept Check: Brightness and distances of stars
You observe two stars, named Sol-2 and Sol-3, that have the exact same luminosity as the Sun (this means they have the same temperature, radius, and luminosity as the Sun). You measure the brightness of both stars with the same instrument and find that the light from Sol-2 is twenty-five times brighter than the light from Sol-3. Which star is closer to the Earth and by how much? Explain your reasoning.
Show Answer
Ans: Sol-2 is five times closer than Sol-3. Brightness drops as the distance squared, so the ratio of the distances to Sol-2 and Sol-3 is given by [latex]\sqrt{B_{Sol2}/B_{Sol3}}[/latex] or [latex]\sqrt{25}[/latex] = 5.
Let's consider the luminosity of the Sun and the amount of energy from the Sun that reaches the Earth. This will be important to know when we study exoplanets and want to know how much light from the host star reaches the exoplanet. The luminosity of the Sun is 3.9×1026 W -- in other words, it emits the same amount of power as 3.9×1024 100 W light bulbs (or 39 trillion trillion 100 W bulbs!). As the light travels away from the Sun, it is spread out more and more, as all of that light needs to cover spheres (bubbles) that have greater surface area. The distance from the Earth to the Sun is 151 million km, or 1.51×10¹¹ m. Putting this value into the brightness equation, we find that we receive 1360 W/m2 of sunlight on the Earth. That means every 1 m2 patch on the Earth, which is about the size of a standard chess board, receives 1360 Joules of energy every second. Venus is closer to the Sun than the Earth and receives more energy for every square meter, 2600 W/m2, while Mars is further and receives only 600 W/m2.
Worked Example: Calculating the energy received from the Sun
How much radiation from the Sun is received at Saturn's moon Titan? You can assume that Titan and Saturn are at the same distance from Earth.
We can find the value by using the relationship for brightness, luminosity and distance:
[latex]$B = \frac{L}{4 \pi d^2}$[/latex]
Here, L is the luminosity of the Sun and d is the distance of Titan from the Sun. The distance from the Sun to Titan (Saturn) is 1.45 billion km (or 1.45×10¹² m).
B = (3.9×1026 W)/(4 π (1.45×10¹² m)2) = 14.8 W/m2
This makes sense -- Saturn is almost 10 times further from the Sun than the Earth (Earth is 1 AU and Saturn is 9.57 AU), so the value should be significantly lower than Earth's. [In fact, you could also find this value by taking the ratio (1/9.57)2 and multiplying by 1360 W/m2]
Show mathematically that the Earth receives 1360 W/m2 from the Sun.
Show Answer
The only difference here is the distance: now it is the distance from the Earth to the Sun, which is 151 million km.
B = (3.9×1026 W)/(4 π (1.51×10¹¹ m)2) = 1361 W/m2
Spectroscopy
Light from objects is filled with information. By taking the light from an object and splitting it apart into a spectrum, we can decode this light. Spectroscopy is a fundamental tool for astrobiology and allows us to detect exoplanets and study the chemical makeup of their atmospheres.
The most familiar example of spectroscopy is the rainbow of colors that is produced when white light is sent through a prism, as seen in Figure 1. A water droplet can also split up (or disperse) light and create a rainbow when a light beam passes through it. Both prisms and water droplets can serve as spectrometers or spectrographs -- tools used to disperse light into a spectrum.

Stars emit all types of electromagnetic radiation but emit the most intense light at a specific wavelength (see Wien's Law). Note that infrared and ultraviolet light are also emitted by the Sun and are split out as seen in Figure 1 -- our eyes just can't perceive these types of radiation. The distribution of colors, which is naturally organized by wavelength (or frequency), is called a spectrum. There are three main types of spectra: continuous, absorption, and emission as shown in Figure 2. If the shape of the spectrum on the bottom left of Figure 2 looks familiar, it is because you have seen it before when learning about blackbody (thermal) radiation curves.

A continuous spectrum looks like the rainbow shown in Figure 1. However, sunlight that reaches the Earth actually is an absorption spectrum, not a continuous spectrum. Why? The Sun does emit a continuous spectrum from its core but some of that light is absorbed by different atoms as it passes through the Sun's atmosphere. This is shown in Figure 2. On the left, the Sun emits a continuous spectrum at its surface. But that light passes through the atmosphere (the cloud of gas in the middle) and some of that light is absorbed by atoms in the gas. The spectrum on the right is the type of spectrum seen for the Sun, where the dark lines correspond to the wavelengths associated with the atoms or molecules that absorbed the light. Figure 3 shows an absorption spectrum for the Sun, with some of the atoms and molecules present in the Sun's atmosphere labeled. This spectrum was taken from the Earth's surface, so the O2 (molecular oxygen) lines are from Earth's atmosphere.

What does it mean to say "the wavelengths associated with the atoms"? Every element on the periodic table has a different number of protons and thus a different structure. Hydrogen is the simplest atom, with just one proton and one electron orbiting the proton in a neutral atom. To get the electron out of the hydrogen atom entirely requires a certain amount of energy. If there is no energy supplied to the atom, it is stable and the electron is in what we call the ground state of energy. However, the electron can move to different energy levels above the ground state -- imagine rungs on a ladder, with the ground state at the bottom and the top rung being the amount of energy needed to kick the electron out of the atom. Hydrogen has a unique set of energy levels and each level has an exact amount of energy. And recall that this energy has an exact frequency or wavelength given by [latex]E=hf = h c/\lambda[/latex]. When light particles (photons) with exactly one of those wavelengths encounters the atom, it is absorbed. And every element has a different set of energy levels, meaning a distinct set of its own characteristic wavelengths. We thus have a very powerful way of learning which elements are inside a star's atmosphere.
Using the unique pattern of an element to identify whether it is inside of an atmosphere is similar to DNA barcoding used in forensics to identify a match to evidence at a crime scene. Figure 4 shows an example of some of the colors (wavelengths) for a few different elements. No two are the same and we can use these patterns to identify an element in a star or planet's atmosphere. This same technique is used extensively in biochemistry and many other scientific fields. We can think of the unique emission lines associated with an atom or molecule as its chemical fingerprint.

The middle part of Figure 2 shows the physical idea of how an emission spectrum is created. Let's say you have a gas made from atoms of just one type of element. If you heat up that gas, the electrons can move up to higher energy levels and then drop back down, emitting light in the process. This is almost the same situation as the absorption spectrum on the left except we are not looking at the continuous source and the gas but instead just at the gas...so there is no continuous spectrum in the background, just the bright lines that correspond to whatever element is in the gas. The atom is emitting energy at the unique set of wavelengths (colors) for that particular element. Of course, the gas can contain many different atoms and molecules at the same time.
You can take a look at the fingerprints for some other elements using the simulation below. Click on any element to see its unique set of spectral lines. Notice that you can choose to see both absorption (top) and emission (bottom) spectra.
Key Concepts and Summary
The energy of light is our messenger about the universe. Different colors of light are simply different wavelengths and different wavelengths of light contain different amounts of energy. The longest wavelengths in the electromagnetic spectrum are radio waves and these have the lowest energy. The shortest wavelengths are high energy gamma rays. Unsurprisingly, the visible band of light (where our brain interprets different wavelengths as different colors) matches the key energy output of the Sun - we evolved to optimally navigate this range of energies. By observing the universe with detectors that are sensitive to different energies of light, we can learn about the energy output and the peak temperatures of the objects we detect. Because the brightness of a star or other celestial object decreases with distance, a measurement of distance is needed to back out luminosity (energy per second). The wavelengths of light encode the energy and chemical composition of stars and other celestial bodies - astronomers use spectrographs to disperse light collected at a telescope into a spectrum. Objects emit a continuous (sometimes called "blackbody") spectrum with an intensity distribution that depends on temperature. When atomic transitions take place in cooler outer layers of stars, the spectrum can also have absorption or emission lines. Absorption lines occur when atoms absorb photons of light pushing electrons to a higher energy state. Emission lines occur when atoms release photons and the electrons cascade to a lower energy state.
Review Questions
Summary Questions
- What is energy? Describe two different kinds of energy and give examples of each.
- What does it mean to say the energy is "conserved"?
- How are the frequency and wavelength of light related to each other?
- What is a photon?
- Which property of light determine how much energy a photon has?
- What are the seven main parts of the electromagnetic spectrum? For each band (part), give an example of a source of that type of radiation.
- How does the type of light emitted by an object depend on its temperature?
- What is the difference between the brightness of an object (such as a star) and its luminosity?
- How does the total amount of energy emitted differ for hot and cold objects?
- How does spectroscopy give information about an object? What happens when starlight passes through a prism?
- What are the differences between continuous, absorption and emission spectra? What are the similarities between all three?
- Why are the spectral lines for an element sometimes called “chemical fingerprints”?
Activities
- Understanding blackbody radiation. Open the simulation at https://phet.colorado.edu/sims/html/blackbody-spectrum/latest/blackbody-spectrum_en.html.
- The default is set to the temperature of the Sun. Click on the "labels" box to show different parts of the EM spectrum (UV, visible, and infrared). What part of the EM spectrum has the most intense light from the Sun.
- Now set the thermometer to the temperature of the star Sirius. The y-axis now needs to be rescaled to see the value for the peak intensity, Adjust this by using the zoom out button. Once you can see the peak, click on the "Graph Values" box. What is the wavelength of the peak intensity light for Sirius?
- Energy flux. Calculate the solar flux (in W/m2) at the planet Mercury.
Life needs a source of energy to thrive. This energy can come in different forms, from sunlight to energy released when chemicals react. Light is a type of pure energy, and coded into the light and other kinds of radiation that reach us from objects in the universe is a wide range of information about what those objects are like and how they work. If we can decipher this code and read the messages it contains, we can learn an enormous amount about the cosmos without ever having to leave Earth or its immediate environment.
Learning Objectives
By the end of this chapter, you will be able to:
- Understand that there are different types of energy and that energy is conserved
- Explain the wavelength, frequency and energy of a wave or particle of light
- Discuss the different parts of the electromagnetic spectrum
- Explain how and why the light emitted by an object depends on its temperature
- Explain the difference between the luminosity and brightness of an object
- Explain how the total energy emitted differs for hot and cold objects
- Describe how spectroscopy can provide information about an object, such as a star.
- Discuss the difference between continuous, absorption and emission spectra.
Energy
Different types of energy are all around us -- the electrical energy that powers our technology, the chemical energy that is stored in the food we eat, and the heat energy we feel when when walking in sunlight. These different types of energy can be changed, or converted, from one type to another. For example, the chemical energy in food is converted to energy that allows us to think and move around. We will see other examples of energy transformations in astrobiology, such as the gravitational energy that is converted into heat when a giant cloud of gas and dust collapses and eventually forms stars.
The amount of the energy in the universe is always the same and it is continuously being changed from one form into another. This is the essence of the law of conservation of energy. Other quantities in nature, such as mass and momentum, are also conserved.
Though energy cannot be created or destroyed, it can be transformed into different forms. The two main forms of energy are kinetic energy and potential energy. Kinetic energy is the energy of motion. When an object is moving more quickly, it has more energy. A fast-moving car has more energy than a slow moving car. Thermal energy is actually a form of kinetic energy since higher temperature is really a measure of the average speed of atoms and molecules -- the higher the temperature, the greater the kinetic energy of the atoms and molecules.
Potential energy is the energy that is associated with different positions in space. When you throw a ball high into the air, it has more gravitational potential energy than when it is held in your hand. When an object moves from an area of high potential energy to low potential energy, that energy will be transformed into another form. For example, when an apple falls to the Earth, it will speed up gaining kinetic energy. But potential energy does not need to be related just to gravity. For example, the energy stored in chemicals is in the form of chemical potential energy which can be determined based on the position of different atoms bonded to each other by electric forces of attraction.
A more recently discovered form of energy is the energy associated with mass itself. Einstein's famous equation [latex]E=mc^2[/latex] tells us, that mass-energy equivalence is a fundamental feature of the universe. Any object that has mass therefore also contains energy -- this type of energy is called rest-mass energy. Inside the core of stars, nuclear fusion converts some of the rest-mass of two protons into energy. This process occurs an astounding 1038 times every second and is the source of the energy from the Sun that we receive on Earth.
Light
A great deal of the energy that life on Earth uses comes in one way or another from the Sun's light, although geothermal energy from inside the Earth can also be harnessed. Light from the Sun, or any star, is an example of electromagnetic radiation. Here, the words light and radiation are synonymous, and both are a form of energy. Radiation can sometimes be thought of as dangerous and some types are (for example, gamma rays and X rays), but radiation is a neutral term and is synonymous with energy.
One of the more bizarre aspects of light is the way that it acts, specifically the fact that it can behave like a wave and a particle. In the 17th century, the nature of light was debated and both Isaac Newton and Christiaan Huygens tried to explain it. Newton experimented with lenses and prisms and believed that light was a stream of particles, which he called corpuscles. Huygens, on the other hand, believed that light was a wave that traveled outward in all directions from a source, much like the ripples on a pond that expand outward through the water after a stone is dropped into it. Building upon pioneering work by James Clerk Maxwell and Max Planck, Albert Einstein proposed in 1905 that light can indeed behave both ways, thus solidifying the concept of wave-particle duality, one of the tenets of quantum mechanics. The wave and particle nature of light has now been experimentally verified countless times.
Light as a Wave
Light carries energy and information from one place to another, and this energy is carried in the form of electromagnetic (EM) waves. Other familiar types of waves in nature include sound waves and water waves. All three of these types of waves have some differences and some similarities.
Water and sound waves are mechanical waves and require a medium to travel in. For sound waves, the medium is air and the medium is water for water waves. If you screamed on the surface of the Moon, which has no atmosphere, nobody would hear you as the sound waves have no medium to travel through. (The director Stanley Kubrick got it right in the film 2001: A Space Odyssey.) EM waves do not require water or air or any medium to travel though – they can travel through empty space. This was such a disturbing idea to nineteenth-century scientists that they actually made up a substance to fill all of space—one for which there was no evidence—just so light waves could have something to travel through: they called it the aether. Today, we know that there is no aether and that EM waves have no trouble at all moving through empty space (as all the starlight visible on a clear night must surely be doing).
The speed of a sound wave depends on the medium through which it is traveling. A sound wave moves faster through water than it does through air, for example. However, all electromagnetic waves move at the same speed in empty space (the speed of light—approximately 300,000 kilometers per second, or 300,000,000 meters per second, which can also be written as 3×10⁸ m/s), which turns out to be the fastest possible speed in the universe.
Now for some similarities. All waves are a kind of repeating phenomenon. Whether it is the up-and-down motion of a water wave or the changing electric and magnetic fields in a wave of light, the pattern of disturbance repeats in a cyclical way. Thus, any wave motion can be characterized by a series of crests and troughs. Moving from one crest through a trough to the next crest completes one cycle. The horizontal length covered by one cycle is called the wavelength (λ). Ocean waves provide an analogy: the wavelength is the distance that separates successive wave crests. An example of water waves created when a frog leaps into a pond is shown in Figure 1.
We can also characterize different waves by their frequency, which is the number of wave cycles that pass by per second. If you count 10 crests moving by each second, for example, then the frequency is 10 cycles per second (cps). In honor of Heinrich Hertz, the late nineteenth physicist who, inspired by physicist James Clerk Maxwell’s work, discovered radio waves, a cps is also called a hertz (Hz). Take a look at your radio, for example, and you will see the channel assigned to each radio station is characterized by its frequency, usually in units of kHz (kilohertz, or thousands of hertz) or MHz (megahertz, or millions of hertz).
Concept Check: Wavelength and Frequency
Figure 3 is a schematic showing the wavelengths and frequencies for different colors of light. Red light is at the top and its wavelength (λ) is shown as the distance between two peaks, where the peaks are marked by the vertical black lines. Blue light is on the bottom; notice that it has a shorter wavelength than red light (the length between the two peaks is noticeably shorter).
The frequency of a wave is a measure of how many waves pass by in one second. Let's imagine that the amount of time that elapsed for each of the waves in Figure 3 is 1 second. Looking at red light, two full waves can pass by in this 1 second period, so we say the frequency is 2 cycles per second, or 2 Hz. (Actually, a bit more than two red light wave cycles can pass by, about 2.5, but we will say 2 full waves to keep this example simple.)
- Which color of light has the highest frequency? How about the lowest frequency?
- Which color of light has the shortest wavelength?
Show Answer
- Looking at Figure 3, the most crests pass by in one second for blue light (6 Hz) while the fewest pass by for red light. Thus, blue light has the highest frequency and red light has the lowest.
- Since blue light has the highest frequency, it also has the shortest wavelength. It is easy to see in Figure 3 that λ is shortest for blue light.
Wavelength (λ) and frequency (f) are related because all electromagnetic waves travel at the same speed. The formula for this relationship can be expressed as follows: for any wave motion, the speed at which a wave moves equals the frequency times the wavelength. Waves with longer wavelengths have lower frequencies. Mathematically, we can express this as
$$ c = \lambda f $$
where the Greek letter for “l”—lambda, λ—is used to denote wavelength and c is the scientific symbol for the speed of light.
The electromagnetic wave model of light (as formulated by James Clerk Maxwell) was one of the great triumphs of nineteenth-century science. In 1887, when Heinrich Hertz actually made invisible electromagnetic waves (what today are called radio waves) on one side of a room and detected them on the other side, it ushered in a new era that led to the modern age of telecommunications. His experiment ultimately led to the technologies of television, cell phones, and today’s wireless networks around the globe.
Light as a Photon
By the beginning of the twentieth century, physicists had to reluctantly accept that sometimes light behaves more like a “particle”—or at least a self-contained packet of energy—than a wave. We call such a packet of electromagnetic energy a photon.
A photon carries a specific amount of energy. How much energy a photon has depends on its frequency. We can use the idea of energy to connect the photon and wave models. How much energy a photon has depends on its frequency. A low-energy radio wave has a low frequency, while a high-energy X-ray at your dentist’s office is a high-frequency wave. Among the colors of visible light, violet-light photons have the highest energy and red-light photons have the lowest.
Test whether the connection between photons and waves is clear to you. In the above example, which photon would have the longer wavelength as a wave: the radio wave or the X-ray? If you answered the radio wave, you are correct. Radio waves have a lower frequency, so the wave cycles are longer
The Electromagnetic Spectrum
Objects in the universe send out an enormous range of radiation, or light. Scientists call this range the electromagnetic (EM) spectrum, which are divided into a number of regions. The spectrum is shown in Figure 4, with some information about the waves in each part or band.
Looking at the EM spectrum in Figure 4, we see that:
- Gamma rays have the highest energy and radio waves have the lowest energy
- Radio waves have the longest wavelength and gamma rays have the shortest wavelength
- Radio waves have the highest frequency and gamma rays have the lowest frequency
These properties of light are summarized by the beautifully simple equation that relates the energy of a photon to its frequency (or wavelength), where h is Planck's constant:
[latex]E=hf[/latex]
This relationship shows the wave-particle duality of light, as the energy of photon (a particle of light) is directly related to its frequency (a wave property). Since h has a constant value, you can immediately get the energy of a particular color of light simply by knowing its frequency (or wavelength, which can be expressed as [latex]\lambda = c / f[/latex]).
Another property of light that has already been mentioned but is worth re-emphasizing is that all types of light travel at the speed of light. Since the speed of light is constant, all light travels at the same speed.
Worked Example: Frequency and Wavelength
Red light has a wavelength of about 650 nm and blue light has a wavelength of about 450 nm. Recall that nm is the abbreviation for nanometers.
What is the frequency of red light?
The frequency of any type of light is related to its wavelength as [latex]f = c / \lambda[/latex], where c is the speed of light.
To use this equation, we must be sure that the units are all consistent. If we use 3×10⁸ m/s for the speed of light, then the wavelength must be in units of meters and the frequency will be in units of Hz (where 1 Hz = 1 cycle per second). So, we must first convert the wavelength from nanometers into meters. One nanometer is one-billionth of a meter: 1 nm = 10-9 m so it follows that 650 nm = 650×10-9 m. Expressed in scientific notation, the wavelength of red light is 6.50×10⁻⁷ m.
[latex]f = c / \lambda[/latex] = (3×10⁸ m/s) ⁄ (6.50×10⁻⁷ m) = 461,538,461,538,461 Hz
That's a huge number of cycles in one second! Expressing this in scientific notation, f = 4.62×10¹⁴ Hz.
The wavelength of visible light (like red and blue) is often reported in THz, where T is the prefix one trillion, or 1012.
Extra 1: Show that the frequency can also be expressed as 462 THz.
Show Answer
The frequency 4.62×10¹⁴ Hz can also be written as 4.62×102×1012 Hz
4.62×102 = 462 and 1012 Hz = 1 THZ, so f = 462 THz
Extra 2: Show that the frequency of blue light (with a wavelength of 450 nm) is 666 THz.
Show Answer
[latex]f = c / \lambda[/latex] = (3×10⁸ m/s) ⁄ (4.50×10⁻⁷ m) = 6.66×10¹⁴ Hz = 666 THz
Types of Electromagnetic Radiation
Throughout our study of astrobiology, we will encounter all types of light. When we collect light using a camera or sensor on the Earth's surface, that light must first travel through the Earth's atmosphere before it reaches the ground. Depending on the type of light, some of it may be partially or completely absorbed by molecules in different parts of the Earth's atmosphere. This means that some types of telescopes need to be above the Earth's atmosphere in order to detect any light. Also, we will see that this absorbed light will show up as a kind of set of Earth's chemical fingerprints in any observations that contain the Earth's atmosphere; this is the basic idea behind biosignatures for life, and we will probe it more deeply in the SETI chapters.
The way that light is absorbed in Earth's atmosphere for each part of the EM spectrum is shown in Figure 5.
We highlight a few properties of each type of light that are of relevance to astrobiology, as well as what types of telescopes are used to study the universe in each type of light.
Radio Waves
Radio waves have the longest wavelengths of any type of radiation -- they can range from a few millimeters all they way up to hundreds of kilometers (for reference, Switzerland is about 300 km across). Radio waves have very low energies and are all around us in our everyday lives. On Earth, cell phones, radio and TV transmissions, satellites and radar all emit radio waves and these pass right through our bodies. Radio waves are also produced in nature by a number of astrophysical objects, including stars and pulsars. The most abundant element in the cosmos -- hydrogen -- also naturally emits radio waves at a very specific wavelength of 21 cm (which corresponds to a frequency of 1420 MHz). As we will see later in the chapter on SETI, astronomers search for signals from advanced extraterrestrial civilizations that are close to the 21 cm radiation that hydrogen produces.
Most radio waves reach the ground, as seen by the "radio window" in Figure 5. The lowest frequency radio waves do not make it to the Earth's surface and this region of the EM spectrum remains unexplored. Because radio waves are long, in general the telescopes (in the case of radio astronomy, these are called dishes or antennae) need to be very large. Some of the first radio observations made to look for signs of intelligent life were carried out by Frank Drake in 1960 using the 85-foot Green Bank Telescope. There is another way to work around the large size needed for dishes through a technique called interferometry. Using this technique, a number of small radio dishes can be made to work in concert and achieve the same precision as a larger dish. The Hat Creek Radio Observatory in northern California, for example, has 28 dishes that are each 6 meters and can all point to the same target on the sky and collectively function as a 40 m dish.
Microwaves
Microwaves are also low energy radiation and have sizes that range from about 1 mm up to 300 mm. The most familiar source of microwaves on Earth is probably microwave ovens. Microwaves are used extensively by satellites to monitor weather on the Earth (Doppler radar maps use microwaves) and for remote sensing of the Earth's surface. The ancient radiation left over from the Big Bang also happens to fall into the microwave part of the EM spectrum. This Cosmic Microwave Background (CMB) radiation was discovered serendipitously in 1965 and has a wavelength of 1.9 mm. The CMB is literally everywhere on the sky and will appear as "background noise" in any observations that include this wavelength.
As seen in Figure 5, some microwave radiation makes it to the ground (the telescope used to detect the CMB in 1965 was on the ground in New Jersey, USA) but some parts are also absorbed by the Earth's atmosphere. The COBE, WMAP, and Planck missions all studied the CMB in more detail and were space-based missions.
Infrared
Infrared light is given off by anything with a temperature. This discovery was made in 1800 by the astronomer William Herschel. Herschel studied the rainbow created when white light was sent through a prism and he found that the invisible region beyond the red edge of the rainbow was hotter than the temperature of the rainbow! Herschel called this type of radiation "calorific rays", or heat rays, and today we refer to these heat rays as infrared (IR) light. Our eyes are only sensitive to visible light (some animals, such as vampire bats and goldfish, can see into the infrared), although we can still "see" this type of light by using an IR camera or night vision goggles. These types of sensors pick up differences in infrared intensity. Since most IR light gets absorbed by the Earth's atmosphere, many IR telescopes are in space.
IR light is of great importance in astronomy because it can penetrate, or travel through, dust that is opaque to visible light. This idea is best shown with a comparison of the same picture taken in visible light and infrared light. Figure 7 shows pictures of the Carina Nebula taken by the Hubble Space Telescope (HST) in visible light (left) and infrared light (right). You can see an enormous amount of stars and other objects in the infrared that are not seen in the visible, as infrared light travels right through the dust while visible light is absorbed by the dust.
The James Webb Space Telescope (JWST), which launched in 2021 and has a mirror 2.7 times larger than the HST (meaning it can collect over 7 times as much light), detects IR light. IR light covers the range of about 1-1000 micrometers, where micrometers are abbreviated as μm and are often referred to as microns; for reference, E. Coli bacteria are 2 microns and a human hair is 100 microns. JWST can sense wavelengths in the range of 0.6-28 microns. One of the main goals of JWST is to study planetary systems and the origin of life. One way JWST is doing this is by studying the atmospheres of exoplanets to see if any molecules needed for life, as we know it, are present. This will be discussed in more detail in the chapters on exoplanets.
Visible Light
Human eyes evolved to detect wavelengths spanning the visible part of the EM spectrum, which covers 400 nm to 750 nm. Stars emit visible light and life on Earth would not exist without the light from the Sun. Microscopes and optical telescopes both take visible light and focus it into an image -- the study of visible light is essential to astrobiology. For example, detailed pictures of the surface of Mars that show evidence for past liquid water are taken with visible cameras like Mastcam-Z on the Perseverance rover.
Visible light is not absorbed by the Earth's atmosphere but it does get distorted as it passes through, thus causing images to become blurry. Stars as viewed from the Earth's surface appear to twinkle for this reason. However, optical (visible) telescopes on the Earth's surface can use techniques such as adaptive optics to correct for the atmospheric distortion of visible light. The Hubble Space Telescope does not need to worry about this when it collects visible light.
Some searches for intelligent extraterrestrial life in the universe are carried out using optical telescopes; these searches typically scan the sky and look for anomalous pulses, perhaps from lasers being used by a distant civilization.
Ultraviolet
Ultraviolet (UV) light has a shorter wavelength than visible light and ranges from about 10-400 nm. Stars hotter than the Sun emit primarily UV light but the Sun emits some UV light, too. This is probably most apparent when you are outside on a sunny day and forgot to bring some sunblock -- your skin will absorb some of the UV (specifically, UVA) light. The fact that stars emit UV radiation is important for many aspects of life, in addition to protecting your skin. UV light can actually break the bonds between the hydrogen and oxygen atoms in a water molecule in a process called photolysis and this can create ozone in the atmosphere, which in turn protects life from dangerous radiation that can damage cells.
UV light is emitted from a range of astrophysical sources, including sites of star formation and planetary aurorae. As seen in Figure 5, nearly all UV radiation is absorbed by the Earth's atmosphere so UV telescopes are almost always in space, although some telescopes on high mountain tops, like the Keck telescopes atop Mauna Kea in Hawaii, have UV instruments. NASA's SWIFT satellite is actively studying the universe in UV light, and the Hubble Space Telescope has been probing a wide range of UV sources since 1990.
X Rays
X rays are a high energy type of radiation, with short wavelengths of just 0.01-10 nm, and they can be absorbed by tissue and bones in our bodies. They can destroy DNA so great care is taken when X ray machines are used to take medical images. Fortunately for life, X rays are absorbed by the Earth's atmosphere so they are not a concern on Earth's surface (but are a great concern for astronauts traveling above the Earth's atmosphere).
X rays are generated by high energy astrophysical phenomena such as supernova as well as the Sun's corona. During a total solar eclipse, the very hot gas in the Sun's corona can be seen. The composition of soil on Mars is studied using X ray instruments on Martian rovers, such as Spirit and Opportunity and the active Perseverance mission.
Gamma Rays
Gamma rays are the most energetic type of radiation in the cosmos and have wavelengths on the order of the size of the nucleus inside an atom. On Earth, gamma rays are produced naturally by lightning and radioactivity. Gamma rays are also created when two neutron stars merge, in addition to the gravitational waves that these events create. Gamma rays produced in neutron star mergers produce many of the heavy elements on the periodic table, such as gold and platinum.
Gamma rays do not make it to the Earth's surface so gamma ray observatories need to be in space. The Fermi Space Telescope has been studying gamma rays on the sky since 2008 and has created a complete map of the sky in gamma rays. The surface composition of a planet can be studied using gamma ray instruments -- the MESSENGER mission to Mercury carried a gamma ray spectrometer.
Multiple Wavebands
To fully understand an object, we ideally want to look at in every type of light that it emits. For many object, this can include all types of radiation, from radio waves to gamma ray. An example of this is shown in Figure 8 for the Crab Nebula:
Understanding Radiation
Some astronomical objects emit mostly infrared radiation, others mostly visible light, and still others mostly ultraviolet radiation. What determines the type of electromagnetic radiation emitted by the Sun, stars, and other dense astronomical objects? The answer often turns out to be their temperature.
At the microscopic level, everything in nature is in motion. A solid is composed of molecules and atoms in continuous vibration: they move back and forth in place, but their motion is much too small for our eyes to make out. A gas consists of atoms or molecules that are flying about freely at high speed, continually bumping into one another and bombarding the surrounding matter. The hotter the solid or gas, the faster the motion of its atoms or molecules. The temperature of something is thus a measure of the average motion energy of the particles that make it up.
This motion at the microscopic level is responsible for much of the EM radiation on Earth and in the universe. As atoms and molecules move about and collide, or vibrate in place, their electrons give off EM radiation. The characteristics of this radiation are determined by the temperature of those atoms and molecules. In a hot material, for example, the individual particles vibrate in place or move rapidly from collisions, so the emitted waves are, on average, more energetic. And recall that higher energy waves have a higher frequency. In cooler materials, the particles have lower energy atomic and molecular motions and thus generate lower energy waves.
Blackbody Radiation and Wien's Law
To further understand the relationship between temperature and light (EM radiation), we consider a type of ideal object called a blackbody. A blackbody absorbs all light that hits it; none of the incoming light is reflected away or passes through the object. The object heats up and gains energy; the object then loses this energy by emitting light at all wavelengths (recall that light is a type of energy). In other words, the object cools off until it reaches the same temperature as its surroundings -- this is called thermodynamic equilibrium -- and it does this by converting the energy it absorbed into energy of motion that is radiated in a specific way (this radiated energy is called thermal or blackbody radiation). A glowing ember of coal cools by radiating energy until it reaches the same temperature as its environment.
Any dense, solid object that has a temperature emits blackbody radiation; this includes people, animals, stove tops, light bulbs, stars and planets. For example, the Earth absorbs EM radiation from the Sun, heats up, and then emits radiation as mostly infrared light. Note that any objects that reflect light, such as a book with a red cover, are not blackbodies. Similarly, if light passes through the object, as with a glass table, it is also not a blackbody. In that respect, the Earth is not a perfect blackbody, since clouds and other particulate matter do reflect some sunlight.
No object in nature is a perfect blackbody but many opaque objects behave like a blackbody so it is a very good approximation and we can use some fairly simple math to learn more about the object. As mentioned above, blackbody radiation is not emitted at just one wavelength or one part of the EM spectrum, but covers all wavelengths. At first this may sound strange -- since humans act like blackbodies, does that mean that our bodies emit dangerous X rays and gamma rays? No, that is not the case (I don't have X ray eyes) and any blackbody emits the most intense radiation at one particular wavelength. Humans have a typical temperature of 98.6°F (or 310 K) and emit the most intense radiation at 9.3 microns (an infrared wavelength, meaning we radiate heat!). The peak wavelength of the radiation that a blackbody gives off depends only on its temperature. This means two very different objects with the same temperature emit identically with the same wavelength of peak intensity. The Earth is just a little bit cooler than a human at 288 K, and its most intense radiation is at 10.1 microns. This relationship between the temperature of a blackbody and its peak wavelength is called Wien's Law and is:
[latex]\lambda_{\rm max} = \frac{ 0.0029 }{T} \rm{~m ~K}[/latex]
where the wavelength is in meters and the temperature is in K (the constant 0.0029 has units of m × K). You can easily verify λmax for a human at 310 K: (0.0029 m K)/(310 K) = 9.3×10⁻⁶ m = 9.3 microns.
The thermal radiation emitted by any blackbody shows a similar shape in the intensity of light at different wavelengths. These shapes are called blackbody curves or thermal energy curves. Figure 9 shows this general shape for blackbody curves for objects of different temperatures. The shape is similar for all temperatures but notice that the intensity for each blackbody curve peaks at a different maximum wavelength.
Notice in Figure 9 that the curves show that, at each temperature, the blackbody objects emit radiation at all wavelengths (all colors) but that the most energy is emitted at a peak wavelength. Physically, this peak corresponds to the average speed of atoms or molecules inside the object, which is a manifestation of its temperature.
The hotter the object, the shorter the peak wavelength -- the object at 5500 K has a shorter λmax (530 nm) than the object at 2500 K (which has λmax of 1160 nm and is in the infrared portion of the EM spectrum). It makes sense, then, that hot objects give off a larger fraction of their energy at shorter wavelengths (higher energies) than do cool objects. You may have observed examples of this rule in everyday life. When a burner on an electric stove is turned on low, it emits only heat, which is infrared radiation, but does not glow with visible light. If the burner is set to a higher temperature, it starts to glow a dull red. At a still-higher setting, it glows a brighter orange-red (shorter wavelength). At even higher temperatures, which cannot be reached with ordinary stoves, metal can appear brilliant yellow or even blue-white.
We can use these ideas to come up with a thermometer for measuring the temperatures of stars. Because many stars give off most of their energy in visible light, the color of light that dominates a star’s appearance is an indicator of its temperature. If one star looks red and another looks blue, which one has the higher temperature? Because blue is the shorter-wavelength color, it is the sign of a hotter star. (Note that the temperatures we associate with different colors in science are not the same as the ones artists use. In art, red is often called a “hot” color and blue a “cool” color. Likewise, we commonly see red on faucet or air conditioning controls to indicate hot temperatures and blue to indicate cold temperatures. Although these are common uses to us in daily life, in nature, it’s the other way around.)
What about the Sun? The Sun has a surface temperature of 5800 K so Wien's law immediately tells us that λmax is 500 nm. Which corresponds to green light. But the Sun doesn't look green, it looks yellow or white! What's going on?! This makes sense when you consider that the Sun is also emitting red light and blue light; these all mix together as a nearly white color. Pure purple stars are also never seen for similar reasons -- the blue and violet mix into a more deep blue color.
C0lor Temperature
Different wavelengths (or frequencies) of light correspond to different colors. But what exactly is color? Is it a property of an object, like its size, or is it something that our brains perceive? Our eyes receive light, which is sent to the brain for processing. When we look at an object, we are seeing the light that is reflected off that object. If there is no light in the room, then we do not see anything at all. When light strikes an object, some of the light is reflected and some of it is absorbed. Human eyes have evolved to see visible light; some other animals, such as birds, can see ultraviolet light! Photoreceptors called cones in the retina of our eyes are sensitive to red, blue, and green light. In that sense, every color can be broken down into a combination of red, blue, and green. This is why television only needs those three colors to accurately simulate reality. In low light conditions, rods in the retina take over and are only sensitive to one color; hence, we see shades of gray.
The Sun emits white light, which contains all colors. As an example, let’s consider what happens when sunlight strikes a house painted red. The white light hits the red house, and only red light is reflected to our eyes; all of the other colors are absorbed by the paint molecules. Pigments are substances that selectively absorb very specific wavelengths of light, leaving only the desired wavelength of light reflected.
How does the color emitted by an object relate to its temperature? Wien’s law gives a mathematical relationship for this and shows that the temperature of a blackbody is inversely proportional to the wavelength of the light emitted. As a more visual example, consider a piece of metal being heated up. First it will turn a dull red color, then orange to white, and eventually it becomes blue when it is hottest. The scale is shown in Figure 10, where the temperatures are in Kelvin.
Light bulbs are designed with color temperature in mind. This is likely a familiar concept to photographers when selecting back lighting for a shoot. For a "candlelight" type background, a bulb of around 2000 K will be best, while a "natural daylight" background is best achieved with a bulb at 4500 K. Most fluorescent light bulbs in classrooms are around 5000 K while those in a library will be closer to 3000 K.
Luminosity and Brightness
Wien's Law shows that blackbodies, like stars, emit the most intense radiation at a specific wavelength, λmax. What exactly is this intensity a measure of?
Luminosity is the total amount of energy that an object (like a star) puts out each second. It has dimensional units of energy per second. In the same way that a 100 W bulb will always put out 100 Watts whether we are standing close or farther away, the luminosity of a star does not depend on our distance from it.
However, astronomers do not measure luminosity directly with a telescope; they measure brightness: the luminosity that is intercepted by a detector such as a photographic plate or a digital camera. If you imagine a spherical surface - a bubble - around a star, then the luminosity is the integrated (total) light from the surface of that bubble. The brightness, which is the luminosity per unit area, decreases as the surface area of the spherical volume increases. This is the same phenomenon that happens with expanding balloons. The balloon has a certain amount of material, usually latex or rubber. Analogous to luminosity, that amount of material is constant, no matter how much air is in the balloon. However, as the balloon expands, that constant amount of material is stretched over a larger surface area. The walls of the balloon get thinner and the amount of material per unit area decreases. The luminosity of a star is constant. The brightness that we measure depends on whether we are "up close" or far away from the star.
This is shown in Figure 11, where the light from a star with luminosity L spreads out into spheres of increasing surface area as it travels away from the star. At a distance d from the star, we can measure the brightness ($B$) by dividing the total power emitted by the star (L) by the surface area of the sphere that the light has now spread into:
[latex]$B = \frac{L}{4 \pi d^2}$[/latex]
This idea—that the apparent brightness of a source (how bright it looks to us) gets weaker with distance in the way we have described—is shown in Figure 11 below. At point 1, the light is concentrated into one box. By the time the light reaches point 2, which is twice as far as point 1, it is now spread out into four squares.
Concept Check: Brightness and distances of stars
You observe two stars, named Sol-2 and Sol-3, that have the exact same luminosity as the Sun (this means they have the same temperature, radius, and luminosity as the Sun). You measure the brightness of both stars with the same instrument and find that the light from Sol-2 is twenty-five times brighter than the light from Sol-3. Which star is closer to the Earth and by how much? Explain your reasoning.
Show Answer
Ans: Sol-2 is five times closer than Sol-3. Brightness drops as the distance squared, so the ratio of the distances to Sol-2 and Sol-3 is given by [latex]\sqrt{B_{Sol2}/B_{Sol3}}[/latex] or [latex]\sqrt{25}[/latex] = 5.
Let's consider the luminosity of the Sun and the amount of energy from the Sun that reaches the Earth. This will be important to know when we study exoplanets and want to know how much light from the host star reaches the exoplanet. The luminosity of the Sun is 3.9×1026 W -- in other words, it emits the same amount of power as 3.9×1024 100 W light bulbs (or 39 trillion trillion 100 W bulbs!). As the light travels away from the Sun, it is spread out more and more, as all of that light needs to cover spheres (bubbles) that have greater surface area. The distance from the Earth to the Sun is 151 million km, or 1.51×10¹¹ m. Putting this value into the brightness equation, we find that we receive 1360 W/m2 of sunlight on the Earth. That means every 1 m2 patch on the Earth, which is about the size of a standard chess board, receives 1360 Joules of energy every second. Venus is closer to the Sun than the Earth and receives more energy for every square meter, 2600 W/m2, while Mars is further and receives only 600 W/m2.
Worked Example: Calculating the energy received from the Sun
How much radiation from the Sun is received at Saturn's moon Titan? You can assume that Titan and Saturn are at the same distance from Earth.
We can find the value by using the relationship for brightness, luminosity and distance:
[latex]$B = \frac{L}{4 \pi d^2}$[/latex]
Here, L is the luminosity of the Sun and d is the distance of Titan from the Sun. The distance from the Sun to Titan (Saturn) is 1.45 billion km (or 1.45×10¹² m).
B = (3.9×1026 W)/(4 π (1.45×10¹² m)2) = 14.8 W/m2
This makes sense -- Saturn is almost 10 times further from the Sun than the Earth (Earth is 1 AU and Saturn is 9.57 AU), so the value should be significantly lower than Earth's. [In fact, you could also find this value by taking the ratio (1/9.57)2 and multiplying by 1360 W/m2]
Show mathematically that the Earth receives 1360 W/m2 from the Sun.
Show Answer
The only difference here is the distance: now it is the distance from the Earth to the Sun, which is 151 million km.
B = (3.9×1026 W)/(4 π (1.51×10¹¹ m)2) = 1361 W/m2
Spectroscopy
Light from objects is filled with information. By taking the light from an object and splitting it apart into a spectrum, we can decode this light. Spectroscopy is a fundamental tool for astrobiology and allows us to detect exoplanets and study the chemical makeup of their atmospheres.
The most familiar example of spectroscopy is the rainbow of colors that is produced when white light is sent through a prism, as seen in Figure 1. A water droplet can also split up (or disperse) light and create a rainbow when a light beam passes through it. Both prisms and water droplets can serve as spectrometers or spectrographs -- tools used to disperse light into a spectrum.
Stars emit all types of electromagnetic radiation but emit the most intense light at a specific wavelength (see Wien's Law). Note that infrared and ultraviolet light are also emitted by the Sun and are split out as seen in Figure 1 -- our eyes just can't perceive these types of radiation. The distribution of colors, which is naturally organized by wavelength (or frequency), is called a spectrum. There are three main types of spectra: continuous, absorption, and emission as shown in Figure 2. If the shape of the spectrum on the bottom left of Figure 2 looks familiar, it is because you have seen it before when learning about blackbody (thermal) radiation curves.
A continuous spectrum looks like the rainbow shown in Figure 1. However, sunlight that reaches the Earth actually is an absorption spectrum, not a continuous spectrum. Why? The Sun does emit a continuous spectrum from its core but some of that light is absorbed by different atoms as it passes through the Sun's atmosphere. This is shown in Figure 2. On the left, the Sun emits a continuous spectrum at its surface. But that light passes through the atmosphere (the cloud of gas in the middle) and some of that light is absorbed by atoms in the gas. The spectrum on the right is the type of spectrum seen for the Sun, where the dark lines correspond to the wavelengths associated with the atoms or molecules that absorbed the light. Figure 3 shows an absorption spectrum for the Sun, with some of the atoms and molecules present in the Sun's atmosphere labeled. This spectrum was taken from the Earth's surface, so the O2 (molecular oxygen) lines are from Earth's atmosphere.
What does it mean to say "the wavelengths associated with the atoms"? Every element on the periodic table has a different number of protons and thus a different structure. Hydrogen is the simplest atom, with just one proton and one electron orbiting the proton in a neutral atom. To get the electron out of the hydrogen atom entirely requires a certain amount of energy. If there is no energy supplied to the atom, it is stable and the electron is in what we call the ground state of energy. However, the electron can move to different energy levels above the ground state -- imagine rungs on a ladder, with the ground state at the bottom and the top rung being the amount of energy needed to kick the electron out of the atom. Hydrogen has a unique set of energy levels and each level has an exact amount of energy. And recall that this energy has an exact frequency or wavelength given by [latex]E=hf = h c/\lambda[/latex]. When light particles (photons) with exactly one of those wavelengths encounters the atom, it is absorbed. And every element has a different set of energy levels, meaning a distinct set of its own characteristic wavelengths. We thus have a very powerful way of learning which elements are inside a star's atmosphere.
Using the unique pattern of an element to identify whether it is inside of an atmosphere is similar to DNA barcoding used in forensics to identify a match to evidence at a crime scene. Figure 4 shows an example of some of the colors (wavelengths) for a few different elements. No two are the same and we can use these patterns to identify an element in a star or planet's atmosphere. This same technique is used extensively in biochemistry and many other scientific fields. We can think of the unique emission lines associated with an atom or molecule as its chemical fingerprint.
The middle part of Figure 2 shows the physical idea of how an emission spectrum is created. Let's say you have a gas made from atoms of just one type of element. If you heat up that gas, the electrons can move up to higher energy levels and then drop back down, emitting light in the process. This is almost the same situation as the absorption spectrum on the left except we are not looking at the continuous source and the gas but instead just at the gas...so there is no continuous spectrum in the background, just the bright lines that correspond to whatever element is in the gas. The atom is emitting energy at the unique set of wavelengths (colors) for that particular element. Of course, the gas can contain many different atoms and molecules at the same time.
You can take a look at the fingerprints for some other elements using the simulation below. Click on any element to see its unique set of spectral lines. Notice that you can choose to see both absorption (top) and emission (bottom) spectra.
Key Concepts and Summary
The energy of light is our messenger about the universe. Different colors of light are simply different wavelengths and different wavelengths of light contain different amounts of energy. The longest wavelengths in the electromagnetic spectrum are radio waves and these have the lowest energy. The shortest wavelengths are high energy gamma rays. Unsurprisingly, the visible band of light (where our brain interprets different wavelengths as different colors) matches the key energy output of the Sun - we evolved to optimally navigate this range of energies. By observing the universe with detectors that are sensitive to different energies of light, we can learn about the energy output and the peak temperatures of the objects we detect. Because the brightness of a star or other celestial object decreases with distance, a measurement of distance is needed to back out luminosity (energy per second). The wavelengths of light encode the energy and chemical composition of stars and other celestial bodies - astronomers use spectrographs to disperse light collected at a telescope into a spectrum. Objects emit a continuous (sometimes called "blackbody") spectrum with an intensity distribution that depends on temperature. When atomic transitions take place in cooler outer layers of stars, the spectrum can also have absorption or emission lines. Absorption lines occur when atoms absorb photons of light pushing electrons to a higher energy state. Emission lines occur when atoms release photons and the electrons cascade to a lower energy state.
Review Questions
Summary Questions
- What is energy? Describe two different kinds of energy and give examples of each.
- What does it mean to say the energy is "conserved"?
- How are the frequency and wavelength of light related to each other?
- What is a photon?
- Which property of light determine how much energy a photon has?
- What are the seven main parts of the electromagnetic spectrum? For each band (part), give an example of a source of that type of radiation.
- How does the type of light emitted by an object depend on its temperature?
- What is the difference between the brightness of an object (such as a star) and its luminosity?
- How does the total amount of energy emitted differ for hot and cold objects?
- How does spectroscopy give information about an object? What happens when starlight passes through a prism?
- What are the differences between continuous, absorption and emission spectra? What are the similarities between all three?
- Why are the spectral lines for an element sometimes called “chemical fingerprints”?
Activities
- Understanding blackbody radiation. Open the simulation at https://phet.colorado.edu/sims/html/blackbody-spectrum/latest/blackbody-spectrum_en.html.
- The default is set to the temperature of the Sun. Click on the "labels" box to show different parts of the EM spectrum (UV, visible, and infrared). What part of the EM spectrum has the most intense light from the Sun.
- Now set the thermometer to the temperature of the star Sirius. The y-axis now needs to be rescaled to see the value for the peak intensity, Adjust this by using the zoom out button. Once you can see the peak, click on the "Graph Values" box. What is the wavelength of the peak intensity light for Sirius?
- Energy flux. Calculate the solar flux (in W/m2) at the planet Mercury.
Life needs a source of energy to thrive. This energy can come in different forms, from sunlight to energy released when chemicals react. Light is a type of pure energy, and coded into the light and other kinds of radiation that reach us from objects in the universe is a wide range of information about what those objects are like and how they work. If we can decipher this code and read the messages it contains, we can learn an enormous amount about the cosmos without ever having to leave Earth or its immediate environment.
Learning Objectives
By the end of this chapter, you will be able to:
- Understand that there are different types of energy and that energy is conserved
- Explain the wavelength, frequency and energy of a wave or particle of light
- Discuss the different parts of the electromagnetic spectrum
- Explain how and why the light emitted by an object depends on its temperature
- Explain the difference between the luminosity and brightness of an object
- Explain how the total energy emitted differs for hot and cold objects
- Describe how spectroscopy can provide information about an object, such as a star.
- Discuss the difference between continuous, absorption and emission spectra.
Energy
Different types of energy are all around us -- the electrical energy that powers our technology, the chemical energy that is stored in the food we eat, and the heat energy we feel when when walking in sunlight. These different types of energy can be changed, or converted, from one type to another. For example, the chemical energy in food is converted to energy that allows us to think and move around. We will see other examples of energy transformations in astrobiology, such as the gravitational energy that is converted into heat when a giant cloud of gas and dust collapses and eventually forms stars.
The amount of the energy in the universe is always the same and it is continuously being changed from one form into another. This is the essence of the law of conservation of energy. Other quantities in nature, such as mass and momentum, are also conserved.
Though energy cannot be created or destroyed, it can be transformed into different forms. The two main forms of energy are kinetic energy and potential energy. Kinetic energy is the energy of motion. When an object is moving more quickly, it has more energy. A fast-moving car has more energy than a slow moving car. Thermal energy is actually a form of kinetic energy since higher temperature is really a measure of the average speed of atoms and molecules -- the higher the temperature, the greater the kinetic energy of the atoms and molecules.
Potential energy is the energy that is associated with different positions in space. When you throw a ball high into the air, it has more gravitational potential energy than when it is held in your hand. When an object moves from an area of high potential energy to low potential energy, that energy will be transformed into another form. For example, when an apple falls to the Earth, it will speed up gaining kinetic energy. But potential energy does not need to be related just to gravity. For example, the energy stored in chemicals is in the form of chemical potential energy which can be determined based on the position of different atoms bonded to each other by electric forces of attraction.
A more recently discovered form of energy is the energy associated with mass itself. Einstein's famous equation [latex]E=mc^2[/latex] tells us, that mass-energy equivalence is a fundamental feature of the universe. Any object that has mass therefore also contains energy -- this type of energy is called rest-mass energy. Inside the core of stars, nuclear fusion converts some of the rest-mass of two protons into energy. This process occurs an astounding 1038 times every second and is the source of the energy from the Sun that we receive on Earth.
Light
A great deal of the energy that life on Earth uses comes in one way or another from the Sun's light, although geothermal energy from inside the Earth can also be harnessed. Light from the Sun, or any star, is an example of electromagnetic radiation. Here, the words light and radiation are synonymous, and both are a form of energy. Radiation can sometimes be thought of as dangerous and some types are (for example, gamma rays and X rays), but radiation is a neutral term and is synonymous with energy.
One of the more bizarre aspects of light is the way that it acts, specifically the fact that it can behave like a wave and a particle. In the 17th century, the nature of light was debated and both Isaac Newton and Christiaan Huygens tried to explain it. Newton experimented with lenses and prisms and believed that light was a stream of particles, which he called corpuscles. Huygens, on the other hand, believed that light was a wave that traveled outward in all directions from a source, much like the ripples on a pond that expand outward through the water after a stone is dropped into it. Building upon pioneering work by James Clerk Maxwell and Max Planck, Albert Einstein proposed in 1905 that light can indeed behave both ways, thus solidifying the concept of wave-particle duality, one of the tenets of quantum mechanics. The wave and particle nature of light has now been experimentally verified countless times.
Light as a Wave
Light carries energy and information from one place to another, and this energy is carried in the form of electromagnetic (EM) waves. Other familiar types of waves in nature include sound waves and water waves. All three of these types of waves have some differences and some similarities.
Water and sound waves are mechanical waves and require a medium to travel in. For sound waves, the medium is air and the medium is water for water waves. If you screamed on the surface of the Moon, which has no atmosphere, nobody would hear you as the sound waves have no medium to travel through. (The director Stanley Kubrick got it right in the film 2001: A Space Odyssey.) EM waves do not require water or air or any medium to travel though – they can travel through empty space. This was such a disturbing idea to nineteenth-century scientists that they actually made up a substance to fill all of space—one for which there was no evidence—just so light waves could have something to travel through: they called it the aether. Today, we know that there is no aether and that EM waves have no trouble at all moving through empty space (as all the starlight visible on a clear night must surely be doing).
The speed of a sound wave depends on the medium through which it is traveling. A sound wave moves faster through water than it does through air, for example. However, all electromagnetic waves move at the same speed in empty space (the speed of light—approximately 300,000 kilometers per second, or 300,000,000 meters per second, which can also be written as 3×10⁸ m/s), which turns out to be the fastest possible speed in the universe.
Now for some similarities. All waves are a kind of repeating phenomenon. Whether it is the up-and-down motion of a water wave or the changing electric and magnetic fields in a wave of light, the pattern of disturbance repeats in a cyclical way. Thus, any wave motion can be characterized by a series of crests and troughs. Moving from one crest through a trough to the next crest completes one cycle. The horizontal length covered by one cycle is called the wavelength (λ). Ocean waves provide an analogy: the wavelength is the distance that separates successive wave crests. An example of water waves created when a frog leaps into a pond is shown in Figure 1.
We can also characterize different waves by their frequency, which is the number of wave cycles that pass by per second. If you count 10 crests moving by each second, for example, then the frequency is 10 cycles per second (cps). In honor of Heinrich Hertz, the late nineteenth physicist who, inspired by physicist James Clerk Maxwell’s work, discovered radio waves, a cps is also called a hertz (Hz). Take a look at your radio, for example, and you will see the channel assigned to each radio station is characterized by its frequency, usually in units of kHz (kilohertz, or thousands of hertz) or MHz (megahertz, or millions of hertz).
Concept Check: Wavelength and Frequency
Figure 3 is a schematic showing the wavelengths and frequencies for different colors of light. Red light is at the top and its wavelength (λ) is shown as the distance between two peaks, where the peaks are marked by the vertical black lines. Blue light is on the bottom; notice that it has a shorter wavelength than red light (the length between the two peaks is noticeably shorter).
The frequency of a wave is a measure of how many waves pass by in one second. Let's imagine that the amount of time that elapsed for each of the waves in Figure 3 is 1 second. Looking at red light, two full waves can pass by in this 1 second period, so we say the frequency is 2 cycles per second, or 2 Hz. (Actually, a bit more than two red light wave cycles can pass by, about 2.5, but we will say 2 full waves to keep this example simple.)
- Which color of light has the highest frequency? How about the lowest frequency?
- Which color of light has the shortest wavelength?
Show Answer
- Looking at Figure 3, the most crests pass by in one second for blue light (6 Hz) while the fewest pass by for red light. Thus, blue light has the highest frequency and red light has the lowest.
- Since blue light has the highest frequency, it also has the shortest wavelength. It is easy to see in Figure 3 that λ is shortest for blue light.
Wavelength (λ) and frequency (f) are related because all electromagnetic waves travel at the same speed. The formula for this relationship can be expressed as follows: for any wave motion, the speed at which a wave moves equals the frequency times the wavelength. Waves with longer wavelengths have lower frequencies. Mathematically, we can express this as
$ c = \lambda f $
where the Greek letter for “l”—lambda, λ—is used to denote wavelength and c is the scientific symbol for the speed of light.
The electromagnetic wave model of light (as formulated by James Clerk Maxwell) was one of the great triumphs of nineteenth-century science. In 1887, when Heinrich Hertz actually made invisible electromagnetic waves (what today are called radio waves) on one side of a room and detected them on the other side, it ushered in a new era that led to the modern age of telecommunications. His experiment ultimately led to the technologies of television, cell phones, and today’s wireless networks around the globe.
Light as a Photon
By the beginning of the twentieth century, physicists had to reluctantly accept that sometimes light behaves more like a “particle”—or at least a self-contained packet of energy—than a wave. We call such a packet of electromagnetic energy a photon.
A photon carries a specific amount of energy. How much energy a photon has depends on its frequency. We can use the idea of energy to connect the photon and wave models. How much energy a photon has depends on its frequency. A low-energy radio wave has a low frequency, while a high-energy X-ray at your dentist’s office is a high-frequency wave. Among the colors of visible light, violet-light photons have the highest energy and red-light photons have the lowest.
Test whether the connection between photons and waves is clear to you. In the above example, which photon would have the longer wavelength as a wave: the radio wave or the X-ray? If you answered the radio wave, you are correct. Radio waves have a lower frequency, so the wave cycles are longer
The Electromagnetic Spectrum
Objects in the universe send out an enormous range of radiation, or light. Scientists call this range the electromagnetic (EM) spectrum, which are divided into a number of regions. The spectrum is shown in Figure 4, with some information about the waves in each part or band.
Looking at the EM spectrum in Figure 4, we see that:
- Gamma rays have the highest energy and radio waves have the lowest energy
- Radio waves have the longest wavelength and gamma rays have the shortest wavelength
- Radio waves have the highest frequency and gamma rays have the lowest frequency
These properties of light are summarized by the beautifully simple equation that relates the energy of a photon to its frequency (or wavelength), where h is Planck's constant:
[latex]E=hf[/latex]
This relationship shows the wave-particle duality of light, as the energy of photon (a particle of light) is directly related to its frequency (a wave property). Since h has a constant value, you can immediately get the energy of a particular color of light simply by knowing its frequency (or wavelength, which can be expressed as [latex]\lambda = c / f[/latex]).
Another property of light that has already been mentioned but is worth re-emphasizing is that all types of light travel at the speed of light. Since the speed of light is constant, all light travels at the same speed.
Worked Example: Frequency and Wavelength
Red light has a wavelength of about 650 nm and blue light has a wavelength of about 450 nm. Recall that nm is the abbreviation for nanometers.
What is the frequency of red light?
The frequency of any type of light is related to its wavelength as [latex]f = c / \lambda[/latex], where c is the speed of light.
To use this equation, we must be sure that the units are all consistent. If we use 3×10⁸ m/s for the speed of light, then the wavelength must be in units of meters and the frequency will be in units of Hz (where 1 Hz = 1 cycle per second). So, we must first convert the wavelength from nanometers into meters. One nanometer is one-billionth of a meter: 1 nm = 10-9 m so it follows that 650 nm = 650×10-9 m. Expressed in scientific notation, the wavelength of red light is 6.50×10⁻⁷ m.
[latex]f = c / \lambda[/latex] = (3×10⁸ m/s) ⁄ (6.50×10⁻⁷ m) = 461,538,461,538,461 Hz
That's a huge number of cycles in one second! Expressing this in scientific notation, f = 4.62×10¹⁴ Hz.
The wavelength of visible light (like red and blue) is often reported in THz, where T is the prefix one trillion, or 1012.
Extra 1: Show that the frequency can also be expressed as 462 THz.
Show Answer
The frequency 4.62×10¹⁴ Hz can also be written as 4.62×102×1012 Hz
4.62×102 = 462 and 1012 Hz = 1 THZ, so f = 462 THz
Extra 2: Show that the frequency of blue light (with a wavelength of 450 nm) is 666 THz.
Show Answer
[latex]f = c / \lambda[/latex] = (3×10⁸ m/s) ⁄ (4.50×10⁻⁷ m) = 6.66×10¹⁴ Hz = 666 THz
Types of Electromagnetic Radiation
Throughout our study of astrobiology, we will encounter all types of light. When we collect light using a camera or sensor on the Earth's surface, that light must first travel through the Earth's atmosphere before it reaches the ground. Depending on the type of light, some of it may be partially or completely absorbed by molecules in different parts of the Earth's atmosphere. This means that some types of telescopes need to be above the Earth's atmosphere in order to detect any light. Also, we will see that this absorbed light will show up as a kind of set of Earth's chemical fingerprints in any observations that contain the Earth's atmosphere; this is the basic idea behind biosignatures for life, and we will probe it more deeply in the SETI chapters.
The way that light is absorbed in Earth's atmosphere for each part of the EM spectrum is shown in Figure 5.
We highlight a few properties of each type of light that are of relevance to astrobiology, as well as what types of telescopes are used to study the universe in each type of light.
Radio Waves
Radio waves have the longest wavelengths of any type of radiation -- they can range from a few millimeters all they way up to hundreds of kilometers (for reference, Switzerland is about 300 km across). Radio waves have very low energies and are all around us in our everyday lives. On Earth, cell phones, radio and TV transmissions, satellites and radar all emit radio waves and these pass right through our bodies. Radio waves are also produced in nature by a number of astrophysical objects, including stars and pulsars. The most abundant element in the cosmos -- hydrogen -- also naturally emits radio waves at a very specific wavelength of 21 cm (which corresponds to a frequency of 1420 MHz). As we will see later in the chapter on SETI, astronomers search for signals from advanced extraterrestrial civilizations that are close to the 21 cm radiation that hydrogen produces.
Most radio waves reach the ground, as seen by the "radio window" in Figure 5. The lowest frequency radio waves do not make it to the Earth's surface and this region of the EM spectrum remains unexplored. Because radio waves are long, in general the telescopes (in the case of radio astronomy, these are called dishes or antennae) need to be very large. Some of the first radio observations made to look for signs of intelligent life were carried out by Frank Drake in 1960 using the 85-foot Green Bank Telescope. There is another way to work around the large size needed for dishes through a technique called interferometry. Using this technique, a number of small radio dishes can be made to work in concert and achieve the same precision as a larger dish. The Hat Creek Radio Observatory in northern California, for example, has 28 dishes that are each 6 meters and can all point to the same target on the sky and collectively function as a 40 m dish.
Microwaves
Microwaves are also low energy radiation and have sizes that range from about 1 mm up to 300 mm. The most familiar source of microwaves on Earth is probably microwave ovens. Microwaves are used extensively by satellites to monitor weather on the Earth (Doppler radar maps use microwaves) and for remote sensing of the Earth's surface. The ancient radiation left over from the Big Bang also happens to fall into the microwave part of the EM spectrum. This Cosmic Microwave Background (CMB) radiation was discovered serendipitously in 1965 and has a wavelength of 1.9 mm. The CMB is literally everywhere on the sky and will appear as "background noise" in any observations that include this wavelength.
As seen in Figure 5, some microwave radiation makes it to the ground (the telescope used to detect the CMB in 1965 was on the ground in New Jersey, USA) but some parts are also absorbed by the Earth's atmosphere. The COBE, WMAP, and Planck missions all studied the CMB in more detail and were space-based missions.
Infrared
Infrared light is given off by anything with a temperature. This discovery was made in 1800 by the astronomer William Herschel. Herschel studied the rainbow created when white light was sent through a prism and he found that the invisible region beyond the red edge of the rainbow was hotter than the temperature of the rainbow! Herschel called this type of radiation "calorific rays", or heat rays, and today we refer to these heat rays as infrared (IR) light. Our eyes are only sensitive to visible light (some animals, such as vampire bats and goldfish, can see into the infrared), although we can still "see" this type of light by using an IR camera or night vision goggles. These types of sensors pick up differences in infrared intensity. Since most IR light gets absorbed by the Earth's atmosphere, many IR telescopes are in space.
IR light is of great importance in astronomy because it can penetrate, or travel through, dust that is opaque to visible light. This idea is best shown with a comparison of the same picture taken in visible light and infrared light. Figure 7 shows pictures of the Carina Nebula taken by the Hubble Space Telescope (HST) in visible light (left) and infrared light (right). You can see an enormous amount of stars and other objects in the infrared that are not seen in the visible, as infrared light travels right through the dust while visible light is absorbed by the dust.
The James Webb Space Telescope (JWST), which launched in 2021 and has a mirror 2.7 times larger than the HST (meaning it can collect over 7 times as much light), detects IR light. IR light covers the range of about 1-1000 micrometers, where micrometers are abbreviated as μm and are often referred to as microns; for reference, E. Coli bacteria are 2 microns and a human hair is 100 microns. JWST can sense wavelengths in the range of 0.6-28 microns. One of the main goals of JWST is to study planetary systems and the origin of life. One way JWST is doing this is by studying the atmospheres of exoplanets to see if any molecules needed for life, as we know it, are present. This will be discussed in more detail in the chapters on exoplanets.
Visible Light
Human eyes evolved to detect wavelengths spanning the visible part of the EM spectrum, which covers 400 nm to 750 nm. Stars emit visible light and life on Earth would not exist without the light from the Sun. Microscopes and optical telescopes both take visible light and focus it into an image -- the study of visible light is essential to astrobiology. For example, detailed pictures of the surface of Mars that show evidence for past liquid water are taken with visible cameras like Mastcam-Z on the Perseverance rover.
Visible light is not absorbed by the Earth's atmosphere but it does get distorted as it passes through, thus causing images to become blurry. Stars as viewed from the Earth's surface appear to twinkle for this reason. However, optical (visible) telescopes on the Earth's surface can use techniques such as adaptive optics to correct for the atmospheric distortion of visible light. The Hubble Space Telescope does not need to worry about this when it collects visible light.
Some searches for intelligent extraterrestrial life in the universe are carried out using optical telescopes; these searches typically scan the sky and look for anomalous pulses, perhaps from lasers being used by a distant civilization.
Ultraviolet
Ultraviolet (UV) light has a shorter wavelength than visible light and ranges from about 10-400 nm. Stars hotter than the Sun emit primarily UV light but the Sun emits some UV light, too. This is probably most apparent when you are outside on a sunny day and forgot to bring some sunblock -- your skin will absorb some of the UV (specifically, UVA) light. The fact that stars emit UV radiation is important for many aspects of life, in addition to protecting your skin. UV light can actually break the bonds between the hydrogen and oxygen atoms in a water molecule in a process called photolysis and this can create ozone in the atmosphere, which in turn protects life from dangerous radiation that can damage cells.
UV light is emitted from a range of astrophysical sources, including sites of star formation and planetary aurorae. As seen in Figure 5, nearly all UV radiation is absorbed by the Earth's atmosphere so UV telescopes are almost always in space, although some telescopes on high mountain tops, like the Keck telescopes atop Mauna Kea in Hawaii, have UV instruments. NASA's SWIFT satellite is actively studying the universe in UV light, and the Hubble Space Telescope has been probing a wide range of UV sources since 1990.
X Rays
X rays are a high energy type of radiation, with short wavelengths of just 0.01-10 nm, and they can be absorbed by tissue and bones in our bodies. They can destroy DNA so great care is taken when X ray machines are used to take medical images. Fortunately for life, X rays are absorbed by the Earth's atmosphere so they are not a concern on Earth's surface (but are a great concern for astronauts traveling above the Earth's atmosphere).
X rays are generated by high energy astrophysical phenomena such as supernova as well as the Sun's corona. During a total solar eclipse, the very hot gas in the Sun's corona can be seen. The composition of soil on Mars is studied using X ray instruments on Martian rovers, such as Spirit and Opportunity and the active Perseverance mission.
Gamma Rays
Gamma rays are the most energetic type of radiation in the cosmos and have wavelengths on the order of the size of the nucleus inside an atom. On Earth, gamma rays are produced naturally by lightning and radioactivity. Gamma rays are also created when two neutron stars merge, in addition to the gravitational waves that these events create. Gamma rays produced in neutron star mergers produce many of the heavy elements on the periodic table, such as gold and platinum.
Gamma rays do not make it to the Earth's surface so gamma ray observatories need to be in space. The Fermi Space Telescope has been studying gamma rays on the sky since 2008 and has created a complete map of the sky in gamma rays. The surface composition of a planet can be studied using gamma ray instruments -- the MESSENGER mission to Mercury carried a gamma ray spectrometer.
Multiple Wavebands
To fully understand an object, we ideally want to look at in every type of light that it emits. For many object, this can include all types of radiation, from radio waves to gamma ray. An example of this is shown in Figure 8 for the Crab Nebula:
Understanding Radiation
Some astronomical objects emit mostly infrared radiation, others mostly visible light, and still others mostly ultraviolet radiation. What determines the type of electromagnetic radiation emitted by the Sun, stars, and other dense astronomical objects? The answer often turns out to be their temperature.
At the microscopic level, everything in nature is in motion. A solid is composed of molecules and atoms in continuous vibration: they move back and forth in place, but their motion is much too small for our eyes to make out. A gas consists of atoms or molecules that are flying about freely at high speed, continually bumping into one another and bombarding the surrounding matter. The hotter the solid or gas, the faster the motion of its atoms or molecules. The temperature of something is thus a measure of the average motion energy of the particles that make it up.
This motion at the microscopic level is responsible for much of the EM radiation on Earth and in the universe. As atoms and molecules move about and collide, or vibrate in place, their electrons give off EM radiation. The characteristics of this radiation are determined by the temperature of those atoms and molecules. In a hot material, for example, the individual particles vibrate in place or move rapidly from collisions, so the emitted waves are, on average, more energetic. And recall that higher energy waves have a higher frequency. In cooler materials, the particles have lower energy atomic and molecular motions and thus generate lower energy waves.
Blackbody Radiation and Wien's Law
To further understand the relationship between temperature and light (EM radiation), we consider a type of ideal object called a blackbody. A blackbody absorbs all light that hits it; none of the incoming light is reflected away or passes through the object. The object heats up and gains energy; the object then loses this energy by emitting light at all wavelengths (recall that light is a type of energy). In other words, the object cools off until it reaches the same temperature as its surroundings -- this is called thermodynamic equilibrium -- and it does this by converting the energy it absorbed into energy of motion that is radiated in a specific way (this radiated energy is called thermal or blackbody radiation). A glowing ember of coal cools by radiating energy until it reaches the same temperature as its environment.
Any dense, solid object that has a temperature emits blackbody radiation; this includes people, animals, stove tops, light bulbs, stars and planets. For example, the Earth absorbs EM radiation from the Sun, heats up, and then emits radiation as mostly infrared light. Note that any objects that reflect light, such as a book with a red cover, are not blackbodies. Similarly, if light passes through the object, as with a glass table, it is also not a blackbody. In that respect, the Earth is not a perfect blackbody, since clouds and other particulate matter do reflect some sunlight.
No object in nature is a perfect blackbody but many opaque objects behave like a blackbody so it is a very good approximation and we can use some fairly simple math to learn more about the object. As mentioned above, blackbody radiation is not emitted at just one wavelength or one part of the EM spectrum, but covers all wavelengths. At first this may sound strange -- since humans act like blackbodies, does that mean that our bodies emit dangerous X rays and gamma rays? No, that is not the case (I don't have X ray eyes) and any blackbody emits the most intense radiation at one particular wavelength. Humans have a typical temperature of 98.6°F (or 310 K) and emit the most intense radiation at 9.3 microns (an infrared wavelength, meaning we radiate heat!). The peak wavelength of the radiation that a blackbody gives off depends only on its temperature. This means two very different objects with the same temperature emit identically with the same wavelength of peak intensity. The Earth is just a little bit cooler than a human at 288 K, and its most intense radiation is at 10.1 microns. This relationship between the temperature of a blackbody and its peak wavelength is called Wien's Law and is:
[latex]\lambda_{\rm max} = \frac{ 0.0029 }{T} \rm{~m ~K}[/latex]
where the wavelength is in meters and the temperature is in K (the constant 0.0029 has units of m × K). You can easily verify λmax for a human at 310 K: (0.0029 m K)/(310 K) = 9.3×10⁻⁶ m = 9.3 microns.
The thermal radiation emitted by any blackbody shows a similar shape in the intensity of light at different wavelengths. These shapes are called blackbody curves or thermal energy curves. Figure 9 shows this general shape for blackbody curves for objects of different temperatures. The shape is similar for all temperatures but notice that the intensity for each blackbody curve peaks at a different maximum wavelength.
Notice in Figure 9 that the curves show that, at each temperature, the blackbody objects emit radiation at all wavelengths (all colors) but that the most energy is emitted at a peak wavelength. Physically, this peak corresponds to the average speed of atoms or molecules inside the object, which is a manifestation of its temperature.
The hotter the object, the shorter the peak wavelength -- the object at 5500 K has a shorter λmax (530 nm) than the object at 2500 K (which has λmax of 1160 nm and is in the infrared portion of the EM spectrum). It makes sense, then, that hot objects give off a larger fraction of their energy at shorter wavelengths (higher energies) than do cool objects. You may have observed examples of this rule in everyday life. When a burner on an electric stove is turned on low, it emits only heat, which is infrared radiation, but does not glow with visible light. If the burner is set to a higher temperature, it starts to glow a dull red. At a still-higher setting, it glows a brighter orange-red (shorter wavelength). At even higher temperatures, which cannot be reached with ordinary stoves, metal can appear brilliant yellow or even blue-white.
We can use these ideas to come up with a thermometer for measuring the temperatures of stars. Because many stars give off most of their energy in visible light, the color of light that dominates a star’s appearance is an indicator of its temperature. If one star looks red and another looks blue, which one has the higher temperature? Because blue is the shorter-wavelength color, it is the sign of a hotter star. (Note that the temperatures we associate with different colors in science are not the same as the ones artists use. In art, red is often called a “hot” color and blue a “cool” color. Likewise, we commonly see red on faucet or air conditioning controls to indicate hot temperatures and blue to indicate cold temperatures. Although these are common uses to us in daily life, in nature, it’s the other way around.)
What about the Sun? The Sun has a surface temperature of 5800 K so Wien's law immediately tells us that λmax is 500 nm. Which corresponds to green light. But the Sun doesn't look green, it looks yellow or white! What's going on?! This makes sense when you consider that the Sun is also emitting red light and blue light; these all mix together as a nearly white color. Pure purple stars are also never seen for similar reasons -- the blue and violet mix into a more deep blue color.
C0lor Temperature
Different wavelengths (or frequencies) of light correspond to different colors. But what exactly is color? Is it a property of an object, like its size, or is it something that our brains perceive? Our eyes receive light, which is sent to the brain for processing. When we look at an object, we are seeing the light that is reflected off that object. If there is no light in the room, then we do not see anything at all. When light strikes an object, some of the light is reflected and some of it is absorbed. Human eyes have evolved to see visible light; some other animals, such as birds, can see ultraviolet light! Photoreceptors called cones in the retina of our eyes are sensitive to red, blue, and green light. In that sense, every color can be broken down into a combination of red, blue, and green. This is why television only needs those three colors to accurately simulate reality. In low light conditions, rods in the retina take over and are only sensitive to one color; hence, we see shades of gray.
The Sun emits white light, which contains all colors. As an example, let’s consider what happens when sunlight strikes a house painted red. The white light hits the red house, and only red light is reflected to our eyes; all of the other colors are absorbed by the paint molecules. Pigments are substances that selectively absorb very specific wavelengths of light, leaving only the desired wavelength of light reflected.
How does the color emitted by an object relate to its temperature? Wien’s law gives a mathematical relationship for this and shows that the temperature of a blackbody is inversely proportional to the wavelength of the light emitted. As a more visual example, consider a piece of metal being heated up. First it will turn a dull red color, then orange to white, and eventually it becomes blue when it is hottest. The scale is shown in Figure 10, where the temperatures are in Kelvin.
Light bulbs are designed with color temperature in mind. This is likely a familiar concept to photographers when selecting back lighting for a shoot. For a "candlelight" type background, a bulb of around 2000 K will be best, while a "natural daylight" background is best achieved with a bulb at 4500 K. Most fluorescent light bulbs in classrooms are around 5000 K while those in a library will be closer to 3000 K.
Luminosity and Brightness
Wien's Law shows that blackbodies, like stars, emit the most intense radiation at a specific wavelength, λmax. What exactly is this intensity a measure of?
Luminosity is the total amount of energy that an object (like a star) puts out each second. It has dimensional units of energy per second. In the same way that a 100 W bulb will always put out 100 Watts whether we are standing close or farther away, the luminosity of a star does not depend on our distance from it.
However, astronomers do not measure luminosity directly with a telescope; they measure brightness: the luminosity that is intercepted by a detector such as a photographic plate or a digital camera. If you imagine a spherical surface - a bubble - around a star, then the luminosity is the integrated (total) light from the surface of that bubble. The brightness, which is the luminosity per unit area, decreases as the surface area of the spherical volume increases. This is the same phenomenon that happens with expanding balloons. The balloon has a certain amount of material, usually latex or rubber. Analogous to luminosity, that amount of material is constant, no matter how much air is in the balloon. However, as the balloon expands, that constant amount of material is stretched over a larger surface area. The walls of the balloon get thinner and the amount of material per unit area decreases. The luminosity of a star is constant. The brightness that we measure depends on whether we are "up close" or far away from the star.
This is shown in Figure 11, where the light from a star with luminosity L spreads out into spheres of increasing surface area as it travels away from the star. At a distance d from the star, we can measure the brightness ($B$) by dividing the total power emitted by the star (L) by the surface area of the sphere that the light has now spread into:
[latex]$B = \frac{L}{4 \pi d^2}$[/latex]
This idea—that the apparent brightness of a source (how bright it looks to us) gets weaker with distance in the way we have described—is shown in Figure 11 below. At point 1, the light is concentrated into one box. By the time the light reaches point 2, which is twice as far as point 1, it is now spread out into four squares.
Concept Check: Brightness and distances of stars
You observe two stars, named Sol-2 and Sol-3, that have the exact same luminosity as the Sun (this means they have the same temperature, radius, and luminosity as the Sun). You measure the brightness of both stars with the same instrument and find that the light from Sol-2 is twenty-five times brighter than the light from Sol-3. Which star is closer to the Earth and by how much? Explain your reasoning.
Show Answer
Ans: Sol-2 is five times closer than Sol-3. Brightness drops as the distance squared, so the ratio of the distances to Sol-2 and Sol-3 is given by [latex]\sqrt{B_{Sol2}/B_{Sol3}}[/latex] or [latex]\sqrt{25}[/latex] = 5.
Let's consider the luminosity of the Sun and the amount of energy from the Sun that reaches the Earth. This will be important to know when we study exoplanets and want to know how much light from the host star reaches the exoplanet. The luminosity of the Sun is 3.9×1026 W -- in other words, it emits the same amount of power as 3.9×1024 100 W light bulbs (or 39 trillion trillion 100 W bulbs!). As the light travels away from the Sun, it is spread out more and more, as all of that light needs to cover spheres (bubbles) that have greater surface area. The distance from the Earth to the Sun is 151 million km, or 1.51×10¹¹ m. Putting this value into the brightness equation, we find that we receive 1360 W/m2 of sunlight on the Earth. That means every 1 m2 patch on the Earth, which is about the size of a standard chess board, receives 1360 Joules of energy every second. Venus is closer to the Sun than the Earth and receives more energy for every square meter, 2600 W/m2, while Mars is further and receives only 600 W/m2.
Worked Example: Calculating the energy received from the Sun
How much radiation from the Sun is received at Saturn's moon Titan? You can assume that Titan and Saturn are at the same distance from Earth.
We can find the value by using the relationship for brightness, luminosity and distance:
[latex]$B = \frac{L}{4 \pi d^2}$[/latex]
Here, L is the luminosity of the Sun and d is the distance of Titan from the Sun. The distance from the Sun to Titan (Saturn) is 1.45 billion km (or 1.45×10¹² m).
B = (3.9×1026 W)/(4 π (1.45×10¹² m)2) = 14.8 W/m2
This makes sense -- Saturn is almost 10 times further from the Sun than the Earth (Earth is 1 AU and Saturn is 9.57 AU), so the value should be significantly lower than Earth's. [In fact, you could also find this value by taking the ratio (1/9.57)2 and multiplying by 1360 W/m2]
Show mathematically that the Earth receives 1360 W/m2 from the Sun.
Show Answer
The only difference here is the distance: now it is the distance from the Earth to the Sun, which is 151 million km.
B = (3.9×1026 W)/(4 π (1.51×10¹¹ m)2) = 1361 W/m2
Spectroscopy
Light from objects is filled with information. By taking the light from an object and splitting it apart into a spectrum, we can decode this light. Spectroscopy is a fundamental tool for astrobiology and allows us to detect exoplanets and study the chemical makeup of their atmospheres.
The most familiar example of spectroscopy is the rainbow of colors that is produced when white light is sent through a prism, as seen in Figure 1. A water droplet can also split up (or disperse) light and create a rainbow when a light beam passes through it. Both prisms and water droplets can serve as spectrometers or spectrographs -- tools used to disperse light into a spectrum.
Stars emit all types of electromagnetic radiation but emit the most intense light at a specific wavelength (see Wien's Law). Note that infrared and ultraviolet light are also emitted by the Sun and are split out as seen in Figure 1 -- our eyes just can't perceive these types of radiation. The distribution of colors, which is naturally organized by wavelength (or frequency), is called a spectrum. There are three main types of spectra: continuous, absorption, and emission as shown in Figure 2. If the shape of the spectrum on the bottom left of Figure 2 looks familiar, it is because you have seen it before when learning about blackbody (thermal) radiation curves.
A continuous spectrum looks like the rainbow shown in Figure 1. However, sunlight that reaches the Earth actually is an absorption spectrum, not a continuous spectrum. Why? The Sun does emit a continuous spectrum from its core but some of that light is absorbed by different atoms as it passes through the Sun's atmosphere. This is shown in Figure 2. On the left, the Sun emits a continuous spectrum at its surface. But that light passes through the atmosphere (the cloud of gas in the middle) and some of that light is absorbed by atoms in the gas. The spectrum on the right is the type of spectrum seen for the Sun, where the dark lines correspond to the wavelengths associated with the atoms or molecules that absorbed the light. Figure 3 shows an absorption spectrum for the Sun, with some of the atoms and molecules present in the Sun's atmosphere labeled. This spectrum was taken from the Earth's surface, so the O2 (molecular oxygen) lines are from Earth's atmosphere.
What does it mean to say "the wavelengths associated with the atoms"? Every element on the periodic table has a different number of protons and thus a different structure. Hydrogen is the simplest atom, with just one proton and one electron orbiting the proton in a neutral atom. To get the electron out of the hydrogen atom entirely requires a certain amount of energy. If there is no energy supplied to the atom, it is stable and the electron is in what we call the ground state of energy. However, the electron can move to different energy levels above the ground state -- imagine rungs on a ladder, with the ground state at the bottom and the top rung being the amount of energy needed to kick the electron out of the atom. Hydrogen has a unique set of energy levels and each level has an exact amount of energy. And recall that this energy has an exact frequency or wavelength given by [latex]E=hf = h c/\lambda[/latex]. When light particles (photons) with exactly one of those wavelengths encounters the atom, it is absorbed. And every element has a different set of energy levels, meaning a distinct set of its own characteristic wavelengths. We thus have a very powerful way of learning which elements are inside a star's atmosphere.
Using the unique pattern of an element to identify whether it is inside of an atmosphere is similar to DNA barcoding used in forensics to identify a match to evidence at a crime scene. Figure 4 shows an example of some of the colors (wavelengths) for a few different elements. No two are the same and we can use these patterns to identify an element in a star or planet's atmosphere. This same technique is used extensively in biochemistry and many other scientific fields. We can think of the unique emission lines associated with an atom or molecule as its chemical fingerprint.
The middle part of Figure 2 shows the physical idea of how an emission spectrum is created. Let's say you have a gas made from atoms of just one type of element. If you heat up that gas, the electrons can move up to higher energy levels and then drop back down, emitting light in the process. This is almost the same situation as the absorption spectrum on the left except we are not looking at the continuous source and the gas but instead just at the gas...so there is no continuous spectrum in the background, just the bright lines that correspond to whatever element is in the gas. The atom is emitting energy at the unique set of wavelengths (colors) for that particular element. Of course, the gas can contain many different atoms and molecules at the same time.
You can take a look at the fingerprints for some other elements using the simulation below. Click on any element to see its unique set of spectral lines. Notice that you can choose to see both absorption (top) and emission (bottom) spectra.
Key Concepts and Summary
The energy of light is our messenger about the universe. Different colors of light are simply different wavelengths and different wavelengths of light contain different amounts of energy. The longest wavelengths in the electromagnetic spectrum are radio waves and these have the lowest energy. The shortest wavelengths are high energy gamma rays. Unsurprisingly, the visible band of light (where our brain interprets different wavelengths as different colors) matches the key energy output of the Sun - we evolved to optimally navigate this range of energies. By observing the universe with detectors that are sensitive to different energies of light, we can learn about the energy output and the peak temperatures of the objects we detect. Because the brightness of a star or other celestial object decreases with distance, a measurement of distance is needed to back out luminosity (energy per second). The wavelengths of light encode the energy and chemical composition of stars and other celestial bodies - astronomers use spectrographs to disperse light collected at a telescope into a spectrum. Objects emit a continuous (sometimes called "blackbody") spectrum with an intensity distribution that depends on temperature. When atomic transitions take place in cooler outer layers of stars, the spectrum can also have absorption or emission lines. Absorption lines occur when atoms absorb photons of light pushing electrons to a higher energy state. Emission lines occur when atoms release photons and the electrons cascade to a lower energy state.
Review Questions
Summary Questions
- What is energy? Describe two different kinds of energy and give examples of each.
- What does it mean to say the energy is "conserved"?
- How are the frequency and wavelength of light related to each other?
- What is a photon?
- Which property of light determine how much energy a photon has?
- What are the seven main parts of the electromagnetic spectrum? For each band (part), give an example of a source of that type of radiation.
- How does the type of light emitted by an object depend on its temperature?
- What is the difference between the brightness of an object (such as a star) and its luminosity?
- How does the total amount of energy emitted differ for hot and cold objects?
- How does spectroscopy give information about an object? What happens when starlight passes through a prism?
- What are the differences between continuous, absorption and emission spectra? What are the similarities between all three?
- Why are the spectral lines for an element sometimes called “chemical fingerprints”?
Activities
- Understanding blackbody radiation. Open the simulation at https://phet.colorado.edu/sims/html/blackbody-spectrum/latest/blackbody-spectrum_en.html.
- The default is set to the temperature of the Sun. Click on the "labels" box to show different parts of the EM spectrum (UV, visible, and infrared). What part of the EM spectrum has the most intense light from the Sun.
- Now set the thermometer to the temperature of the star Sirius. The y-axis now needs to be rescaled to see the value for the peak intensity, Adjust this by using the zoom out button. Once you can see the peak, click on the "Graph Values" box. What is the wavelength of the peak intensity light for Sirius?
- Energy flux. Calculate the solar flux (in W/m2) at the planet Mercury.
Life needs a source of energy to thrive. This energy can come in different forms, from sunlight to energy released when chemicals react. Light is a type of pure energy, and coded into the light and other kinds of radiation that reach us from objects in the universe is a wide range of information about what those objects are like and how they work. If we can decipher this code and read the messages it contains, we can learn an enormous amount about the cosmos without ever having to leave Earth or its immediate environment.
Learning Objectives
By the end of this chapter, you will be able to:
- Understand that there are different types of energy and that energy is conserved
- Explain the wavelength, frequency and energy of a wave or particle of light
- Discuss the different parts of the electromagnetic spectrum
- Explain how and why the light emitted by an object depends on its temperature
- Explain the difference between the luminosity and brightness of an object
- Explain how the total energy emitted differs for hot and cold objects
- Describe how spectroscopy can provide information about an object, such as a star.
- Discuss the difference between continuous, absorption and emission spectra.
Energy
Different types of energy are all around us -- the electrical energy that powers our technology, the chemical energy that is stored in the food we eat, and the heat energy we feel when when walking in sunlight. These different types of energy can be changed, or converted, from one type to another. For example, the chemical energy in food is converted to energy that allows us to think and move around. We will see other examples of energy transformations in astrobiology, such as the gravitational energy that is converted into heat when a giant cloud of gas and dust collapses and eventually forms stars.
The amount of the energy in the universe is always the same and it is continuously being changed from one form into another. This is the essence of the law of conservation of energy. Other quantities in nature, such as mass and momentum, are also conserved.
Though energy cannot be created or destroyed, it can be transformed into different forms. The two main forms of energy are kinetic energy and potential energy. Kinetic energy is the energy of motion. When an object is moving more quickly, it has more energy. A fast-moving car has more energy than a slow moving car. Thermal energy is actually a form of kinetic energy since higher temperature is really a measure of the average speed of atoms and molecules -- the higher the temperature, the greater the kinetic energy of the atoms and molecules.
Potential energy is the energy that is associated with different positions in space. When you throw a ball high into the air, it has more gravitational potential energy than when it is held in your hand. When an object moves from an area of high potential energy to low potential energy, that energy will be transformed into another form. For example, when an apple falls to the Earth, it will speed up gaining kinetic energy. But potential energy does not need to be related just to gravity. For example, the energy stored in chemicals is in the form of chemical potential energy which can be determined based on the position of different atoms bonded to each other by electric forces of attraction.
A more recently discovered form of energy is the energy associated with mass itself. Einstein's famous equation [latex]E=mc^2[/latex] tells us, that mass-energy equivalence is a fundamental feature of the universe. Any object that has mass therefore also contains energy -- this type of energy is called rest-mass energy. Inside the core of stars, nuclear fusion converts some of the rest-mass of two protons into energy. This process occurs an astounding 1038 times every second and is the source of the energy from the Sun that we receive on Earth.
Light
A great deal of the energy that life on Earth uses comes in one way or another from the Sun's light, although geothermal energy from inside the Earth can also be harnessed. Light from the Sun, or any star, is an example of electromagnetic radiation. Here, the words light and radiation are synonymous, and both are a form of energy. Radiation can sometimes be thought of as dangerous and some types are (for example, gamma rays and X rays), but radiation is a neutral term and is synonymous with energy.
One of the more bizarre aspects of light is the way that it acts, specifically the fact that it can behave like a wave and a particle. In the 17th century, the nature of light was debated and both Isaac Newton and Christiaan Huygens tried to explain it. Newton experimented with lenses and prisms and believed that light was a stream of particles, which he called corpuscles. Huygens, on the other hand, believed that light was a wave that traveled outward in all directions from a source, much like the ripples on a pond that expand outward through the water after a stone is dropped into it. Building upon pioneering work by James Clerk Maxwell and Max Planck, Albert Einstein proposed in 1905 that light can indeed behave both ways, thus solidifying the concept of wave-particle duality, one of the tenets of quantum mechanics. The wave and particle nature of light has now been experimentally verified countless times.
Light as a Wave
Light carries energy and information from one place to another, and this energy is carried in the form of electromagnetic (EM) waves. Other familiar types of waves in nature include sound waves and water waves. All three of these types of waves have some differences and some similarities.
Water and sound waves are mechanical waves and require a medium to travel in. For sound waves, the medium is air and the medium is water for water waves. If you screamed on the surface of the Moon, which has no atmosphere, nobody would hear you as the sound waves have no medium to travel through. (The director Stanley Kubrick got it right in the film 2001: A Space Odyssey.) EM waves do not require water or air or any medium to travel though – they can travel through empty space. This was such a disturbing idea to nineteenth-century scientists that they actually made up a substance to fill all of space—one for which there was no evidence—just so light waves could have something to travel through: they called it the aether. Today, we know that there is no aether and that EM waves have no trouble at all moving through empty space (as all the starlight visible on a clear night must surely be doing).
The speed of a sound wave depends on the medium through which it is traveling. A sound wave moves faster through water than it does through air, for example. However, all electromagnetic waves move at the same speed in empty space (the speed of light—approximately 300,000 kilometers per second, or 300,000,000 meters per second, which can also be written as 3×10⁸ m/s), which turns out to be the fastest possible speed in the universe.
Now for some similarities. All waves are a kind of repeating phenomenon. Whether it is the up-and-down motion of a water wave or the changing electric and magnetic fields in a wave of light, the pattern of disturbance repeats in a cyclical way. Thus, any wave motion can be characterized by a series of crests and troughs. Moving from one crest through a trough to the next crest completes one cycle. The horizontal length covered by one cycle is called the wavelength (λ). Ocean waves provide an analogy: the wavelength is the distance that separates successive wave crests. An example of water waves created when a frog leaps into a pond is shown in Figure 1.
We can also characterize different waves by their frequency, which is the number of wave cycles that pass by per second. If you count 10 crests moving by each second, for example, then the frequency is 10 cycles per second (cps). In honor of Heinrich Hertz, the late nineteenth physicist who, inspired by physicist James Clerk Maxwell’s work, discovered radio waves, a cps is also called a hertz (Hz). Take a look at your radio, for example, and you will see the channel assigned to each radio station is characterized by its frequency, usually in units of kHz (kilohertz, or thousands of hertz) or MHz (megahertz, or millions of hertz).
Concept Check: Wavelength and Frequency
Figure 3 is a schematic showing the wavelengths and frequencies for different colors of light. Red light is at the top and its wavelength (λ) is shown as the distance between two peaks, where the peaks are marked by the vertical black lines. Blue light is on the bottom; notice that it has a shorter wavelength than red light (the length between the two peaks is noticeably shorter).
The frequency of a wave is a measure of how many waves pass by in one second. Let's imagine that the amount of time that elapsed for each of the waves in Figure 3 is 1 second. Looking at red light, two full waves can pass by in this 1 second period, so we say the frequency is 2 cycles per second, or 2 Hz. (Actually, a bit more than two red light wave cycles can pass by, about 2.5, but we will say 2 full waves to keep this example simple.)
- Which color of light has the highest frequency? How about the lowest frequency?
- Which color of light has the shortest wavelength?
Show Answer
- Looking at Figure 3, the most crests pass by in one second for blue light (6 Hz) while the fewest pass by for red light. Thus, blue light has the highest frequency and red light has the lowest.
- Since blue light has the highest frequency, it also has the shortest wavelength. It is easy to see in Figure 3 that λ is shortest for blue light.
Wavelength (λ) and frequency (f) are related because all electromagnetic waves travel at the same speed. The formula for this relationship can be expressed as follows: for any wave motion, the speed at which a wave moves equals the frequency times the wavelength. Waves with longer wavelengths have lower frequencies. Mathematically, we can express this as
[latex]c = \lambda f[/latex]
where the Greek letter for “l”—lambda, λ—is used to denote wavelength and c is the scientific symbol for the speed of light.
The electromagnetic wave model of light (as formulated by James Clerk Maxwell) was one of the great triumphs of nineteenth-century science. In 1887, when Heinrich Hertz actually made invisible electromagnetic waves (what today are called radio waves) on one side of a room and detected them on the other side, it ushered in a new era that led to the modern age of telecommunications. His experiment ultimately led to the technologies of television, cell phones, and today’s wireless networks around the globe.
Light as a Photon
By the beginning of the twentieth century, physicists had to reluctantly accept that sometimes light behaves more like a “particle”—or at least a self-contained packet of energy—than a wave. We call such a packet of electromagnetic energy a photon.
A photon carries a specific amount of energy. How much energy a photon has depends on its frequency. We can use the idea of energy to connect the photon and wave models. How much energy a photon has depends on its frequency. A low-energy radio wave has a low frequency, while a high-energy X-ray at your dentist’s office is a high-frequency wave. Among the colors of visible light, violet-light photons have the highest energy and red-light photons have the lowest.
Test whether the connection between photons and waves is clear to you. In the above example, which photon would have the longer wavelength as a wave: the radio wave or the X-ray? If you answered the radio wave, you are correct. Radio waves have a lower frequency, so the wave cycles are longer
The Electromagnetic Spectrum
Objects in the universe send out an enormous range of radiation, or light. Scientists call this range the electromagnetic (EM) spectrum, which are divided into a number of regions. The spectrum is shown in Figure 4, with some information about the waves in each part or band.
Looking at the EM spectrum in Figure 4, we see that:
- Gamma rays have the highest energy and radio waves have the lowest energy
- Radio waves have the longest wavelength and gamma rays have the shortest wavelength
- Radio waves have the highest frequency and gamma rays have the lowest frequency
These properties of light are summarized by the beautifully simple equation that relates the energy of a photon to its frequency (or wavelength), where h is Planck's constant:
[latex]E=hf[/latex]
This relationship shows the wave-particle duality of light, as the energy of photon (a particle of light) is directly related to its frequency (a wave property). Since h has a constant value, you can immediately get the energy of a particular color of light simply by knowing its frequency (or wavelength, which can be expressed as [latex]\lambda = c / f[/latex]).
Another property of light that has already been mentioned but is worth re-emphasizing is that all types of light travel at the speed of light. Since the speed of light is constant, all light travels at the same speed.
Worked Example: Frequency and Wavelength
Red light has a wavelength of about 650 nm and blue light has a wavelength of about 450 nm. Recall that nm is the abbreviation for nanometers.
What is the frequency of red light?
The frequency of any type of light is related to its wavelength as [latex]f = c / \lambda[/latex], where c is the speed of light.
To use this equation, we must be sure that the units are all consistent. If we use 3×10⁸ m/s for the speed of light, then the wavelength must be in units of meters and the frequency will be in units of Hz (where 1 Hz = 1 cycle per second). So, we must first convert the wavelength from nanometers into meters. One nanometer is one-billionth of a meter: 1 nm = 10-9 m so it follows that 650 nm = 650×10-9 m. Expressed in scientific notation, the wavelength of red light is 6.50×10⁻⁷ m.
[latex]f = c / \lambda[/latex] = (3×10⁸ m/s) ⁄ (6.50×10⁻⁷ m) = 461,538,461,538,461 Hz
That's a huge number of cycles in one second! Expressing this in scientific notation, f = 4.62×10¹⁴ Hz.
The wavelength of visible light (like red and blue) is often reported in THz, where T is the prefix one trillion, or 1012.
Extra 1: Show that the frequency can also be expressed as 462 THz.
Show Answer
The frequency 4.62×10¹⁴ Hz can also be written as 4.62×102×1012 Hz
4.62×102 = 462 and 1012 Hz = 1 THZ, so f = 462 THz
Extra 2: Show that the frequency of blue light (with a wavelength of 450 nm) is 666 THz.
Show Answer
[latex]f = c / \lambda[/latex] = (3×10⁸ m/s) ⁄ (4.50×10⁻⁷ m) = 6.66×10¹⁴ Hz = 666 THz
Types of Electromagnetic Radiation
Throughout our study of astrobiology, we will encounter all types of light. When we collect light using a camera or sensor on the Earth's surface, that light must first travel through the Earth's atmosphere before it reaches the ground. Depending on the type of light, some of it may be partially or completely absorbed by molecules in different parts of the Earth's atmosphere. This means that some types of telescopes need to be above the Earth's atmosphere in order to detect any light. Also, we will see that this absorbed light will show up as a kind of set of Earth's chemical fingerprints in any observations that contain the Earth's atmosphere; this is the basic idea behind biosignatures for life, and we will probe it more deeply in the SETI chapters.
The way that light is absorbed in Earth's atmosphere for each part of the EM spectrum is shown in Figure 5.
We highlight a few properties of each type of light that are of relevance to astrobiology, as well as what types of telescopes are used to study the universe in each type of light.
Radio Waves
Radio waves have the longest wavelengths of any type of radiation -- they can range from a few millimeters all they way up to hundreds of kilometers (for reference, Switzerland is about 300 km across). Radio waves have very low energies and are all around us in our everyday lives. On Earth, cell phones, radio and TV transmissions, satellites and radar all emit radio waves and these pass right through our bodies. Radio waves are also produced in nature by a number of astrophysical objects, including stars and pulsars. The most abundant element in the cosmos -- hydrogen -- also naturally emits radio waves at a very specific wavelength of 21 cm (which corresponds to a frequency of 1420 MHz). As we will see later in the chapter on SETI, astronomers search for signals from advanced extraterrestrial civilizations that are close to the 21 cm radiation that hydrogen produces.
Most radio waves reach the ground, as seen by the "radio window" in Figure 5. The lowest frequency radio waves do not make it to the Earth's surface and this region of the EM spectrum remains unexplored. Because radio waves are long, in general the telescopes (in the case of radio astronomy, these are called dishes or antennae) need to be very large. Some of the first radio observations made to look for signs of intelligent life were carried out by Frank Drake in 1960 using the 85-foot Green Bank Telescope. There is another way to work around the large size needed for dishes through a technique called interferometry. Using this technique, a number of small radio dishes can be made to work in concert and achieve the same precision as a larger dish. The Hat Creek Radio Observatory in northern California, for example, has 28 dishes that are each 6 meters and can all point to the same target on the sky and collectively function as a 40 m dish.
Microwaves
Microwaves are also low energy radiation and have sizes that range from about 1 mm up to 300 mm. The most familiar source of microwaves on Earth is probably microwave ovens. Microwaves are used extensively by satellites to monitor weather on the Earth (Doppler radar maps use microwaves) and for remote sensing of the Earth's surface. The ancient radiation left over from the Big Bang also happens to fall into the microwave part of the EM spectrum. This Cosmic Microwave Background (CMB) radiation was discovered serendipitously in 1965 and has a wavelength of 1.9 mm. The CMB is literally everywhere on the sky and will appear as "background noise" in any observations that include this wavelength.
As seen in Figure 5, some microwave radiation makes it to the ground (the telescope used to detect the CMB in 1965 was on the ground in New Jersey, USA) but some parts are also absorbed by the Earth's atmosphere. The COBE, WMAP, and Planck missions all studied the CMB in more detail and were space-based missions.
Infrared
Infrared light is given off by anything with a temperature. This discovery was made in 1800 by the astronomer William Herschel. Herschel studied the rainbow created when white light was sent through a prism and he found that the invisible region beyond the red edge of the rainbow was hotter than the temperature of the rainbow! Herschel called this type of radiation "calorific rays", or heat rays, and today we refer to these heat rays as infrared (IR) light. Our eyes are only sensitive to visible light (some animals, such as vampire bats and goldfish, can see into the infrared), although we can still "see" this type of light by using an IR camera or night vision goggles. These types of sensors pick up differences in infrared intensity. Since most IR light gets absorbed by the Earth's atmosphere, many IR telescopes are in space.
IR light is of great importance in astronomy because it can penetrate, or travel through, dust that is opaque to visible light. This idea is best shown with a comparison of the same picture taken in visible light and infrared light. Figure 7 shows pictures of the Carina Nebula taken by the Hubble Space Telescope (HST) in visible light (left) and infrared light (right). You can see an enormous amount of stars and other objects in the infrared that are not seen in the visible, as infrared light travels right through the dust while visible light is absorbed by the dust.
The James Webb Space Telescope (JWST), which launched in 2021 and has a mirror 2.7 times larger than the HST (meaning it can collect over 7 times as much light), detects IR light. IR light covers the range of about 1-1000 micrometers, where micrometers are abbreviated as μm and are often referred to as microns; for reference, E. Coli bacteria are 2 microns and a human hair is 100 microns. JWST can sense wavelengths in the range of 0.6-28 microns. One of the main goals of JWST is to study planetary systems and the origin of life. One way JWST is doing this is by studying the atmospheres of exoplanets to see if any molecules needed for life, as we know it, are present. This will be discussed in more detail in the chapters on exoplanets.
Visible Light
Human eyes evolved to detect wavelengths spanning the visible part of the EM spectrum, which covers 400 nm to 750 nm. Stars emit visible light and life on Earth would not exist without the light from the Sun. Microscopes and optical telescopes both take visible light and focus it into an image -- the study of visible light is essential to astrobiology. For example, detailed pictures of the surface of Mars that show evidence for past liquid water are taken with visible cameras like Mastcam-Z on the Perseverance rover.
Visible light is not absorbed by the Earth's atmosphere but it does get distorted as it passes through, thus causing images to become blurry. Stars as viewed from the Earth's surface appear to twinkle for this reason. However, optical (visible) telescopes on the Earth's surface can use techniques such as adaptive optics to correct for the atmospheric distortion of visible light. The Hubble Space Telescope does not need to worry about this when it collects visible light.
Some searches for intelligent extraterrestrial life in the universe are carried out using optical telescopes; these searches typically scan the sky and look for anomalous pulses, perhaps from lasers being used by a distant civilization.
Ultraviolet
Ultraviolet (UV) light has a shorter wavelength than visible light and ranges from about 10-400 nm. Stars hotter than the Sun emit primarily UV light but the Sun emits some UV light, too. This is probably most apparent when you are outside on a sunny day and forgot to bring some sunblock -- your skin will absorb some of the UV (specifically, UVA) light. The fact that stars emit UV radiation is important for many aspects of life, in addition to protecting your skin. UV light can actually break the bonds between the hydrogen and oxygen atoms in a water molecule in a process called photolysis and this can create ozone in the atmosphere, which in turn protects life from dangerous radiation that can damage cells.
UV light is emitted from a range of astrophysical sources, including sites of star formation and planetary aurorae. As seen in Figure 5, nearly all UV radiation is absorbed by the Earth's atmosphere so UV telescopes are almost always in space, although some telescopes on high mountain tops, like the Keck telescopes atop Mauna Kea in Hawaii, have UV instruments. NASA's SWIFT satellite is actively studying the universe in UV light, and the Hubble Space Telescope has been probing a wide range of UV sources since 1990.
X Rays
X rays are a high energy type of radiation, with short wavelengths of just 0.01-10 nm, and they can be absorbed by tissue and bones in our bodies. They can destroy DNA so great care is taken when X ray machines are used to take medical images. Fortunately for life, X rays are absorbed by the Earth's atmosphere so they are not a concern on Earth's surface (but are a great concern for astronauts traveling above the Earth's atmosphere).
X rays are generated by high energy astrophysical phenomena such as supernova as well as the Sun's corona. During a total solar eclipse, the very hot gas in the Sun's corona can be seen. The composition of soil on Mars is studied using X ray instruments on Martian rovers, such as Spirit and Opportunity and the active Perseverance mission.
Gamma Rays
Gamma rays are the most energetic type of radiation in the cosmos and have wavelengths on the order of the size of the nucleus inside an atom. On Earth, gamma rays are produced naturally by lightning and radioactivity. Gamma rays are also created when two neutron stars merge, in addition to the gravitational waves that these events create. Gamma rays produced in neutron star mergers produce many of the heavy elements on the periodic table, such as gold and platinum.
Gamma rays do not make it to the Earth's surface so gamma ray observatories need to be in space. The Fermi Space Telescope has been studying gamma rays on the sky since 2008 and has created a complete map of the sky in gamma rays. The surface composition of a planet can be studied using gamma ray instruments -- the MESSENGER mission to Mercury carried a gamma ray spectrometer.
Multiple Wavebands
To fully understand an object, we ideally want to look at in every type of light that it emits. For many object, this can include all types of radiation, from radio waves to gamma ray. An example of this is shown in Figure 8 for the Crab Nebula:
Understanding Radiation
Some astronomical objects emit mostly infrared radiation, others mostly visible light, and still others mostly ultraviolet radiation. What determines the type of electromagnetic radiation emitted by the Sun, stars, and other dense astronomical objects? The answer often turns out to be their temperature.
At the microscopic level, everything in nature is in motion. A solid is composed of molecules and atoms in continuous vibration: they move back and forth in place, but their motion is much too small for our eyes to make out. A gas consists of atoms or molecules that are flying about freely at high speed, continually bumping into one another and bombarding the surrounding matter. The hotter the solid or gas, the faster the motion of its atoms or molecules. The temperature of something is thus a measure of the average motion energy of the particles that make it up.
This motion at the microscopic level is responsible for much of the EM radiation on Earth and in the universe. As atoms and molecules move about and collide, or vibrate in place, their electrons give off EM radiation. The characteristics of this radiation are determined by the temperature of those atoms and molecules. In a hot material, for example, the individual particles vibrate in place or move rapidly from collisions, so the emitted waves are, on average, more energetic. And recall that higher energy waves have a higher frequency. In cooler materials, the particles have lower energy atomic and molecular motions and thus generate lower energy waves.
Blackbody Radiation and Wien's Law
To further understand the relationship between temperature and light (EM radiation), we consider a type of ideal object called a blackbody. A blackbody absorbs all light that hits it; none of the incoming light is reflected away or passes through the object. The object heats up and gains energy; the object then loses this energy by emitting light at all wavelengths (recall that light is a type of energy). In other words, the object cools off until it reaches the same temperature as its surroundings -- this is called thermodynamic equilibrium -- and it does this by converting the energy it absorbed into energy of motion that is radiated in a specific way (this radiated energy is called thermal or blackbody radiation). A glowing ember of coal cools by radiating energy until it reaches the same temperature as its environment.
Any dense, solid object that has a temperature emits blackbody radiation; this includes people, animals, stove tops, light bulbs, stars and planets. For example, the Earth absorbs EM radiation from the Sun, heats up, and then emits radiation as mostly infrared light. Note that any objects that reflect light, such as a book with a red cover, are not blackbodies. Similarly, if light passes through the object, as with a glass table, it is also not a blackbody. In that respect, the Earth is not a perfect blackbody, since clouds and other particulate matter do reflect some sunlight.
No object in nature is a perfect blackbody but many opaque objects behave like a blackbody so it is a very good approximation and we can use some fairly simple math to learn more about the object. As mentioned above, blackbody radiation is not emitted at just one wavelength or one part of the EM spectrum, but covers all wavelengths. At first this may sound strange -- since humans act like blackbodies, does that mean that our bodies emit dangerous X rays and gamma rays? No, that is not the case (I don't have X ray eyes) and any blackbody emits the most intense radiation at one particular wavelength. Humans have a typical temperature of 98.6°F (or 310 K) and emit the most intense radiation at 9.3 microns (an infrared wavelength, meaning we radiate heat!). The peak wavelength of the radiation that a blackbody gives off depends only on its temperature. This means two very different objects with the same temperature emit identically with the same wavelength of peak intensity. The Earth is just a little bit cooler than a human at 288 K, and its most intense radiation is at 10.1 microns. This relationship between the temperature of a blackbody and its peak wavelength is called Wien's Law and is:
[latex]\lambda_{\rm max} = \frac{ 0.0029 }{T} \rm{~m ~K}[/latex]
where the wavelength is in meters and the temperature is in K (the constant 0.0029 has units of m × K). You can easily verify λmax for a human at 310 K: (0.0029 m K)/(310 K) = 9.3×10⁻⁶ m = 9.3 microns.
The thermal radiation emitted by any blackbody shows a similar shape in the intensity of light at different wavelengths. These shapes are called blackbody curves or thermal energy curves. Figure 9 shows this general shape for blackbody curves for objects of different temperatures. The shape is similar for all temperatures but notice that the intensity for each blackbody curve peaks at a different maximum wavelength.
Notice in Figure 9 that the curves show that, at each temperature, the blackbody objects emit radiation at all wavelengths (all colors) but that the most energy is emitted at a peak wavelength. Physically, this peak corresponds to the average speed of atoms or molecules inside the object, which is a manifestation of its temperature.
The hotter the object, the shorter the peak wavelength -- the object at 5500 K has a shorter λmax (530 nm) than the object at 2500 K (which has λmax of 1160 nm and is in the infrared portion of the EM spectrum). It makes sense, then, that hot objects give off a larger fraction of their energy at shorter wavelengths (higher energies) than do cool objects. You may have observed examples of this rule in everyday life. When a burner on an electric stove is turned on low, it emits only heat, which is infrared radiation, but does not glow with visible light. If the burner is set to a higher temperature, it starts to glow a dull red. At a still-higher setting, it glows a brighter orange-red (shorter wavelength). At even higher temperatures, which cannot be reached with ordinary stoves, metal can appear brilliant yellow or even blue-white.
We can use these ideas to come up with a thermometer for measuring the temperatures of stars. Because many stars give off most of their energy in visible light, the color of light that dominates a star’s appearance is an indicator of its temperature. If one star looks red and another looks blue, which one has the higher temperature? Because blue is the shorter-wavelength color, it is the sign of a hotter star. (Note that the temperatures we associate with different colors in science are not the same as the ones artists use. In art, red is often called a “hot” color and blue a “cool” color. Likewise, we commonly see red on faucet or air conditioning controls to indicate hot temperatures and blue to indicate cold temperatures. Although these are common uses to us in daily life, in nature, it’s the other way around.)
What about the Sun? The Sun has a surface temperature of 5800 K so Wien's law immediately tells us that λmax is 500 nm. Which corresponds to green light. But the Sun doesn't look green, it looks yellow or white! What's going on?! This makes sense when you consider that the Sun is also emitting red light and blue light; these all mix together as a nearly white color. Pure purple stars are also never seen for similar reasons -- the blue and violet mix into a more deep blue color.
C0lor Temperature
Different wavelengths (or frequencies) of light correspond to different colors. But what exactly is color? Is it a property of an object, like its size, or is it something that our brains perceive? Our eyes receive light, which is sent to the brain for processing. When we look at an object, we are seeing the light that is reflected off that object. If there is no light in the room, then we do not see anything at all. When light strikes an object, some of the light is reflected and some of it is absorbed. Human eyes have evolved to see visible light; some other animals, such as birds, can see ultraviolet light! Photoreceptors called cones in the retina of our eyes are sensitive to red, blue, and green light. In that sense, every color can be broken down into a combination of red, blue, and green. This is why television only needs those three colors to accurately simulate reality. In low light conditions, rods in the retina take over and are only sensitive to one color; hence, we see shades of gray.
The Sun emits white light, which contains all colors. As an example, let’s consider what happens when sunlight strikes a house painted red. The white light hits the red house, and only red light is reflected to our eyes; all of the other colors are absorbed by the paint molecules. Pigments are substances that selectively absorb very specific wavelengths of light, leaving only the desired wavelength of light reflected.
How does the color emitted by an object relate to its temperature? Wien’s law gives a mathematical relationship for this and shows that the temperature of a blackbody is inversely proportional to the wavelength of the light emitted. As a more visual example, consider a piece of metal being heated up. First it will turn a dull red color, then orange to white, and eventually it becomes blue when it is hottest. The scale is shown in Figure 10, where the temperatures are in Kelvin.
Light bulbs are designed with color temperature in mind. This is likely a familiar concept to photographers when selecting back lighting for a shoot. For a "candlelight" type background, a bulb of around 2000 K will be best, while a "natural daylight" background is best achieved with a bulb at 4500 K. Most fluorescent light bulbs in classrooms are around 5000 K while those in a library will be closer to 3000 K.
Luminosity and Brightness
Wien's Law shows that blackbodies, like stars, emit the most intense radiation at a specific wavelength, λmax. What exactly is this intensity a measure of?
Luminosity is the total amount of energy that an object (like a star) puts out each second. It has dimensional units of energy per second. In the same way that a 100 W bulb will always put out 100 Watts whether we are standing close or farther away, the luminosity of a star does not depend on our distance from it.
However, astronomers do not measure luminosity directly with a telescope; they measure brightness: the luminosity that is intercepted by a detector such as a photographic plate or a digital camera. If you imagine a spherical surface - a bubble - around a star, then the luminosity is the integrated (total) light from the surface of that bubble. The brightness, which is the luminosity per unit area, decreases as the surface area of the spherical volume increases. This is the same phenomenon that happens with expanding balloons. The balloon has a certain amount of material, usually latex or rubber. Analogous to luminosity, that amount of material is constant, no matter how much air is in the balloon. However, as the balloon expands, that constant amount of material is stretched over a larger surface area. The walls of the balloon get thinner and the amount of material per unit area decreases. The luminosity of a star is constant. The brightness that we measure depends on whether we are "up close" or far away from the star.
This is shown in Figure 11, where the light from a star with luminosity L spreads out into spheres of increasing surface area as it travels away from the star. At a distance d from the star, we can measure the brightness ($B$) by dividing the total power emitted by the star (L) by the surface area of the sphere that the light has now spread into:
[latex]$B = \frac{L}{4 \pi d^2}$[/latex]
This idea—that the apparent brightness of a source (how bright it looks to us) gets weaker with distance in the way we have described—is shown in Figure 11 below. At point 1, the light is concentrated into one box. By the time the light reaches point 2, which is twice as far as point 1, it is now spread out into four squares.
Concept Check: Brightness and distances of stars
You observe two stars, named Sol-2 and Sol-3, that have the exact same luminosity as the Sun (this means they have the same temperature, radius, and luminosity as the Sun). You measure the brightness of both stars with the same instrument and find that the light from Sol-2 is twenty-five times brighter than the light from Sol-3. Which star is closer to the Earth and by how much? Explain your reasoning.
Show Answer
Ans: Sol-2 is five times closer than Sol-3. Brightness drops as the distance squared, so the ratio of the distances to Sol-2 and Sol-3 is given by [latex]\sqrt{B_{Sol2}/B_{Sol3}}[/latex] or [latex]\sqrt{25}[/latex] = 5.
Let's consider the luminosity of the Sun and the amount of energy from the Sun that reaches the Earth. This will be important to know when we study exoplanets and want to know how much light from the host star reaches the exoplanet. The luminosity of the Sun is 3.9×1026 W -- in other words, it emits the same amount of power as 3.9×1024 100 W light bulbs (or 39 trillion trillion 100 W bulbs!). As the light travels away from the Sun, it is spread out more and more, as all of that light needs to cover spheres (bubbles) that have greater surface area. The distance from the Earth to the Sun is 151 million km, or 1.51×10¹¹ m. Putting this value into the brightness equation, we find that we receive 1360 W/m2 of sunlight on the Earth. That means every 1 m2 patch on the Earth, which is about the size of a standard chess board, receives 1360 Joules of energy every second. Venus is closer to the Sun than the Earth and receives more energy for every square meter, 2600 W/m2, while Mars is further and receives only 600 W/m2.
Worked Example: Calculating the energy received from the Sun
How much radiation from the Sun is received at Saturn's moon Titan? You can assume that Titan and Saturn are at the same distance from Earth.
We can find the value by using the relationship for brightness, luminosity and distance:
[latex]$B = \frac{L}{4 \pi d^2}$[/latex]
Here, L is the luminosity of the Sun and d is the distance of Titan from the Sun. The distance from the Sun to Titan (Saturn) is 1.45 billion km (or 1.45×10¹² m).
B = (3.9×1026 W)/(4 π (1.45×10¹² m)2) = 14.8 W/m2
This makes sense -- Saturn is almost 10 times further from the Sun than the Earth (Earth is 1 AU and Saturn is 9.57 AU), so the value should be significantly lower than Earth's. [In fact, you could also find this value by taking the ratio (1/9.57)2 and multiplying by 1360 W/m2]
Show mathematically that the Earth receives 1360 W/m2 from the Sun.
Show Answer
The only difference here is the distance: now it is the distance from the Earth to the Sun, which is 151 million km.
B = (3.9×1026 W)/(4 π (1.51×10¹¹ m)2) = 1361 W/m2
Spectroscopy
Light from objects is filled with information. By taking the light from an object and splitting it apart into a spectrum, we can decode this light. Spectroscopy is a fundamental tool for astrobiology and allows us to detect exoplanets and study the chemical makeup of their atmospheres.
The most familiar example of spectroscopy is the rainbow of colors that is produced when white light is sent through a prism, as seen in Figure 1. A water droplet can also split up (or disperse) light and create a rainbow when a light beam passes through it. Both prisms and water droplets can serve as spectrometers or spectrographs -- tools used to disperse light into a spectrum.
Stars emit all types of electromagnetic radiation but emit the most intense light at a specific wavelength (see Wien's Law). Note that infrared and ultraviolet light are also emitted by the Sun and are split out as seen in Figure 1 -- our eyes just can't perceive these types of radiation. The distribution of colors, which is naturally organized by wavelength (or frequency), is called a spectrum. There are three main types of spectra: continuous, absorption, and emission as shown in Figure 2. If the shape of the spectrum on the bottom left of Figure 2 looks familiar, it is because you have seen it before when learning about blackbody (thermal) radiation curves.
A continuous spectrum looks like the rainbow shown in Figure 1. However, sunlight that reaches the Earth actually is an absorption spectrum, not a continuous spectrum. Why? The Sun does emit a continuous spectrum from its core but some of that light is absorbed by different atoms as it passes through the Sun's atmosphere. This is shown in Figure 2. On the left, the Sun emits a continuous spectrum at its surface. But that light passes through the atmosphere (the cloud of gas in the middle) and some of that light is absorbed by atoms in the gas. The spectrum on the right is the type of spectrum seen for the Sun, where the dark lines correspond to the wavelengths associated with the atoms or molecules that absorbed the light. Figure 3 shows an absorption spectrum for the Sun, with some of the atoms and molecules present in the Sun's atmosphere labeled. This spectrum was taken from the Earth's surface, so the O2 (molecular oxygen) lines are from Earth's atmosphere.
What does it mean to say "the wavelengths associated with the atoms"? Every element on the periodic table has a different number of protons and thus a different structure. Hydrogen is the simplest atom, with just one proton and one electron orbiting the proton in a neutral atom. To get the electron out of the hydrogen atom entirely requires a certain amount of energy. If there is no energy supplied to the atom, it is stable and the electron is in what we call the ground state of energy. However, the electron can move to different energy levels above the ground state -- imagine rungs on a ladder, with the ground state at the bottom and the top rung being the amount of energy needed to kick the electron out of the atom. Hydrogen has a unique set of energy levels and each level has an exact amount of energy. And recall that this energy has an exact frequency or wavelength given by [latex]E=hf = h c/\lambda[/latex]. When light particles (photons) with exactly one of those wavelengths encounters the atom, it is absorbed. And every element has a different set of energy levels, meaning a distinct set of its own characteristic wavelengths. We thus have a very powerful way of learning which elements are inside a star's atmosphere.
Using the unique pattern of an element to identify whether it is inside of an atmosphere is similar to DNA barcoding used in forensics to identify a match to evidence at a crime scene. Figure 4 shows an example of some of the colors (wavelengths) for a few different elements. No two are the same and we can use these patterns to identify an element in a star or planet's atmosphere. This same technique is used extensively in biochemistry and many other scientific fields. We can think of the unique emission lines associated with an atom or molecule as its chemical fingerprint.
The middle part of Figure 2 shows the physical idea of how an emission spectrum is created. Let's say you have a gas made from atoms of just one type of element. If you heat up that gas, the electrons can move up to higher energy levels and then drop back down, emitting light in the process. This is almost the same situation as the absorption spectrum on the left except we are not looking at the continuous source and the gas but instead just at the gas...so there is no continuous spectrum in the background, just the bright lines that correspond to whatever element is in the gas. The atom is emitting energy at the unique set of wavelengths (colors) for that particular element. Of course, the gas can contain many different atoms and molecules at the same time.
You can take a look at the fingerprints for some other elements using the simulation below. Click on any element to see its unique set of spectral lines. Notice that you can choose to see both absorption (top) and emission (bottom) spectra.
Key Concepts and Summary
The energy of light is our messenger about the universe. Different colors of light are simply different wavelengths and different wavelengths of light contain different amounts of energy. The longest wavelengths in the electromagnetic spectrum are radio waves and these have the lowest energy. The shortest wavelengths are high energy gamma rays. Unsurprisingly, the visible band of light (where our brain interprets different wavelengths as different colors) matches the key energy output of the Sun - we evolved to optimally navigate this range of energies. By observing the universe with detectors that are sensitive to different energies of light, we can learn about the energy output and the peak temperatures of the objects we detect. Because the brightness of a star or other celestial object decreases with distance, a measurement of distance is needed to back out luminosity (energy per second). The wavelengths of light encode the energy and chemical composition of stars and other celestial bodies - astronomers use spectrographs to disperse light collected at a telescope into a spectrum. Objects emit a continuous (sometimes called "blackbody") spectrum with an intensity distribution that depends on temperature. When atomic transitions take place in cooler outer layers of stars, the spectrum can also have absorption or emission lines. Absorption lines occur when atoms absorb photons of light pushing electrons to a higher energy state. Emission lines occur when atoms release photons and the electrons cascade to a lower energy state.
Review Questions
Summary Questions
- What is energy? Describe two different kinds of energy and give examples of each.
- What does it mean to say the energy is "conserved"?
- How are the frequency and wavelength of light related to each other?
- What is a photon?
- Which property of light determine how much energy a photon has?
- What are the seven main parts of the electromagnetic spectrum? For each band (part), give an example of a source of that type of radiation.
- How does the type of light emitted by an object depend on its temperature?
- What is the difference between the brightness of an object (such as a star) and its luminosity?
- How does the total amount of energy emitted differ for hot and cold objects?
- How does spectroscopy give information about an object? What happens when starlight passes through a prism?
- What are the differences between continuous, absorption and emission spectra? What are the similarities between all three?
- Why are the spectral lines for an element sometimes called “chemical fingerprints”?
Activities
- Understanding blackbody radiation. Open the simulation at https://phet.colorado.edu/sims/html/blackbody-spectrum/latest/blackbody-spectrum_en.html.
- The default is set to the temperature of the Sun. Click on the "labels" box to show different parts of the EM spectrum (UV, visible, and infrared). What part of the EM spectrum has the most intense light from the Sun.
- Now set the thermometer to the temperature of the star Sirius. The y-axis now needs to be rescaled to see the value for the peak intensity, Adjust this by using the zoom out button. Once you can see the peak, click on the "Graph Values" box. What is the wavelength of the peak intensity light for Sirius?
- Energy flux. Calculate the solar flux (in W/m2) at the planet Mercury.
Life needs a source of energy to thrive. This energy can come in different forms, from sunlight to energy released when chemicals react. Light is a type of pure energy, and coded into the light and other kinds of radiation that reach us from objects in the universe is a wide range of information about what those objects are like and how they work. If we can decipher this code and read the messages it contains, we can learn an enormous amount about the cosmos without ever having to leave Earth or its immediate environment.
Learning Objectives
By the end of this chapter, you will be able to:
- Understand that there are different types of energy and that energy is conserved
- Explain the wavelength, frequency and energy of a wave or particle of light
- Discuss the different parts of the electromagnetic spectrum
- Explain how and why the light emitted by an object depends on its temperature
- Explain the difference between the luminosity and brightness of an object
- Explain how the total energy emitted differs for hot and cold objects
- Describe how spectroscopy can provide information about an object, such as a star.
- Discuss the difference between continuous, absorption and emission spectra.
Energy
Different types of energy are all around us -- the electrical energy that powers our technology, the chemical energy that is stored in the food we eat, and the heat energy we feel when when walking in sunlight. These different types of energy can be changed, or converted, from one type to another. For example, the chemical energy in food is converted to energy that allows us to think and move around. We will see other examples of energy transformations in astrobiology, such as the gravitational energy that is converted into heat when a giant cloud of gas and dust collapses and eventually forms stars.
The amount of the energy in the universe is always the same and it is continuously being changed from one form into another. This is the essence of the law of conservation of energy. Other quantities in nature, such as mass and momentum, are also conserved.
Though energy cannot be created or destroyed, it can be transformed into different forms. The two main forms of energy are kinetic energy and potential energy. Kinetic energy is the energy of motion. When an object is moving more quickly, it has more energy. A fast-moving car has more energy than a slow moving car. Thermal energy is actually a form of kinetic energy since higher temperature is really a measure of the average speed of atoms and molecules -- the higher the temperature, the greater the kinetic energy of the atoms and molecules.
Potential energy is the energy that is associated with different positions in space. When you throw a ball high into the air, it has more gravitational potential energy than when it is held in your hand. When an object moves from an area of high potential energy to low potential energy, that energy will be transformed into another form. For example, when an apple falls to the Earth, it will speed up gaining kinetic energy. But potential energy does not need to be related just to gravity. For example, the energy stored in chemicals is in the form of chemical potential energy which can be determined based on the position of different atoms bonded to each other by electric forces of attraction.
A more recently discovered form of energy is the energy associated with mass itself. Einstein's famous equation [latex]E=mc^2[/latex] tells us, that mass-energy equivalence is a fundamental feature of the universe. Any object that has mass therefore also contains energy -- this type of energy is called rest-mass energy. Inside the core of stars, nuclear fusion converts some of the rest-mass of two protons into energy. This process occurs an astounding 1038 times every second and is the source of the energy from the Sun that we receive on Earth.
Light
A great deal of the energy that life on Earth uses comes in one way or another from the Sun's light, although geothermal energy from inside the Earth can also be harnessed. Light from the Sun, or any star, is an example of electromagnetic radiation. Here, the words light and radiation are synonymous, and both are a form of energy. Radiation can sometimes be thought of as dangerous and some types are (for example, gamma rays and X rays), but radiation is a neutral term and is synonymous with energy.
One of the more bizarre aspects of light is the way that it acts, specifically the fact that it can behave like a wave and a particle. In the 17th century, the nature of light was debated and both Isaac Newton and Christiaan Huygens tried to explain it. Newton experimented with lenses and prisms and believed that light was a stream of particles, which he called corpuscles. Huygens, on the other hand, believed that light was a wave that traveled outward in all directions from a source, much like the ripples on a pond that expand outward through the water after a stone is dropped into it. Building upon pioneering work by James Clerk Maxwell and Max Planck, Albert Einstein proposed in 1905 that light can indeed behave both ways, thus solidifying the concept of wave-particle duality, one of the tenets of quantum mechanics. The wave and particle nature of light has now been experimentally verified countless times.
Light as a Wave
Light carries energy and information from one place to another, and this energy is carried in the form of electromagnetic (EM) waves. Other familiar types of waves in nature include sound waves and water waves. All three of these types of waves have some differences and some similarities.
Water and sound waves are mechanical waves and require a medium to travel in. For sound waves, the medium is air and the medium is water for water waves. If you screamed on the surface of the Moon, which has no atmosphere, nobody would hear you as the sound waves have no medium to travel through. (The director Stanley Kubrick got it right in the film 2001: A Space Odyssey.) EM waves do not require water or air or any medium to travel though – they can travel through empty space. This was such a disturbing idea to nineteenth-century scientists that they actually made up a substance to fill all of space—one for which there was no evidence—just so light waves could have something to travel through: they called it the aether. Today, we know that there is no aether and that EM waves have no trouble at all moving through empty space (as all the starlight visible on a clear night must surely be doing).
The speed of a sound wave depends on the medium through which it is traveling. A sound wave moves faster through water than it does through air, for example. However, all electromagnetic waves move at the same speed in empty space (the speed of light—approximately 300,000 kilometers per second, or 300,000,000 meters per second, which can also be written as 3×10⁸ m/s), which turns out to be the fastest possible speed in the universe.
Now for some similarities. All waves are a kind of repeating phenomenon. Whether it is the up-and-down motion of a water wave or the changing electric and magnetic fields in a wave of light, the pattern of disturbance repeats in a cyclical way. Thus, any wave motion can be characterized by a series of crests and troughs. Moving from one crest through a trough to the next crest completes one cycle. The horizontal length covered by one cycle is called the wavelength (λ). Ocean waves provide an analogy: the wavelength is the distance that separates successive wave crests. An example of water waves created when a frog leaps into a pond is shown in Figure 1.
We can also characterize different waves by their frequency, which is the number of wave cycles that pass by per second. If you count 10 crests moving by each second, for example, then the frequency is 10 cycles per second (cps). In honor of Heinrich Hertz, the late nineteenth physicist who, inspired by physicist James Clerk Maxwell’s work, discovered radio waves, a cps is also called a hertz (Hz). Take a look at your radio, for example, and you will see the channel assigned to each radio station is characterized by its frequency, usually in units of kHz (kilohertz, or thousands of hertz) or MHz (megahertz, or millions of hertz).
Concept Check: Wavelength and Frequency
Figure 3 is a schematic showing the wavelengths and frequencies for different colors of light. Red light is at the top and its wavelength (λ) is shown as the distance between two peaks, where the peaks are marked by the vertical black lines. Blue light is on the bottom; notice that it has a shorter wavelength than red light (the length between the two peaks is noticeably shorter).
The frequency of a wave is a measure of how many waves pass by in one second. Let's imagine that the amount of time that elapsed for each of the waves in Figure 3 is 1 second. Looking at red light, two full waves can pass by in this 1 second period, so we say the frequency is 2 cycles per second, or 2 Hz. (Actually, a bit more than two red light wave cycles can pass by, about 2.5, but we will say 2 full waves to keep this example simple.)
- Which color of light has the highest frequency? How about the lowest frequency?
- Which color of light has the shortest wavelength?
Show Answer
- Looking at Figure 3, the most crests pass by in one second for blue light (6 Hz) while the fewest pass by for red light. Thus, blue light has the highest frequency and red light has the lowest.
- Since blue light has the highest frequency, it also has the shortest wavelength. It is easy to see in Figure 3 that λ is shortest for blue light.
Wavelength (λ) and frequency (f) are related because all electromagnetic waves travel at the same speed. The formula for this relationship can be expressed as follows: for any wave motion, the speed at which a wave moves equals the frequency times the wavelength. Waves with longer wavelengths have lower frequencies. Mathematically, we can express this as
$$c = \lambda f$$
where the Greek letter for “l”—lambda, λ—is used to denote wavelength and c is the scientific symbol for the speed of light.
The electromagnetic wave model of light (as formulated by James Clerk Maxwell) was one of the great triumphs of nineteenth-century science. In 1887, when Heinrich Hertz actually made invisible electromagnetic waves (what today are called radio waves) on one side of a room and detected them on the other side, it ushered in a new era that led to the modern age of telecommunications. His experiment ultimately led to the technologies of television, cell phones, and today’s wireless networks around the globe.
Light as a Photon
By the beginning of the twentieth century, physicists had to reluctantly accept that sometimes light behaves more like a “particle”—or at least a self-contained packet of energy—than a wave. We call such a packet of electromagnetic energy a photon.
A photon carries a specific amount of energy. How much energy a photon has depends on its frequency. We can use the idea of energy to connect the photon and wave models. How much energy a photon has depends on its frequency. A low-energy radio wave has a low frequency, while a high-energy X-ray at your dentist’s office is a high-frequency wave. Among the colors of visible light, violet-light photons have the highest energy and red-light photons have the lowest.
Test whether the connection between photons and waves is clear to you. In the above example, which photon would have the longer wavelength as a wave: the radio wave or the X-ray? If you answered the radio wave, you are correct. Radio waves have a lower frequency, so the wave cycles are longer
The Electromagnetic Spectrum
Objects in the universe send out an enormous range of radiation, or light. Scientists call this range the electromagnetic (EM) spectrum, which are divided into a number of regions. The spectrum is shown in Figure 4, with some information about the waves in each part or band.
Looking at the EM spectrum in Figure 4, we see that:
- Gamma rays have the highest energy and radio waves have the lowest energy
- Radio waves have the longest wavelength and gamma rays have the shortest wavelength
- Radio waves have the highest frequency and gamma rays have the lowest frequency
These properties of light are summarized by the beautifully simple equation that relates the energy of a photon to its frequency (or wavelength), where h is Planck's constant:
[latex]E=hf[/latex]
This relationship shows the wave-particle duality of light, as the energy of photon (a particle of light) is directly related to its frequency (a wave property). Since h has a constant value, you can immediately get the energy of a particular color of light simply by knowing its frequency (or wavelength, which can be expressed as [latex]\lambda = c / f[/latex]).
Another property of light that has already been mentioned but is worth re-emphasizing is that all types of light travel at the speed of light. Since the speed of light is constant, all light travels at the same speed.
Worked Example: Frequency and Wavelength
Red light has a wavelength of about 650 nm and blue light has a wavelength of about 450 nm. Recall that nm is the abbreviation for nanometers.
What is the frequency of red light?
The frequency of any type of light is related to its wavelength as [latex]f = c / \lambda[/latex], where c is the speed of light.
To use this equation, we must be sure that the units are all consistent. If we use 3×10⁸ m/s for the speed of light, then the wavelength must be in units of meters and the frequency will be in units of Hz (where 1 Hz = 1 cycle per second). So, we must first convert the wavelength from nanometers into meters. One nanometer is one-billionth of a meter: 1 nm = 10-9 m so it follows that 650 nm = 650×10-9 m. Expressed in scientific notation, the wavelength of red light is 6.50×10⁻⁷ m.
[latex]f = c / \lambda[/latex] = (3×10⁸ m/s) ⁄ (6.50×10⁻⁷ m) = 461,538,461,538,461 Hz
That's a huge number of cycles in one second! Expressing this in scientific notation, f = 4.62×10¹⁴ Hz.
The wavelength of visible light (like red and blue) is often reported in THz, where T is the prefix one trillion, or 1012.
Extra 1: Show that the frequency can also be expressed as 462 THz.
Show Answer
The frequency 4.62×10¹⁴ Hz can also be written as 4.62×102×1012 Hz
4.62×102 = 462 and 1012 Hz = 1 THZ, so f = 462 THz
Extra 2: Show that the frequency of blue light (with a wavelength of 450 nm) is 666 THz.
Show Answer
[latex]f = c / \lambda[/latex] = (3×10⁸ m/s) ⁄ (4.50×10⁻⁷ m) = 6.66×10¹⁴ Hz = 666 THz
Types of Electromagnetic Radiation
Throughout our study of astrobiology, we will encounter all types of light. When we collect light using a camera or sensor on the Earth's surface, that light must first travel through the Earth's atmosphere before it reaches the ground. Depending on the type of light, some of it may be partially or completely absorbed by molecules in different parts of the Earth's atmosphere. This means that some types of telescopes need to be above the Earth's atmosphere in order to detect any light. Also, we will see that this absorbed light will show up as a kind of set of Earth's chemical fingerprints in any observations that contain the Earth's atmosphere; this is the basic idea behind biosignatures for life, and we will probe it more deeply in the SETI chapters.
The way that light is absorbed in Earth's atmosphere for each part of the EM spectrum is shown in Figure 5.
We highlight a few properties of each type of light that are of relevance to astrobiology, as well as what types of telescopes are used to study the universe in each type of light.
Radio Waves
Radio waves have the longest wavelengths of any type of radiation -- they can range from a few millimeters all they way up to hundreds of kilometers (for reference, Switzerland is about 300 km across). Radio waves have very low energies and are all around us in our everyday lives. On Earth, cell phones, radio and TV transmissions, satellites and radar all emit radio waves and these pass right through our bodies. Radio waves are also produced in nature by a number of astrophysical objects, including stars and pulsars. The most abundant element in the cosmos -- hydrogen -- also naturally emits radio waves at a very specific wavelength of 21 cm (which corresponds to a frequency of 1420 MHz). As we will see later in the chapter on SETI, astronomers search for signals from advanced extraterrestrial civilizations that are close to the 21 cm radiation that hydrogen produces.
Most radio waves reach the ground, as seen by the "radio window" in Figure 5. The lowest frequency radio waves do not make it to the Earth's surface and this region of the EM spectrum remains unexplored. Because radio waves are long, in general the telescopes (in the case of radio astronomy, these are called dishes or antennae) need to be very large. Some of the first radio observations made to look for signs of intelligent life were carried out by Frank Drake in 1960 using the 85-foot Green Bank Telescope. There is another way to work around the large size needed for dishes through a technique called interferometry. Using this technique, a number of small radio dishes can be made to work in concert and achieve the same precision as a larger dish. The Hat Creek Radio Observatory in northern California, for example, has 28 dishes that are each 6 meters and can all point to the same target on the sky and collectively function as a 40 m dish.
Microwaves
Microwaves are also low energy radiation and have sizes that range from about 1 mm up to 300 mm. The most familiar source of microwaves on Earth is probably microwave ovens. Microwaves are used extensively by satellites to monitor weather on the Earth (Doppler radar maps use microwaves) and for remote sensing of the Earth's surface. The ancient radiation left over from the Big Bang also happens to fall into the microwave part of the EM spectrum. This Cosmic Microwave Background (CMB) radiation was discovered serendipitously in 1965 and has a wavelength of 1.9 mm. The CMB is literally everywhere on the sky and will appear as "background noise" in any observations that include this wavelength.
As seen in Figure 5, some microwave radiation makes it to the ground (the telescope used to detect the CMB in 1965 was on the ground in New Jersey, USA) but some parts are also absorbed by the Earth's atmosphere. The COBE, WMAP, and Planck missions all studied the CMB in more detail and were space-based missions.
Infrared
Infrared light is given off by anything with a temperature. This discovery was made in 1800 by the astronomer William Herschel. Herschel studied the rainbow created when white light was sent through a prism and he found that the invisible region beyond the red edge of the rainbow was hotter than the temperature of the rainbow! Herschel called this type of radiation "calorific rays", or heat rays, and today we refer to these heat rays as infrared (IR) light. Our eyes are only sensitive to visible light (some animals, such as vampire bats and goldfish, can see into the infrared), although we can still "see" this type of light by using an IR camera or night vision goggles. These types of sensors pick up differences in infrared intensity. Since most IR light gets absorbed by the Earth's atmosphere, many IR telescopes are in space.
IR light is of great importance in astronomy because it can penetrate, or travel through, dust that is opaque to visible light. This idea is best shown with a comparison of the same picture taken in visible light and infrared light. Figure 7 shows pictures of the Carina Nebula taken by the Hubble Space Telescope (HST) in visible light (left) and infrared light (right). You can see an enormous amount of stars and other objects in the infrared that are not seen in the visible, as infrared light travels right through the dust while visible light is absorbed by the dust.
The James Webb Space Telescope (JWST), which launched in 2021 and has a mirror 2.7 times larger than the HST (meaning it can collect over 7 times as much light), detects IR light. IR light covers the range of about 1-1000 micrometers, where micrometers are abbreviated as μm and are often referred to as microns; for reference, E. Coli bacteria are 2 microns and a human hair is 100 microns. JWST can sense wavelengths in the range of 0.6-28 microns. One of the main goals of JWST is to study planetary systems and the origin of life. One way JWST is doing this is by studying the atmospheres of exoplanets to see if any molecules needed for life, as we know it, are present. This will be discussed in more detail in the chapters on exoplanets.
Visible Light
Human eyes evolved to detect wavelengths spanning the visible part of the EM spectrum, which covers 400 nm to 750 nm. Stars emit visible light and life on Earth would not exist without the light from the Sun. Microscopes and optical telescopes both take visible light and focus it into an image -- the study of visible light is essential to astrobiology. For example, detailed pictures of the surface of Mars that show evidence for past liquid water are taken with visible cameras like Mastcam-Z on the Perseverance rover.
Visible light is not absorbed by the Earth's atmosphere but it does get distorted as it passes through, thus causing images to become blurry. Stars as viewed from the Earth's surface appear to twinkle for this reason. However, optical (visible) telescopes on the Earth's surface can use techniques such as adaptive optics to correct for the atmospheric distortion of visible light. The Hubble Space Telescope does not need to worry about this when it collects visible light.
Some searches for intelligent extraterrestrial life in the universe are carried out using optical telescopes; these searches typically scan the sky and look for anomalous pulses, perhaps from lasers being used by a distant civilization.
Ultraviolet
Ultraviolet (UV) light has a shorter wavelength than visible light and ranges from about 10-400 nm. Stars hotter than the Sun emit primarily UV light but the Sun emits some UV light, too. This is probably most apparent when you are outside on a sunny day and forgot to bring some sunblock -- your skin will absorb some of the UV (specifically, UVA) light. The fact that stars emit UV radiation is important for many aspects of life, in addition to protecting your skin. UV light can actually break the bonds between the hydrogen and oxygen atoms in a water molecule in a process called photolysis and this can create ozone in the atmosphere, which in turn protects life from dangerous radiation that can damage cells.
UV light is emitted from a range of astrophysical sources, including sites of star formation and planetary aurorae. As seen in Figure 5, nearly all UV radiation is absorbed by the Earth's atmosphere so UV telescopes are almost always in space, although some telescopes on high mountain tops, like the Keck telescopes atop Mauna Kea in Hawaii, have UV instruments. NASA's SWIFT satellite is actively studying the universe in UV light, and the Hubble Space Telescope has been probing a wide range of UV sources since 1990.
X Rays
X rays are a high energy type of radiation, with short wavelengths of just 0.01-10 nm, and they can be absorbed by tissue and bones in our bodies. They can destroy DNA so great care is taken when X ray machines are used to take medical images. Fortunately for life, X rays are absorbed by the Earth's atmosphere so they are not a concern on Earth's surface (but are a great concern for astronauts traveling above the Earth's atmosphere).
X rays are generated by high energy astrophysical phenomena such as supernova as well as the Sun's corona. During a total solar eclipse, the very hot gas in the Sun's corona can be seen. The composition of soil on Mars is studied using X ray instruments on Martian rovers, such as Spirit and Opportunity and the active Perseverance mission.
Gamma Rays
Gamma rays are the most energetic type of radiation in the cosmos and have wavelengths on the order of the size of the nucleus inside an atom. On Earth, gamma rays are produced naturally by lightning and radioactivity. Gamma rays are also created when two neutron stars merge, in addition to the gravitational waves that these events create. Gamma rays produced in neutron star mergers produce many of the heavy elements on the periodic table, such as gold and platinum.
Gamma rays do not make it to the Earth's surface so gamma ray observatories need to be in space. The Fermi Space Telescope has been studying gamma rays on the sky since 2008 and has created a complete map of the sky in gamma rays. The surface composition of a planet can be studied using gamma ray instruments -- the MESSENGER mission to Mercury carried a gamma ray spectrometer.
Multiple Wavebands
To fully understand an object, we ideally want to look at in every type of light that it emits. For many object, this can include all types of radiation, from radio waves to gamma ray. An example of this is shown in Figure 8 for the Crab Nebula:
Understanding Radiation
Some astronomical objects emit mostly infrared radiation, others mostly visible light, and still others mostly ultraviolet radiation. What determines the type of electromagnetic radiation emitted by the Sun, stars, and other dense astronomical objects? The answer often turns out to be their temperature.
At the microscopic level, everything in nature is in motion. A solid is composed of molecules and atoms in continuous vibration: they move back and forth in place, but their motion is much too small for our eyes to make out. A gas consists of atoms or molecules that are flying about freely at high speed, continually bumping into one another and bombarding the surrounding matter. The hotter the solid or gas, the faster the motion of its atoms or molecules. The temperature of something is thus a measure of the average motion energy of the particles that make it up.
This motion at the microscopic level is responsible for much of the EM radiation on Earth and in the universe. As atoms and molecules move about and collide, or vibrate in place, their electrons give off EM radiation. The characteristics of this radiation are determined by the temperature of those atoms and molecules. In a hot material, for example, the individual particles vibrate in place or move rapidly from collisions, so the emitted waves are, on average, more energetic. And recall that higher energy waves have a higher frequency. In cooler materials, the particles have lower energy atomic and molecular motions and thus generate lower energy waves.
Blackbody Radiation and Wien's Law
To further understand the relationship between temperature and light (EM radiation), we consider a type of ideal object called a blackbody. A blackbody absorbs all light that hits it; none of the incoming light is reflected away or passes through the object. The object heats up and gains energy; the object then loses this energy by emitting light at all wavelengths (recall that light is a type of energy). In other words, the object cools off until it reaches the same temperature as its surroundings -- this is called thermodynamic equilibrium -- and it does this by converting the energy it absorbed into energy of motion that is radiated in a specific way (this radiated energy is called thermal or blackbody radiation). A glowing ember of coal cools by radiating energy until it reaches the same temperature as its environment.
Any dense, solid object that has a temperature emits blackbody radiation; this includes people, animals, stove tops, light bulbs, stars and planets. For example, the Earth absorbs EM radiation from the Sun, heats up, and then emits radiation as mostly infrared light. Note that any objects that reflect light, such as a book with a red cover, are not blackbodies. Similarly, if light passes through the object, as with a glass table, it is also not a blackbody. In that respect, the Earth is not a perfect blackbody, since clouds and other particulate matter do reflect some sunlight.
No object in nature is a perfect blackbody but many opaque objects behave like a blackbody so it is a very good approximation and we can use some fairly simple math to learn more about the object. As mentioned above, blackbody radiation is not emitted at just one wavelength or one part of the EM spectrum, but covers all wavelengths. At first this may sound strange -- since humans act like blackbodies, does that mean that our bodies emit dangerous X rays and gamma rays? No, that is not the case (I don't have X ray eyes) and any blackbody emits the most intense radiation at one particular wavelength. Humans have a typical temperature of 98.6°F (or 310 K) and emit the most intense radiation at 9.3 microns (an infrared wavelength, meaning we radiate heat!). The peak wavelength of the radiation that a blackbody gives off depends only on its temperature. This means two very different objects with the same temperature emit identically with the same wavelength of peak intensity. The Earth is just a little bit cooler than a human at 288 K, and its most intense radiation is at 10.1 microns. This relationship between the temperature of a blackbody and its peak wavelength is called Wien's Law and is:
[latex]\lambda_{\rm max} = \frac{ 0.0029 }{T} \rm{~m ~K}[/latex]
where the wavelength is in meters and the temperature is in K (the constant 0.0029 has units of m × K). You can easily verify λmax for a human at 310 K: (0.0029 m K)/(310 K) = 9.3×10⁻⁶ m = 9.3 microns.
The thermal radiation emitted by any blackbody shows a similar shape in the intensity of light at different wavelengths. These shapes are called blackbody curves or thermal energy curves. Figure 9 shows this general shape for blackbody curves for objects of different temperatures. The shape is similar for all temperatures but notice that the intensity for each blackbody curve peaks at a different maximum wavelength.
Notice in Figure 9 that the curves show that, at each temperature, the blackbody objects emit radiation at all wavelengths (all colors) but that the most energy is emitted at a peak wavelength. Physically, this peak corresponds to the average speed of atoms or molecules inside the object, which is a manifestation of its temperature.
The hotter the object, the shorter the peak wavelength -- the object at 5500 K has a shorter λmax (530 nm) than the object at 2500 K (which has λmax of 1160 nm and is in the infrared portion of the EM spectrum). It makes sense, then, that hot objects give off a larger fraction of their energy at shorter wavelengths (higher energies) than do cool objects. You may have observed examples of this rule in everyday life. When a burner on an electric stove is turned on low, it emits only heat, which is infrared radiation, but does not glow with visible light. If the burner is set to a higher temperature, it starts to glow a dull red. At a still-higher setting, it glows a brighter orange-red (shorter wavelength). At even higher temperatures, which cannot be reached with ordinary stoves, metal can appear brilliant yellow or even blue-white.
We can use these ideas to come up with a thermometer for measuring the temperatures of stars. Because many stars give off most of their energy in visible light, the color of light that dominates a star’s appearance is an indicator of its temperature. If one star looks red and another looks blue, which one has the higher temperature? Because blue is the shorter-wavelength color, it is the sign of a hotter star. (Note that the temperatures we associate with different colors in science are not the same as the ones artists use. In art, red is often called a “hot” color and blue a “cool” color. Likewise, we commonly see red on faucet or air conditioning controls to indicate hot temperatures and blue to indicate cold temperatures. Although these are common uses to us in daily life, in nature, it’s the other way around.)
What about the Sun? The Sun has a surface temperature of 5800 K so Wien's law immediately tells us that λmax is 500 nm. Which corresponds to green light. But the Sun doesn't look green, it looks yellow or white! What's going on?! This makes sense when you consider that the Sun is also emitting red light and blue light; these all mix together as a nearly white color. Pure purple stars are also never seen for similar reasons -- the blue and violet mix into a more deep blue color.
C0lor Temperature
Different wavelengths (or frequencies) of light correspond to different colors. But what exactly is color? Is it a property of an object, like its size, or is it something that our brains perceive? Our eyes receive light, which is sent to the brain for processing. When we look at an object, we are seeing the light that is reflected off that object. If there is no light in the room, then we do not see anything at all. When light strikes an object, some of the light is reflected and some of it is absorbed. Human eyes have evolved to see visible light; some other animals, such as birds, can see ultraviolet light! Photoreceptors called cones in the retina of our eyes are sensitive to red, blue, and green light. In that sense, every color can be broken down into a combination of red, blue, and green. This is why television only needs those three colors to accurately simulate reality. In low light conditions, rods in the retina take over and are only sensitive to one color; hence, we see shades of gray.
The Sun emits white light, which contains all colors. As an example, let’s consider what happens when sunlight strikes a house painted red. The white light hits the red house, and only red light is reflected to our eyes; all of the other colors are absorbed by the paint molecules. Pigments are substances that selectively absorb very specific wavelengths of light, leaving only the desired wavelength of light reflected.
How does the color emitted by an object relate to its temperature? Wien’s law gives a mathematical relationship for this and shows that the temperature of a blackbody is inversely proportional to the wavelength of the light emitted. As a more visual example, consider a piece of metal being heated up. First it will turn a dull red color, then orange to white, and eventually it becomes blue when it is hottest. The scale is shown in Figure 10, where the temperatures are in Kelvin.
Light bulbs are designed with color temperature in mind. This is likely a familiar concept to photographers when selecting back lighting for a shoot. For a "candlelight" type background, a bulb of around 2000 K will be best, while a "natural daylight" background is best achieved with a bulb at 4500 K. Most fluorescent light bulbs in classrooms are around 5000 K while those in a library will be closer to 3000 K.
Luminosity and Brightness
Wien's Law shows that blackbodies, like stars, emit the most intense radiation at a specific wavelength, λmax. What exactly is this intensity a measure of?
Luminosity is the total amount of energy that an object (like a star) puts out each second. It has dimensional units of energy per second. In the same way that a 100 W bulb will always put out 100 Watts whether we are standing close or farther away, the luminosity of a star does not depend on our distance from it.
However, astronomers do not measure luminosity directly with a telescope; they measure brightness: the luminosity that is intercepted by a detector such as a photographic plate or a digital camera. If you imagine a spherical surface - a bubble - around a star, then the luminosity is the integrated (total) light from the surface of that bubble. The brightness, which is the luminosity per unit area, decreases as the surface area of the spherical volume increases. This is the same phenomenon that happens with expanding balloons. The balloon has a certain amount of material, usually latex or rubber. Analogous to luminosity, that amount of material is constant, no matter how much air is in the balloon. However, as the balloon expands, that constant amount of material is stretched over a larger surface area. The walls of the balloon get thinner and the amount of material per unit area decreases. The luminosity of a star is constant. The brightness that we measure depends on whether we are "up close" or far away from the star.
This is shown in Figure 11, where the light from a star with luminosity L spreads out into spheres of increasing surface area as it travels away from the star. At a distance d from the star, we can measure the brightness ($B$) by dividing the total power emitted by the star (L) by the surface area of the sphere that the light has now spread into:
[latex]$B = \frac{L}{4 \pi d^2}$[/latex]
This idea—that the apparent brightness of a source (how bright it looks to us) gets weaker with distance in the way we have described—is shown in Figure 11 below. At point 1, the light is concentrated into one box. By the time the light reaches point 2, which is twice as far as point 1, it is now spread out into four squares.
Concept Check: Brightness and distances of stars
You observe two stars, named Sol-2 and Sol-3, that have the exact same luminosity as the Sun (this means they have the same temperature, radius, and luminosity as the Sun). You measure the brightness of both stars with the same instrument and find that the light from Sol-2 is twenty-five times brighter than the light from Sol-3. Which star is closer to the Earth and by how much? Explain your reasoning.
Show Answer
Ans: Sol-2 is five times closer than Sol-3. Brightness drops as the distance squared, so the ratio of the distances to Sol-2 and Sol-3 is given by [latex]\sqrt{B_{Sol2}/B_{Sol3}}[/latex] or [latex]\sqrt{25}[/latex] = 5.
Let's consider the luminosity of the Sun and the amount of energy from the Sun that reaches the Earth. This will be important to know when we study exoplanets and want to know how much light from the host star reaches the exoplanet. The luminosity of the Sun is 3.9×1026 W -- in other words, it emits the same amount of power as 3.9×1024 100 W light bulbs (or 39 trillion trillion 100 W bulbs!). As the light travels away from the Sun, it is spread out more and more, as all of that light needs to cover spheres (bubbles) that have greater surface area. The distance from the Earth to the Sun is 151 million km, or 1.51×10¹¹ m. Putting this value into the brightness equation, we find that we receive 1360 W/m2 of sunlight on the Earth. That means every 1 m2 patch on the Earth, which is about the size of a standard chess board, receives 1360 Joules of energy every second. Venus is closer to the Sun than the Earth and receives more energy for every square meter, 2600 W/m2, while Mars is further and receives only 600 W/m2.
Worked Example: Calculating the energy received from the Sun
How much radiation from the Sun is received at Saturn's moon Titan? You can assume that Titan and Saturn are at the same distance from Earth.
We can find the value by using the relationship for brightness, luminosity and distance:
[latex]$B = \frac{L}{4 \pi d^2}$[/latex]
Here, L is the luminosity of the Sun and d is the distance of Titan from the Sun. The distance from the Sun to Titan (Saturn) is 1.45 billion km (or 1.45×10¹² m).
B = (3.9×1026 W)/(4 π (1.45×10¹² m)2) = 14.8 W/m2
This makes sense -- Saturn is almost 10 times further from the Sun than the Earth (Earth is 1 AU and Saturn is 9.57 AU), so the value should be significantly lower than Earth's. [In fact, you could also find this value by taking the ratio (1/9.57)2 and multiplying by 1360 W/m2]
Show mathematically that the Earth receives 1360 W/m2 from the Sun.
Show Answer
The only difference here is the distance: now it is the distance from the Earth to the Sun, which is 151 million km.
B = (3.9×1026 W)/(4 π (1.51×10¹¹ m)2) = 1361 W/m2
Spectroscopy
Light from objects is filled with information. By taking the light from an object and splitting it apart into a spectrum, we can decode this light. Spectroscopy is a fundamental tool for astrobiology and allows us to detect exoplanets and study the chemical makeup of their atmospheres.
The most familiar example of spectroscopy is the rainbow of colors that is produced when white light is sent through a prism, as seen in Figure 1. A water droplet can also split up (or disperse) light and create a rainbow when a light beam passes through it. Both prisms and water droplets can serve as spectrometers or spectrographs -- tools used to disperse light into a spectrum.
Stars emit all types of electromagnetic radiation but emit the most intense light at a specific wavelength (see Wien's Law). Note that infrared and ultraviolet light are also emitted by the Sun and are split out as seen in Figure 1 -- our eyes just can't perceive these types of radiation. The distribution of colors, which is naturally organized by wavelength (or frequency), is called a spectrum. There are three main types of spectra: continuous, absorption, and emission as shown in Figure 2. If the shape of the spectrum on the bottom left of Figure 2 looks familiar, it is because you have seen it before when learning about blackbody (thermal) radiation curves.
A continuous spectrum looks like the rainbow shown in Figure 1. However, sunlight that reaches the Earth actually is an absorption spectrum, not a continuous spectrum. Why? The Sun does emit a continuous spectrum from its core but some of that light is absorbed by different atoms as it passes through the Sun's atmosphere. This is shown in Figure 2. On the left, the Sun emits a continuous spectrum at its surface. But that light passes through the atmosphere (the cloud of gas in the middle) and some of that light is absorbed by atoms in the gas. The spectrum on the right is the type of spectrum seen for the Sun, where the dark lines correspond to the wavelengths associated with the atoms or molecules that absorbed the light. Figure 3 shows an absorption spectrum for the Sun, with some of the atoms and molecules present in the Sun's atmosphere labeled. This spectrum was taken from the Earth's surface, so the O2 (molecular oxygen) lines are from Earth's atmosphere.
What does it mean to say "the wavelengths associated with the atoms"? Every element on the periodic table has a different number of protons and thus a different structure. Hydrogen is the simplest atom, with just one proton and one electron orbiting the proton in a neutral atom. To get the electron out of the hydrogen atom entirely requires a certain amount of energy. If there is no energy supplied to the atom, it is stable and the electron is in what we call the ground state of energy. However, the electron can move to different energy levels above the ground state -- imagine rungs on a ladder, with the ground state at the bottom and the top rung being the amount of energy needed to kick the electron out of the atom. Hydrogen has a unique set of energy levels and each level has an exact amount of energy. And recall that this energy has an exact frequency or wavelength given by [latex]E=hf = h c/\lambda[/latex]. When light particles (photons) with exactly one of those wavelengths encounters the atom, it is absorbed. And every element has a different set of energy levels, meaning a distinct set of its own characteristic wavelengths. We thus have a very powerful way of learning which elements are inside a star's atmosphere.
Using the unique pattern of an element to identify whether it is inside of an atmosphere is similar to DNA barcoding used in forensics to identify a match to evidence at a crime scene. Figure 4 shows an example of some of the colors (wavelengths) for a few different elements. No two are the same and we can use these patterns to identify an element in a star or planet's atmosphere. This same technique is used extensively in biochemistry and many other scientific fields. We can think of the unique emission lines associated with an atom or molecule as its chemical fingerprint.
The middle part of Figure 2 shows the physical idea of how an emission spectrum is created. Let's say you have a gas made from atoms of just one type of element. If you heat up that gas, the electrons can move up to higher energy levels and then drop back down, emitting light in the process. This is almost the same situation as the absorption spectrum on the left except we are not looking at the continuous source and the gas but instead just at the gas...so there is no continuous spectrum in the background, just the bright lines that correspond to whatever element is in the gas. The atom is emitting energy at the unique set of wavelengths (colors) for that particular element. Of course, the gas can contain many different atoms and molecules at the same time.
You can take a look at the fingerprints for some other elements using the simulation below. Click on any element to see its unique set of spectral lines. Notice that you can choose to see both absorption (top) and emission (bottom) spectra.
Key Concepts and Summary
The energy of light is our messenger about the universe. Different colors of light are simply different wavelengths and different wavelengths of light contain different amounts of energy. The longest wavelengths in the electromagnetic spectrum are radio waves and these have the lowest energy. The shortest wavelengths are high energy gamma rays. Unsurprisingly, the visible band of light (where our brain interprets different wavelengths as different colors) matches the key energy output of the Sun - we evolved to optimally navigate this range of energies. By observing the universe with detectors that are sensitive to different energies of light, we can learn about the energy output and the peak temperatures of the objects we detect. Because the brightness of a star or other celestial object decreases with distance, a measurement of distance is needed to back out luminosity (energy per second). The wavelengths of light encode the energy and chemical composition of stars and other celestial bodies - astronomers use spectrographs to disperse light collected at a telescope into a spectrum. Objects emit a continuous (sometimes called "blackbody") spectrum with an intensity distribution that depends on temperature. When atomic transitions take place in cooler outer layers of stars, the spectrum can also have absorption or emission lines. Absorption lines occur when atoms absorb photons of light pushing electrons to a higher energy state. Emission lines occur when atoms release photons and the electrons cascade to a lower energy state.
Review Questions
Summary Questions
- What is energy? Describe two different kinds of energy and give examples of each.
- What does it mean to say the energy is "conserved"?
- How are the frequency and wavelength of light related to each other?
- What is a photon?
- Which property of light determine how much energy a photon has?
- What are the seven main parts of the electromagnetic spectrum? For each band (part), give an example of a source of that type of radiation.
- How does the type of light emitted by an object depend on its temperature?
- What is the difference between the brightness of an object (such as a star) and its luminosity?
- How does the total amount of energy emitted differ for hot and cold objects?
- How does spectroscopy give information about an object? What happens when starlight passes through a prism?
- What are the differences between continuous, absorption and emission spectra? What are the similarities between all three?
- Why are the spectral lines for an element sometimes called “chemical fingerprints”?
Activities
- Understanding blackbody radiation. Open the simulation at https://phet.colorado.edu/sims/html/blackbody-spectrum/latest/blackbody-spectrum_en.html.
- The default is set to the temperature of the Sun. Click on the "labels" box to show different parts of the EM spectrum (UV, visible, and infrared). What part of the EM spectrum has the most intense light from the Sun.
- Now set the thermometer to the temperature of the star Sirius. The y-axis now needs to be rescaled to see the value for the peak intensity, Adjust this by using the zoom out button. Once you can see the peak, click on the "Graph Values" box. What is the wavelength of the peak intensity light for Sirius?
- Energy flux. Calculate the solar flux (in W/m2) at the planet Mercury.
Life needs a source of energy to thrive. This energy can come in different forms, from sunlight to energy released when chemicals react. Light is a type of pure energy, and coded into the light and other kinds of radiation that reach us from objects in the universe is a wide range of information about what those objects are like and how they work. If we can decipher this code and read the messages it contains, we can learn an enormous amount about the cosmos without ever having to leave Earth or its immediate environment.
Learning Objectives
By the end of this chapter, you will be able to:
- Understand that there are different types of energy and that energy is conserved
- Explain the wavelength, frequency and energy of a wave or particle of light
- Discuss the different parts of the electromagnetic spectrum
- Explain how and why the light emitted by an object depends on its temperature
- Explain the difference between the luminosity and brightness of an object
- Explain how the total energy emitted differs for hot and cold objects
- Describe how spectroscopy can provide information about an object, such as a star.
- Discuss the difference between continuous, absorption and emission spectra.
Energy
Different types of energy are all around us -- the electrical energy that powers our technology, the chemical energy that is stored in the food we eat, and the heat energy we feel when when walking in sunlight. These different types of energy can be changed, or converted, from one type to another. For example, the chemical energy in food is converted to energy that allows us to think and move around. We will see other examples of energy transformations in astrobiology, such as the gravitational energy that is converted into heat when a giant cloud of gas and dust collapses and eventually forms stars.
The amount of the energy in the universe is always the same and it is continuously being changed from one form into another. This is the essence of the law of conservation of energy. Other quantities in nature, such as mass and momentum, are also conserved.
Though energy cannot be created or destroyed, it can be transformed into different forms. The two main forms of energy are kinetic energy and potential energy. Kinetic energy is the energy of motion. When an object is moving more quickly, it has more energy. A fast-moving car has more energy than a slow moving car. Thermal energy is actually a form of kinetic energy since higher temperature is really a measure of the average speed of atoms and molecules -- the higher the temperature, the greater the kinetic energy of the atoms and molecules.
Potential energy is the energy that is associated with different positions in space. When you throw a ball high into the air, it has more gravitational potential energy than when it is held in your hand. When an object moves from an area of high potential energy to low potential energy, that energy will be transformed into another form. For example, when an apple falls to the Earth, it will speed up gaining kinetic energy. But potential energy does not need to be related just to gravity. For example, the energy stored in chemicals is in the form of chemical potential energy which can be determined based on the position of different atoms bonded to each other by electric forces of attraction.
A more recently discovered form of energy is the energy associated with mass itself. Einstein's famous equation [latex]E=mc^2[/latex] tells us, that mass-energy equivalence is a fundamental feature of the universe. Any object that has mass therefore also contains energy -- this type of energy is called rest-mass energy. Inside the core of stars, nuclear fusion converts some of the rest-mass of two protons into energy. This process occurs an astounding 1038 times every second and is the source of the energy from the Sun that we receive on Earth.
Light
A great deal of the energy that life on Earth uses comes in one way or another from the Sun's light, although geothermal energy from inside the Earth can also be harnessed. Light from the Sun, or any star, is an example of electromagnetic radiation. Here, the words light and radiation are synonymous, and both are a form of energy. Radiation can sometimes be thought of as dangerous and some types are (for example, gamma rays and X rays), but radiation is a neutral term and is synonymous with energy.
One of the more bizarre aspects of light is the way that it acts, specifically the fact that it can behave like a wave and a particle. In the 17th century, the nature of light was debated and both Isaac Newton and Christiaan Huygens tried to explain it. Newton experimented with lenses and prisms and believed that light was a stream of particles, which he called corpuscles. Huygens, on the other hand, believed that light was a wave that traveled outward in all directions from a source, much like the ripples on a pond that expand outward through the water after a stone is dropped into it. Building upon pioneering work by James Clerk Maxwell and Max Planck, Albert Einstein proposed in 1905 that light can indeed behave both ways, thus solidifying the concept of wave-particle duality, one of the tenets of quantum mechanics. The wave and particle nature of light has now been experimentally verified countless times.
Light as a Wave
Light carries energy and information from one place to another, and this energy is carried in the form of electromagnetic (EM) waves. Other familiar types of waves in nature include sound waves and water waves. All three of these types of waves have some differences and some similarities.
Water and sound waves are mechanical waves and require a medium to travel in. For sound waves, the medium is air and the medium is water for water waves. If you screamed on the surface of the Moon, which has no atmosphere, nobody would hear you as the sound waves have no medium to travel through. (The director Stanley Kubrick got it right in the film 2001: A Space Odyssey.) EM waves do not require water or air or any medium to travel though – they can travel through empty space. This was such a disturbing idea to nineteenth-century scientists that they actually made up a substance to fill all of space—one for which there was no evidence—just so light waves could have something to travel through: they called it the aether. Today, we know that there is no aether and that EM waves have no trouble at all moving through empty space (as all the starlight visible on a clear night must surely be doing).
The speed of a sound wave depends on the medium through which it is traveling. A sound wave moves faster through water than it does through air, for example. However, all electromagnetic waves move at the same speed in empty space (the speed of light—approximately 300,000 kilometers per second, or 300,000,000 meters per second, which can also be written as 3×10⁸ m/s), which turns out to be the fastest possible speed in the universe.
Now for some similarities. All waves are a kind of repeating phenomenon. Whether it is the up-and-down motion of a water wave or the changing electric and magnetic fields in a wave of light, the pattern of disturbance repeats in a cyclical way. Thus, any wave motion can be characterized by a series of crests and troughs. Moving from one crest through a trough to the next crest completes one cycle. The horizontal length covered by one cycle is called the wavelength (λ). Ocean waves provide an analogy: the wavelength is the distance that separates successive wave crests. An example of water waves created when a frog leaps into a pond is shown in Figure 1.
We can also characterize different waves by their frequency, which is the number of wave cycles that pass by per second. If you count 10 crests moving by each second, for example, then the frequency is 10 cycles per second (cps). In honor of Heinrich Hertz, the late nineteenth physicist who, inspired by physicist James Clerk Maxwell’s work, discovered radio waves, a cps is also called a hertz (Hz). Take a look at your radio, for example, and you will see the channel assigned to each radio station is characterized by its frequency, usually in units of kHz (kilohertz, or thousands of hertz) or MHz (megahertz, or millions of hertz).
Concept Check: Wavelength and Frequency
Figure 3 is a schematic showing the wavelengths and frequencies for different colors of light. Red light is at the top and its wavelength (λ) is shown as the distance between two peaks, where the peaks are marked by the vertical black lines. Blue light is on the bottom; notice that it has a shorter wavelength than red light (the length between the two peaks is noticeably shorter).
The frequency of a wave is a measure of how many waves pass by in one second. Let's imagine that the amount of time that elapsed for each of the waves in Figure 3 is 1 second. Looking at red light, two full waves can pass by in this 1 second period, so we say the frequency is 2 cycles per second, or 2 Hz. (Actually, a bit more than two red light wave cycles can pass by, about 2.5, but we will say 2 full waves to keep this example simple.)
- Which color of light has the highest frequency? How about the lowest frequency?
- Which color of light has the shortest wavelength?
Show Answer
- Looking at Figure 3, the most crests pass by in one second for blue light (6 Hz) while the fewest pass by for red light. Thus, blue light has the highest frequency and red light has the lowest.
- Since blue light has the highest frequency, it also has the shortest wavelength. It is easy to see in Figure 3 that λ is shortest for blue light.
Wavelength (λ) and frequency (f) are related because all electromagnetic waves travel at the same speed. The formula for this relationship can be expressed as follows: for any wave motion, the speed at which a wave moves equals the frequency times the wavelength. Waves with longer wavelengths have lower frequencies. Mathematically, we can express this as
[latex]c = \lambda f[/latex]
where the Greek letter for “l”—lambda, λ—is used to denote wavelength and c is the scientific symbol for the speed of light.
The electromagnetic wave model of light (as formulated by James Clerk Maxwell) was one of the great triumphs of nineteenth-century science. In 1887, when Heinrich Hertz actually made invisible electromagnetic waves (what today are called radio waves) on one side of a room and detected them on the other side, it ushered in a new era that led to the modern age of telecommunications. His experiment ultimately led to the technologies of television, cell phones, and today’s wireless networks around the globe.
Light as a Photon
By the beginning of the twentieth century, physicists had to reluctantly accept that sometimes light behaves more like a “particle”—or at least a self-contained packet of energy—than a wave. We call such a packet of electromagnetic energy a photon.
A photon carries a specific amount of energy. How much energy a photon has depends on its frequency. We can use the idea of energy to connect the photon and wave models. How much energy a photon has depends on its frequency. A low-energy radio wave has a low frequency, while a high-energy X-ray at your dentist’s office is a high-frequency wave. Among the colors of visible light, violet-light photons have the highest energy and red-light photons have the lowest.
Test whether the connection between photons and waves is clear to you. In the above example, which photon would have the longer wavelength as a wave: the radio wave or the X-ray? If you answered the radio wave, you are correct. Radio waves have a lower frequency, so the wave cycles are longer
The Electromagnetic Spectrum
Objects in the universe send out an enormous range of radiation, or light. Scientists call this range the electromagnetic (EM) spectrum, which are divided into a number of regions. The spectrum is shown in Figure 4, with some information about the waves in each part or band.
Looking at the EM spectrum in Figure 4, we see that:
- Gamma rays have the highest energy and radio waves have the lowest energy
- Radio waves have the longest wavelength and gamma rays have the shortest wavelength
- Radio waves have the highest frequency and gamma rays have the lowest frequency
These properties of light are summarized by the beautifully simple equation that relates the energy of a photon to its frequency (or wavelength), where h is Planck's constant:
[latex]E=hf[/latex]
This relationship shows the wave-particle duality of light, as the energy of photon (a particle of light) is directly related to its frequency (a wave property). Since h has a constant value, you can immediately get the energy of a particular color of light simply by knowing its frequency (or wavelength, which can be expressed as [latex]\lambda = c / f[/latex]).
Another property of light that has already been mentioned but is worth re-emphasizing is that all types of light travel at the speed of light. Since the speed of light is constant, all light travels at the same speed.
Worked Example: Frequency and Wavelength
Red light has a wavelength of about 650 nm and blue light has a wavelength of about 450 nm. Recall that nm is the abbreviation for nanometers.
What is the frequency of red light?
The frequency of any type of light is related to its wavelength as [latex]f = c / \lambda[/latex], where c is the speed of light.
To use this equation, we must be sure that the units are all consistent. If we use 3×10⁸ m/s for the speed of light, then the wavelength must be in units of meters and the frequency will be in units of Hz (where 1 Hz = 1 cycle per second). So, we must first convert the wavelength from nanometers into meters. One nanometer is one-billionth of a meter: 1 nm = 10-9 m so it follows that 650 nm = 650×10-9 m. Expressed in scientific notation, the wavelength of red light is 6.50×10⁻⁷ m.
[latex]f = c / \lambda[/latex] = (3×10⁸ m/s) ⁄ (6.50×10⁻⁷ m) = 461,538,461,538,461 Hz
That's a huge number of cycles in one second! Expressing this in scientific notation, f = 4.62×10¹⁴ Hz.
The wavelength of visible light (like red and blue) is often reported in THz, where T is the prefix one trillion, or 1012.
Extra 1: Show that the frequency can also be expressed as 462 THz.
Show Answer
The frequency 4.62×10¹⁴ Hz can also be written as 4.62×102×1012 Hz
4.62×102 = 462 and 1012 Hz = 1 THZ, so f = 462 THz
Extra 2: Show that the frequency of blue light (with a wavelength of 450 nm) is 666 THz.
Show Answer
[latex]f = c / \lambda[/latex] = (3×10⁸ m/s) ⁄ (4.50×10⁻⁷ m) = 6.66×10¹⁴ Hz = 666 THz
Types of Electromagnetic Radiation
Throughout our study of astrobiology, we will encounter all types of light. When we collect light using a camera or sensor on the Earth's surface, that light must first travel through the Earth's atmosphere before it reaches the ground. Depending on the type of light, some of it may be partially or completely absorbed by molecules in different parts of the Earth's atmosphere. This means that some types of telescopes need to be above the Earth's atmosphere in order to detect any light. Also, we will see that this absorbed light will show up as a kind of set of Earth's chemical fingerprints in any observations that contain the Earth's atmosphere; this is the basic idea behind biosignatures for life, and we will probe it more deeply in the exoplanet chapters.
The way that light is absorbed in Earth's atmosphere for each part of the EM spectrum is shown in Figure 5.
We highlight a few properties of each type of light that are of relevance to astrobiology, as well as what types of telescopes are used to study the universe in each type of light.
Radio Waves
Radio waves have the longest wavelengths of any type of radiation -- they can range from a few millimeters all they way up to hundreds of kilometers (for reference, Switzerland is about 300 km across). Radio waves have very low energies and are all around us in our everyday lives. On Earth, cell phones, radio and TV transmissions, satellites and radar all emit radio waves and these pass right through our bodies. Radio waves are also produced in nature by a number of astrophysical objects, including stars and pulsars. The most abundant element in the cosmos -- hydrogen -- also naturally emits radio waves at a very specific wavelength of 21 cm (which corresponds to a frequency of 1420 MHz). As we will see later in the chapter on SETI, astronomers search for signals from advanced extraterrestrial civilizations that are close to the 21 cm radiation that hydrogen produces.
Most radio waves reach the ground, as seen by the "radio window" in Figure 5. The lowest frequency radio waves do not make it to the Earth's surface and this region of the EM spectrum remains unexplored. Because radio waves are long, in general the telescopes (in the case of radio astronomy, these are called dishes or antennae) need to be very large. Some of the first radio observations made to look for signs of intelligent life were carried out by Frank Drake in 1960 using the 85-foot Green Bank Telescope. There is another way to work around the large size needed for dishes through a technique called interferometry. Using this technique, a number of small radio dishes can be made to work in concert and achieve the same precision as a larger dish. The Hat Creek Radio Observatory in northern California, for example, has 28 dishes that are each 6 meters and can all point to the same target on the sky and collectively function as a 40 m dish.
Microwaves
Microwaves are also low energy radiation and have sizes that range from about 1 mm up to 300 mm. The most familiar source of microwaves on Earth is probably microwave ovens. Microwaves are used extensively by satellites to monitor weather on the Earth (Doppler radar maps use microwaves) and for remote sensing of the Earth's surface. The ancient radiation left over from the Big Bang also happens to fall into the microwave part of the EM spectrum. This Cosmic Microwave Background (CMB) radiation was discovered serendipitously in 1965 and has a wavelength of 1.9 mm. The CMB is literally everywhere on the sky and will appear as "background noise" in any observations that include this wavelength.
As seen in Figure 5, some microwave radiation makes it to the ground (the telescope used to detect the CMB in 1965 was on the ground in New Jersey, USA) but some parts are also absorbed by the Earth's atmosphere. The COBE, WMAP, and Planck missions all studied the CMB in more detail and were space-based missions.
Infrared
Infrared light is given off by anything with a temperature. This discovery was made in 1800 by the astronomer William Herschel. Herschel studied the rainbow created when white light was sent through a prism and he found that the invisible region beyond the red edge of the rainbow was hotter than the temperature of the rainbow! Herschel called this type of radiation "calorific rays", or heat rays, and today we refer to these heat rays as infrared (IR) light. Our eyes are only sensitive to visible light (some animals, such as vampire bats and goldfish, can see into the infrared), although we can still "see" this type of light by using an IR camera or night vision goggles. These types of sensors pick up differences in infrared intensity. Since most IR light gets absorbed by the Earth's atmosphere, many IR telescopes are in space.
IR light is of great importance in astronomy because it can penetrate, or travel through, dust that is opaque to visible light. This idea is best shown with a comparison of the same picture taken in visible light and infrared light. Figure 7 shows pictures of the Carina Nebula taken by the Hubble Space Telescope (HST) in visible light (left) and infrared light (right). You can see an enormous amount of stars and other objects in the infrared that are not seen in the visible, as infrared light travels right through the dust while visible light is absorbed by the dust.
The James Webb Space Telescope (JWST), which launched in 2021 and has a mirror 2.7 times larger than the HST (meaning it can collect over 7 times as much light), detects IR light. IR light covers the range of about 1-1000 micrometers, where micrometers are abbreviated as μm and are often referred to as microns; for reference, E. Coli bacteria are 2 microns and a human hair is 100 microns. JWST can sense wavelengths in the range of 0.6-28 microns. One of the main goals of JWST is to study planetary systems and the origin of life. One way JWST is doing this is by studying the atmospheres of exoplanets to see if any molecules needed for life, as we know it, are present. This will be discussed in more detail in the chapters on exoplanets.
Visible Light
Human eyes evolved to detect wavelengths spanning the visible part of the EM spectrum, which covers 400 nm to 750 nm. Stars emit visible light and life on Earth would not exist without the light from the Sun. Microscopes and optical telescopes both take visible light and focus it into an image -- the study of visible light is essential to astrobiology. For example, detailed pictures of the surface of Mars that show evidence for past liquid water are taken with visible cameras like Mastcam-Z on the Perseverance rover.
Visible light is not absorbed by the Earth's atmosphere but it does get distorted as it passes through, thus causing images to become blurry. Stars as viewed from the Earth's surface appear to twinkle for this reason. However, optical (visible) telescopes on the Earth's surface can use techniques such as adaptive optics to correct for the atmospheric distortion of visible light. The Hubble Space Telescope does not need to worry about this when it collects visible light.
Some searches for intelligent extraterrestrial life in the universe are carried out using optical telescopes; these searches typically scan the sky and look for anomalous pulses, perhaps from lasers being used by a distant civilization.
Ultraviolet
Ultraviolet (UV) light has a shorter wavelength than visible light and ranges from about 10-400 nm. Stars hotter than the Sun emit primarily UV light but the Sun emits some UV light, too. This is probably most apparent when you are outside on a sunny day and forgot to bring some sunblock -- your skin will absorb some of the UV (specifically, UVA) light. The fact that stars emit UV radiation is important for many aspects of life, in addition to protecting your skin. UV light can actually break the bonds between the hydrogen and oxygen atoms in a water molecule in a process called photolysis and this can create ozone in the atmosphere, which in turn protects life from dangerous radiation that can damage cells.
UV light is emitted from a range of astrophysical sources, including sites of star formation and planetary aurorae. As seen in Figure 5, nearly all UV radiation is absorbed by the Earth's atmosphere so UV telescopes are almost always in space, although some telescopes on high mountain tops, like the Keck telescopes atop Mauna Kea in Hawaii, have UV instruments. NASA's SWIFT satellite is actively studying the universe in UV light, and the Hubble Space Telescope has been probing a wide range of UV sources since 1990.
X Rays
X rays are a high energy type of radiation, with short wavelengths of just 0.01-10 nm, and they can be absorbed by tissue and bones in our bodies. They can destroy DNA so great care is taken when X ray machines are used to take medical images. Fortunately for life, X rays are absorbed by the Earth's atmosphere so they are not a concern on Earth's surface (but are a great concern for astronauts traveling above the Earth's atmosphere).
X rays are generated by high energy astrophysical phenomena such as supernova as well as the Sun's corona. During a total solar eclipse, the very hot gas in the Sun's corona can be seen. The composition of soil on Mars is studied using X ray instruments on Martian rovers, such as Spirit and Opportunity and the active Perseverance mission.
Gamma Rays
Gamma rays are the most energetic type of radiation in the cosmos and have wavelengths on the order of the size of the nucleus inside an atom. On Earth, gamma rays are produced naturally by lightning and radioactivity. Gamma rays are also created when two neutron stars merge, in addition to the gravitational waves that these events create. Gamma rays produced in neutron star mergers produce many of the heavy elements on the periodic table, such as gold and platinum.
Gamma rays do not make it to the Earth's surface so gamma ray observatories need to be in space. The Fermi Space Telescope has been studying gamma rays on the sky since 2008 and has created a complete map of the sky in gamma rays. The surface composition of a planet can be studied using gamma ray instruments -- the MESSENGER mission to Mercury carried a gamma ray spectrometer.
Multiple Wavebands
To fully understand an object, we ideally want to look at in every type of light that it emits. For many object, this can include all types of radiation, from radio waves to gamma ray. An example of this is shown in Figure 8 for the Crab Nebula:
Understanding Radiation
Some astronomical objects emit mostly infrared radiation, others mostly visible light, and still others mostly ultraviolet radiation. What determines the type of electromagnetic radiation emitted by the Sun, stars, and other dense astronomical objects? The answer often turns out to be their temperature.
At the microscopic level, everything in nature is in motion. A solid is composed of molecules and atoms in continuous vibration: they move back and forth in place, but their motion is much too small for our eyes to make out. A gas consists of atoms or molecules that are flying about freely at high speed, continually bumping into one another and bombarding the surrounding matter. The hotter the solid or gas, the faster the motion of its atoms or molecules. The temperature of something is thus a measure of the average motion energy of the particles that make it up.
This motion at the microscopic level is responsible for much of the EM radiation on Earth and in the universe. As atoms and molecules move about and collide, or vibrate in place, their electrons give off EM radiation. The characteristics of this radiation are determined by the temperature of those atoms and molecules. In a hot material, for example, the individual particles vibrate in place or move rapidly from collisions, so the emitted waves are, on average, more energetic. And recall that higher energy waves have a higher frequency. In cooler materials, the particles have lower energy atomic and molecular motions and thus generate lower energy waves.
Blackbody Radiation and Wien's Law
To further understand the relationship between temperature and light (EM radiation), we consider a type of ideal object called a blackbody. A blackbody absorbs all light that hits it; none of the incoming light is reflected away or passes through the object. The object heats up and gains energy; the object then loses this energy by emitting light at all wavelengths (recall that light is a type of energy). In other words, the object cools off until it reaches the same temperature as its surroundings -- this is called thermodynamic equilibrium -- and it does this by converting the energy it absorbed into energy of motion that is radiated in a specific way (this radiated energy is called thermal or blackbody radiation). A glowing ember of coal cools by radiating energy until it reaches the same temperature as its environment.
Any dense, solid object that has a temperature emits blackbody radiation; this includes people, animals, stove tops, light bulbs, stars and planets. For example, the Earth absorbs EM radiation from the Sun, heats up, and then emits radiation as mostly infrared light. Note that any objects that reflect light, such as a book with a red cover, are not blackbodies. Similarly, if light passes through the object, as with a glass table, it is also not a blackbody. In that respect, the Earth is not a perfect blackbody, since clouds and other particulate matter do reflect some sunlight.
No object in nature is a perfect blackbody but many opaque objects behave like a blackbody so it is a very good approximation and we can use some fairly simple math to learn more about the object. As mentioned above, blackbody radiation is not emitted at just one wavelength or one part of the EM spectrum, but covers all wavelengths. At first this may sound strange -- since humans act like blackbodies, does that mean that our bodies emit dangerous X rays and gamma rays? No, that is not the case (I don't have X ray eyes) and any blackbody emits the most intense radiation at one particular wavelength. Humans have a typical temperature of 98.6°F (or 310 K) and emit the most intense radiation at 9.3 microns (an infrared wavelength, meaning we radiate heat!). The peak wavelength of the radiation that a blackbody gives off depends only on its temperature. This means two very different objects with the same temperature emit identically with the same wavelength of peak intensity. The Earth is just a little bit cooler than a human at 288 K, and its most intense radiation is at 10.1 microns. This relationship between the temperature of a blackbody and its peak wavelength is called Wien's Law and is:
[latex]\lambda_{\rm max} = \frac{ 0.0029 }{T} \rm{~m ~K}[/latex]
where the wavelength is in meters and the temperature is in K (the constant 0.0029 has units of m × K). You can easily verify λmax for a human at 310 K: (0.0029 m K)/(310 K) = 9.3×10⁻⁶ m = 9.3 microns.
The thermal radiation emitted by any blackbody shows a similar shape in the intensity of light at different wavelengths. These shapes are called blackbody curves or thermal energy curves. Figure 9 shows this general shape for blackbody curves for objects of different temperatures. The shape is similar for all temperatures but notice that the intensity for each blackbody curve peaks at a different maximum wavelength.
Notice in Figure 9 that the curves show that, at each temperature, the blackbody objects emit radiation at all wavelengths (all colors) but that the most energy is emitted at a peak wavelength. Physically, this peak corresponds to the average speed of atoms or molecules inside the object, which is a manifestation of its temperature.
The hotter the object, the shorter the peak wavelength -- the object at 5500 K has a shorter λmax (530 nm) than the object at 2500 K (which has λmax of 1160 nm and is in the infrared portion of the EM spectrum). It makes sense, then, that hot objects give off a larger fraction of their energy at shorter wavelengths (higher energies) than do cool objects. You may have observed examples of this rule in everyday life. When a burner on an electric stove is turned on low, it emits only heat, which is infrared radiation, but does not glow with visible light. If the burner is set to a higher temperature, it starts to glow a dull red. At a still-higher setting, it glows a brighter orange-red (shorter wavelength). At even higher temperatures, which cannot be reached with ordinary stoves, metal can appear brilliant yellow or even blue-white.
We can use these ideas to come up with a thermometer for measuring the temperatures of stars. Because many stars give off most of their energy in visible light, the color of light that dominates a star’s appearance is an indicator of its temperature. If one star looks red and another looks blue, which one has the higher temperature? Because blue is the shorter-wavelength color, it is the sign of a hotter star. (Note that the temperatures we associate with different colors in science are not the same as the ones artists use. In art, red is often called a “hot” color and blue a “cool” color. Likewise, we commonly see red on faucet or air conditioning controls to indicate hot temperatures and blue to indicate cold temperatures. Although these are common uses to us in daily life, in nature, it’s the other way around.)
What about the Sun? The Sun has a surface temperature of 5800 K so Wien's law immediately tells us that λmax is 500 nm. Which corresponds to green light. But the Sun doesn't look green, it looks yellow or white! What's going on?! This makes sense when you consider that the Sun is also emitting red light and blue light; these all mix together as a nearly white color. Pure purple stars are also never seen for similar reasons -- the blue and violet mix into a more deep blue color.
C0lor Temperature
Different wavelengths (or frequencies) of light correspond to different colors. But what exactly is color? Is it a property of an object, like its size, or is it something that our brains perceive? Our eyes receive light, which is sent to the brain for processing. When we look at an object, we are seeing the light that is reflected off that object. If there is no light in the room, then we do not see anything at all. When light strikes an object, some of the light is reflected and some of it is absorbed. Human eyes have evolved to see visible light; some other animals, such as birds, can see ultraviolet light! Photoreceptors called cones in the retina of our eyes are sensitive to red, blue, and green light. In that sense, every color can be broken down into a combination of red, blue, and green. This is why television only needs those three colors to accurately simulate reality. In low light conditions, rods in the retina take over and are only sensitive to one color; hence, we see shades of gray.
The Sun emits white light, which contains all colors. As an example, let’s consider what happens when sunlight strikes a house painted red. The white light hits the red house, and only red light is reflected to our eyes; all of the other colors are absorbed by the paint molecules. Pigments are substances that selectively absorb very specific wavelengths of light, leaving only the desired wavelength of light reflected.
How does the color emitted by an object relate to its temperature? Wien’s law gives a mathematical relationship for this and shows that the temperature of a blackbody is inversely proportional to the wavelength of the light emitted. As a more visual example, consider a piece of metal being heated up. First it will turn a dull red color, then orange to white, and eventually it becomes blue when it is hottest. The scale is shown in Figure 10, where the temperatures are in Kelvin.
Light bulbs are designed with color temperature in mind. This is likely a familiar concept to photographers when selecting back lighting for a shoot. For a "candlelight" type background, a bulb of around 2000 K will be best, while a "natural daylight" background is best achieved with a bulb at 4500 K. Most fluorescent light bulbs in classrooms are around 5000 K while those in a library will be closer to 3000 K.
Luminosity and Brightness
Wien's Law shows that blackbodies, like stars, emit the most intense radiation at a specific wavelength, λmax. What exactly is this intensity a measure of?
Luminosity is the total amount of energy that an object (like a star) puts out each second. It has dimensional units of energy per second. In the same way that a 100 W bulb will always put out 100 Watts whether we are standing close or farther away, the luminosity of a star does not depend on our distance from it.
However, astronomers do not measure luminosity directly with a telescope; they measure brightness: the luminosity that is intercepted by a detector such as a photographic plate or a digital camera. If you imagine a spherical surface - a bubble - around a star, then the luminosity is the integrated (total) light from the surface of that bubble. The brightness, which is the luminosity per unit area, decreases as the surface area of the spherical volume increases. This is the same phenomenon that happens with expanding balloons. The balloon has a certain amount of material, usually latex or rubber. Analogous to luminosity, that amount of material is constant, no matter how much air is in the balloon. However, as the balloon expands, that constant amount of material is stretched over a larger surface area. The walls of the balloon get thinner and the amount of material per unit area decreases. The luminosity of a star is constant. The brightness that we measure depends on whether we are "up close" or far away from the star.
This is shown in Figure 11, where the light from a star with luminosity L spreads out into spheres of increasing surface area as it travels away from the star. At a distance d from the star, we can measure the brightness ($B$) by dividing the total power emitted by the star (L) by the surface area of the sphere that the light has now spread into:
[latex]B = \frac{L}{4 \pi d^2}[/latex]
This idea—that the apparent brightness of a source (how bright it looks to us) gets weaker with distance in the way we have described—is shown in Figure 11 below. At point 1, the light is concentrated into one box. By the time the light reaches point 2, which is twice as far as point 1, it is now spread out into four squares.
Concept Check: Brightness and distances of stars
You observe two stars, named Sol-2 and Sol-3, that have the exact same luminosity as the Sun (this means they have the same temperature, radius, and luminosity as the Sun). You measure the brightness of both stars with the same instrument and find that the light from Sol-2 is twenty-five times brighter than the light from Sol-3. Which star is closer to the Earth and by how much? Explain your reasoning.
Show Answer
Ans: Sol-2 is five times closer than Sol-3. Brightness drops as the distance squared, so the ratio of the distances to Sol-2 and Sol-3 is given by [latex]\sqrt{B_{Sol2}/B_{Sol3}}[/latex] or [latex]\sqrt{25}[/latex] = 5.
Let's consider the luminosity of the Sun and the amount of energy from the Sun that reaches the Earth. This will be important to know when we study exoplanets and want to know how much light from the host star reaches the exoplanet. The luminosity of the Sun is 3.9×1026 W -- in other words, it emits the same amount of power as 3.9×1024 100 W light bulbs (or 39 trillion trillion 100 W bulbs!). As the light travels away from the Sun, it is spread out more and more, as all of that light needs to cover spheres (bubbles) that have greater surface area. The distance from the Earth to the Sun is 151 million km, or 1.51×10¹¹ m. Putting this value into the brightness equation, we find that we receive 1360 W/m2 of sunlight on the Earth. That means every 1 m2 patch on the Earth, which is about the size of a standard chess board, receives 1360 Joules of energy every second. Venus is closer to the Sun than the Earth and receives more energy for every square meter, 2600 W/m2, while Mars is further and receives only 600 W/m2.
Worked Example: Calculating the energy received from the Sun
How much radiation from the Sun is received at Saturn's moon Titan? You can assume that Titan and Saturn are at the same distance from Earth.
We can find the value by using the relationship for brightness, luminosity and distance:
[latex]B = \frac{L}{4 \pi d^2}[/latex]
Here, L is the luminosity of the Sun and d is the distance of Titan from the Sun. The distance from the Sun to Titan (Saturn) is 1.45 billion km (or 1.45×10¹² m).
B = (3.9×1026 W)/(4 π (1.45×10¹² m)2) = 14.8 W/m2
This makes sense -- Saturn is almost 10 times further from the Sun than the Earth (Earth is 1 AU and Saturn is 9.57 AU), so the value should be significantly lower than Earth's. [In fact, you could also find this value by taking the ratio (1/9.57)2 and multiplying by 1360 W/m2]
Show mathematically that the Earth receives 1360 W/m2 from the Sun.
Show Answer
The only difference here is the distance: now it is the distance from the Earth to the Sun, which is 151 million km.
B = (3.9×1026 W)/(4 π (1.51×10¹¹ m)2) = 1361 W/m2
Spectroscopy
Light from objects is filled with information. By taking the light from an object and splitting it apart into a spectrum, we can decode this light. Spectroscopy is a fundamental tool for astrobiology and allows us to detect exoplanets and study the chemical makeup of their atmospheres.
The most familiar example of spectroscopy is the rainbow of colors that is produced when white light is sent through a prism, as seen in Figure 1. A water droplet can also split up (or disperse) light and create a rainbow when a light beam passes through it. Both prisms and water droplets can serve as spectrometers or spectrographs -- tools used to disperse light into a spectrum.
Stars emit all types of electromagnetic radiation but emit the most intense light at a specific wavelength (see Wien's Law). Note that infrared and ultraviolet light are also emitted by the Sun and are split out as seen in Figure 1 -- our eyes just can't perceive these types of radiation. The distribution of colors, which is naturally organized by wavelength (or frequency), is called a spectrum. There are three main types of spectra: continuous, absorption, and emission as shown in Figure 2. If the shape of the spectrum on the bottom left of Figure 2 looks familiar, it is because you have seen it before when learning about blackbody (thermal) radiation curves.
A continuous spectrum looks like the rainbow shown in Figure 1. However, sunlight that reaches the Earth actually is an absorption spectrum, not a continuous spectrum. Why? The Sun does emit a continuous spectrum from its core but some of that light is absorbed by different atoms as it passes through the Sun's atmosphere. This is shown in Figure 2. On the left, the Sun emits a continuous spectrum at its surface. But that light passes through the atmosphere (the cloud of gas in the middle) and some of that light is absorbed by atoms in the gas. The spectrum on the right is the type of spectrum seen for the Sun, where the dark lines correspond to the wavelengths associated with the atoms or molecules that absorbed the light. Figure 3 shows an absorption spectrum for the Sun, with some of the atoms and molecules present in the Sun's atmosphere labeled. This spectrum was taken from the Earth's surface, so the O2 (molecular oxygen) lines are from Earth's atmosphere.
What does it mean to say "the wavelengths associated with the atoms"? Every element on the periodic table has a different number of protons and thus a different structure. Hydrogen is the simplest atom, with just one proton and one electron orbiting the proton in a neutral atom. To get the electron out of the hydrogen atom entirely requires a certain amount of energy. If there is no energy supplied to the atom, it is stable and the electron is in what we call the ground state of energy. However, the electron can move to different energy levels above the ground state -- imagine rungs on a ladder, with the ground state at the bottom and the top rung being the amount of energy needed to kick the electron out of the atom. Hydrogen has a unique set of energy levels and each level has an exact amount of energy. And recall that this energy has an exact frequency or wavelength given by [latex]E=hf = h c/\lambda[/latex]. When light particles (photons) with exactly one of those wavelengths encounters the atom, it is absorbed. And every element has a different set of energy levels, meaning a distinct set of its own characteristic wavelengths. We thus have a very powerful way of learning which elements are inside a star's atmosphere.
Using the unique pattern of an element to identify whether it is inside of an atmosphere is similar to DNA barcoding used in forensics to identify a match to evidence at a crime scene. Figure 4 shows an example of some of the colors (wavelengths) for a few different elements. No two are the same and we can use these patterns to identify an element in a star or planet's atmosphere. This same technique is used extensively in biochemistry and many other scientific fields. We can think of the unique emission lines associated with an atom or molecule as its chemical fingerprint.
The middle part of Figure 2 shows the physical idea of how an emission spectrum is created. Let's say you have a gas made from atoms of just one type of element. If you heat up that gas, the electrons can move up to higher energy levels and then drop back down, emitting light in the process. This is almost the same situation as the absorption spectrum on the left except we are not looking at the continuous source and the gas but instead just at the gas...so there is no continuous spectrum in the background, just the bright lines that correspond to whatever element is in the gas. The atom is emitting energy at the unique set of wavelengths (colors) for that particular element. Of course, the gas can contain many different atoms and molecules at the same time.
You can take a look at the fingerprints for some other elements using the simulation below. Click on any element to see its unique set of spectral lines. Notice that you can choose to see both absorption (top) and emission (bottom) spectra.
Key Concepts and Summary
The energy of light is our messenger about the universe. Different colors of light are simply different wavelengths and different wavelengths of light contain different amounts of energy. The longest wavelengths in the electromagnetic spectrum are radio waves and these have the lowest energy. The shortest wavelengths are high energy gamma rays. Unsurprisingly, the visible band of light (where our brain interprets different wavelengths as different colors) matches the key energy output of the Sun - we evolved to optimally navigate this range of energies. By observing the universe with detectors that are sensitive to different energies of light, we can learn about the energy output and the peak temperatures of the objects we detect. Because the brightness of a star or other celestial object decreases with distance, a measurement of distance is needed to back out luminosity (energy per second). The wavelengths of light encode the energy and chemical composition of stars and other celestial bodies - astronomers use spectrographs to disperse light collected at a telescope into a spectrum. Objects emit a continuous (sometimes called "blackbody") spectrum with an intensity distribution that depends on temperature. When atomic transitions take place in cooler outer layers of stars, the spectrum can also have absorption or emission lines. Absorption lines occur when atoms absorb photons of light pushing electrons to a higher energy state. Emission lines occur when atoms release photons and the electrons cascade to a lower energy state.
Review Questions
Summary Questions
- What is energy? Describe two different kinds of energy and give examples of each.
- What does it mean to say the energy is "conserved"?
- How are the frequency and wavelength of light related to each other?
- What is a photon?
- Which property of light determine how much energy a photon has?
- What are the seven main parts of the electromagnetic spectrum? For each band (part), give an example of a source of that type of radiation.
- How does the type of light emitted by an object depend on its temperature?
- What is the difference between the brightness of an object (such as a star) and its luminosity?
- How does the total amount of energy emitted differ for hot and cold objects?
- How does spectroscopy give information about an object? What happens when starlight passes through a prism?
- What are the differences between continuous, absorption and emission spectra? What are the similarities between all three?
- Why are the spectral lines for an element sometimes called “chemical fingerprints”?
Activities
- Understanding blackbody radiation. Open the simulation at https://phet.colorado.edu/sims/html/blackbody-spectrum/latest/blackbody-spectrum_en.html.
- The default is set to the temperature of the Sun. Click on the "labels" box to show different parts of the EM spectrum (UV, visible, and infrared). What part of the EM spectrum has the most intense light from the Sun.
- Now set the thermometer to the temperature of the star Sirius. The y-axis now needs to be rescaled to see the value for the peak intensity, Adjust this by using the zoom out button. Once you can see the peak, click on the "Graph Values" box. What is the wavelength of the peak intensity light for Sirius?
- Energy flux. Calculate the solar flux (in W/m2) at the planet Mercury.
The light and other kinds of radiation that reach us from objects in the universe encode a wide range of information about what those objects are like and how they work. If we can decipher this code and read the messages it contains, we can learn an enormous amount about the cosmos without ever having to leave Earth or its immediate environment.
Learning Objectives
By the end of this chapter, you will be able to:
- Explain how and why the light emitted by an object depends on its temperature
- Explain the difference between the luminosity and brightness of an object
- Explain how the total energy emitted differs for hot and cold objects
- Describe how spectroscopy can provide information about an object, such as a star.
- Discuss the difference between continuous, absorption and emission spectra.
Some astronomical objects emit mostly infrared radiation, others mostly visible light, and still others mostly ultraviolet radiation. What determines the type of electromagnetic radiation emitted by the Sun, stars, and other dense astronomical objects? The answer often turns out to be their temperature.
At the microscopic level, everything in nature is in motion. A solid is composed of molecules and atoms in continuous vibration: they move back and forth in place, but their motion is much too small for our eyes to make out. A gas consists of atoms or molecules that are flying about freely at high speed, continually bumping into one another and bombarding the surrounding matter. The hotter the solid or gas, the faster the motion of its atoms or molecules. The temperature of something is thus a measure of the average motion energy of the particles that make it up.
This motion at the microscopic level is responsible for much of the EM radiation on Earth and in the universe. As atoms and molecules move about and collide, or vibrate in place, their electrons give off EM radiation. The characteristics of this radiation are determined by the temperature of those atoms and molecules. In a hot material, for example, the individual particles vibrate in place or move rapidly from collisions, so the emitted waves are, on average, more energetic. And recall that higher energy waves have a higher frequency. In cooler materials, the particles have lower energy atomic and molecular motions and thus generate lower energy waves.
Blackbody Radiation and Wien's Law
To further understand the relationship between temperature and light (EM radiation), we consider a type of ideal object called a blackbody. A blackbody absorbs all light that hits it; none of the incoming light is reflected away or passes through the object. The object heats up and gains energy; the object then loses this energy by emitting light at all wavelengths (recall that light is a type of energy). In other words, the object cools off until it reaches the same temperature as its surroundings -- this is called thermodynamic equilibrium -- and it does this by converting the energy it absorbed into energy of motion that is radiated in a specific way (this radiated energy is called thermal or blackbody radiation). A glowing ember of coal cools by radiating energy until it reaches the same temperature as its environment.
Any dense, solid object that has a temperature emits blackbody radiation; this includes people, animals, stove tops, light bulbs, stars and planets. For example, the Earth absorbs EM radiation from the Sun, heats up, and then emits radiation as mostly infrared light. Note that any objects that reflect light, such as a book with a red cover, are not blackbodies. Similarly, if light passes through the object, as with a glass table, it is also not a blackbody. In that respect, the Earth is not a perfect blackbody, since clouds and other particulate matter do reflect some sunlight.
No object in nature is a perfect blackbody but many opaque objects behave like a blackbody so it is a very good approximation and we can use some fairly simple math to learn more about the object. As mentioned above, blackbody radiation is not emitted at just one wavelength or one part of the EM spectrum, but covers all wavelengths. At first this may sound strange -- since humans act like blackbodies, does that mean that our bodies emit dangerous X rays and gamma rays? No, that is not the case (I don't have X ray eyes) and any blackbody emits the most intense radiation at one particular wavelength. Humans have a typical temperature of 98.6°F (or 310 K) and emit the most intense radiation at 9.3 microns (an infrared wavelength, meaning we radiate heat!). The peak wavelength of the radiation that a blackbody gives off depends only on its temperature. This means two very different objects with the same temperature emit identically with the same wavelength of peak intensity. The Earth is just a little bit cooler than a human at 288 K, and its most intense radiation is at 10.1 microns. This relationship between the temperature of a blackbody and its peak wavelength is called Wien's Law and is:
[latex]\lambda_{\rm max} = \frac{ 0.0029 }{T} \rm{~m ~K}[/latex]
where the wavelength is in meters and the temperature is in K (the constant 0.0029 has units of m × K). You can easily verify λmax for a human at 310 K: (0.0029 m K)/(310 K) = 9.3×10⁻⁶ m = 9.3 microns.
The thermal radiation emitted by any blackbody shows a similar shape in the intensity of light at different wavelengths. These shapes are called blackbody curves or thermal energy curves. Figure 9 shows this general shape for blackbody curves for objects of different temperatures. The shape is similar for all temperatures but notice that the intensity for each blackbody curve peaks at a different maximum wavelength.
Notice in Figure 9 that the curves show that, at each temperature, the blackbody objects emit radiation at all wavelengths (all colors) but that the most energy is emitted at a peak wavelength. Physically, this peak corresponds to the average speed of atoms or molecules inside the object, which is a manifestation of its temperature.
The hotter the object, the shorter the peak wavelength -- the object at 5500 K has a shorter λmax (530 nm) than the object at 2500 K (which has λmax of 1160 nm and is in the infrared portion of the EM spectrum). It makes sense, then, that hot objects give off a larger fraction of their energy at shorter wavelengths (higher energies) than do cool objects. You may have observed examples of this rule in everyday life. When a burner on an electric stove is turned on low, it emits only heat, which is infrared radiation, but does not glow with visible light. If the burner is set to a higher temperature, it starts to glow a dull red. At a still-higher setting, it glows a brighter orange-red (shorter wavelength). At even higher temperatures, which cannot be reached with ordinary stoves, metal can appear brilliant yellow or even blue-white.
We can use these ideas to come up with a thermometer for measuring the temperatures of stars. Because many stars give off most of their energy in visible light, the color of light that dominates a star’s appearance is an indicator of its temperature. If one star looks red and another looks blue, which one has the higher temperature? Because blue is the shorter-wavelength color, it is the sign of a hotter star. (Note that the temperatures we associate with different colors in science are not the same as the ones artists use. In art, red is often called a “hot” color and blue a “cool” color. Likewise, we commonly see red on faucet or air conditioning controls to indicate hot temperatures and blue to indicate cold temperatures. Although these are common uses to us in daily life, in nature, it’s the other way around.)
What about the Sun? The Sun has a surface temperature of 5800 K so Wien's law immediately tells us that λmax is 500 nm. Which corresponds to green light. But the Sun doesn't look green, it looks yellow or white! What's going on?! This makes sense when you consider that the Sun is also emitting red light and blue light; these all mix together as a nearly white color. Pure purple stars are also never seen for similar reasons -- the blue and violet mix into a more deep blue color.
C0lor Temperature
Different wavelengths (or frequencies) of light correspond to different colors. But what exactly is color? Is it a property of an object, like its size, or is it something that our brains perceive? Our eyes receive light, which is sent to the brain for processing. When we look at an object, we are seeing the light that is reflected off that object. If there is no light in the room, then we do not see anything at all. When light strikes an object, some of the light is reflected and some of it is absorbed. Human eyes have evolved to see visible light; some other animals, such as birds, can see ultraviolet light! Photoreceptors called cones in the retina of our eyes are sensitive to red, blue, and green light. In that sense, every color can be broken down into a combination of red, blue, and green. This is why television only needs those three colors to accurately simulate reality. In low light conditions, rods in the retina take over and are only sensitive to one color; hence, we see shades of gray.
The Sun emits white light, which contains all colors. As an example, let’s consider what happens when sunlight strikes a house painted red. The white light hits the red house, and only red light is reflected to our eyes; all of the other colors are absorbed by the paint molecules. Pigments are substances that selectively absorb very specific wavelengths of light, leaving only the desired wavelength of light reflected.
How does the color emitted by an object relate to its temperature? Wien’s law gives a mathematical relationship for this and shows that the temperature of a blackbody is inversely proportional to the wavelength of the light emitted. As a more visual example, consider a piece of metal being heated up. First it will turn a dull red color, then orange to white, and eventually it becomes blue when it is hottest. The scale is shown in Figure 10, where the temperatures are in Kelvin.
Light bulbs are designed with color temperature in mind. This is likely a familiar concept to photographers when selecting back lighting for a shoot. For a "candlelight" type background, a bulb of around 2000 K will be best, while a "natural daylight" background is best achieved with a bulb at 4500 K. Most fluorescent light bulbs in classrooms are around 5000 K while those in a library will be closer to 3000 K.
Luminosity and Brightness
Wien's Law shows that blackbodies, like stars, emit the most intense radiation at a specific wavelength, λmax. What exactly is this intensity a measure of?
Luminosity is the total amount of energy that an object (like a star) puts out each second. It has dimensional units of energy per second. In the same way that a 100 W bulb will always put out 100 Watts whether we are standing close or farther away, the luminosity of a star does not depend on our distance from it.
However, astronomers do not measure luminosity directly with a telescope; they measure brightness: the luminosity that is intercepted by a detector such as a photographic plate or a digital camera. If you imagine a spherical surface - a bubble - around a star, then the luminosity is the integrated (total) light from the surface of that bubble. The brightness, which is the luminosity per unit area, decreases as the surface area of the spherical volume increases. This is the same phenomenon that happens with expanding balloons. The balloon has a certain amount of material, usually latex or rubber. Analogous to luminosity, that amount of material is constant, no matter how much air is in the balloon. However, as the balloon expands, that constant amount of material is stretched over a larger surface area. The walls of the balloon get thinner and the amount of material per unit area decreases. The luminosity of a star is constant. The brightness that we measure depends on whether we are "up close" or far away from the star.
This is shown in Figure 11, where the light from a star with luminosity L spreads out into spheres of increasing surface area as it travels away from the star. At a distance d from the star, we can measure the brightness ($B$) by dividing the total power emitted by the star (L) by the surface area of the sphere that the light has now spread into:
[latex]B = \frac{L}{4 \pi d^2}[/latex]
This idea—that the apparent brightness of a source (how bright it looks to us) gets weaker with distance in the way we have described—is shown in Figure 11 below. At point 1, the light is concentrated into one box. By the time the light reaches point 2, which is twice as far as point 1, it is now spread out into four squares.
Concept Check: Brightness and distances of stars
You observe two stars, named Sol-2 and Sol-3, that have the exact same luminosity as the Sun (this means they have the same temperature, radius, and luminosity as the Sun). You measure the brightness of both stars with the same instrument and find that the light from Sol-2 is twenty-five times brighter than the light from Sol-3. Which star is closer to the Earth and by how much? Explain your reasoning.
Show Answer
Ans: Sol-2 is five times closer than Sol-3. Brightness drops as the distance squared, so the ratio of the distances to Sol-2 and Sol-3 is given by [latex]\sqrt{B_{Sol2}/B_{Sol3}}[/latex] or [latex]\sqrt{25}[/latex] = 5.
Let's consider the luminosity of the Sun and the amount of energy from the Sun that reaches the Earth. This will be important to know when we study exoplanets and want to know how much light from the host star reaches the exoplanet. The luminosity of the Sun is 3.9×1026 W -- in other words, it emits the same amount of power as 3.9×1024 100 W light bulbs (or 39 trillion trillion 100 W bulbs!). As the light travels away from the Sun, it is spread out more and more, as all of that light needs to cover spheres (bubbles) that have greater surface area. The distance from the Earth to the Sun is 151 million km, or 1.51×10¹¹ m. Putting this value into the brightness equation, we find that we receive 1360 W/m2 of sunlight on the Earth. That means every 1 m2 patch on the Earth, which is about the size of a standard chess board, receives 1360 Joules of energy every second. Venus is closer to the Sun than the Earth and receives more energy for every square meter, 2600 W/m2, while Mars is further and receives only 600 W/m2.
Worked Example: Calculating the energy received from the Sun
How much radiation from the Sun is received at Saturn's moon Titan? You can assume that Titan and Saturn are at the same distance from Earth.
We can find the value by using the relationship for brightness, luminosity and distance:
[latex]B = \frac{L}{4 \pi d^2}[/latex]
Here, L is the luminosity of the Sun and d is the distance of Titan from the Sun. The distance from the Sun to Titan (Saturn) is 1.45 billion km (or 1.45×10¹² m).
B = (3.9×1026 W)/(4 π (1.45×10¹² m)2) = 14.8 W/m2
This makes sense -- Saturn is almost 10 times further from the Sun than the Earth (Earth is 1 AU and Saturn is 9.57 AU), so the value should be significantly lower than Earth's. [In fact, you could also find this value by taking the ratio (1/9.57)2 and multiplying by 1360 W/m2]
Show mathematically that the Earth receives 1360 W/m2 from the Sun.
Show Answer
The only difference here is the distance: now it is the distance from the Earth to the Sun, which is 151 million km.
B = (3.9×1026 W)/(4 π (1.51×10¹¹ m)2) = 1361 W/m2
Spectroscopy
Light from objects is filled with information. By taking the light from an object and splitting it apart into a spectrum, we can decode this light. Spectroscopy is a fundamental tool for astrobiology and allows us to detect exoplanets and study the chemical makeup of their atmospheres.
The most familiar example of spectroscopy is the rainbow of colors that is produced when white light is sent through a prism, as seen in Figure 1. A water droplet can also split up (or disperse) light and create a rainbow when a light beam passes through it. Both prisms and water droplets can serve as spectrometers or spectrographs -- tools used to disperse light into a spectrum.
Stars emit all types of electromagnetic radiation but emit the most intense light at a specific wavelength (see Wien's Law). Note that infrared and ultraviolet light are also emitted by the Sun and are split out as seen in Figure 1 -- our eyes just can't perceive these types of radiation. The distribution of colors, which is naturally organized by wavelength (or frequency), is called a spectrum. There are three main types of spectra: continuous, absorption, and emission as shown in Figure 2. If the shape of the spectrum on the bottom left of Figure 2 looks familiar, it is because you have seen it before when learning about blackbody (thermal) radiation curves.
A continuous spectrum looks like the rainbow shown in Figure 1. However, sunlight that reaches the Earth actually is an absorption spectrum, not a continuous spectrum. Why? The Sun does emit a continuous spectrum from its core but some of that light is absorbed by different atoms as it passes through the Sun's atmosphere. This is shown in Figure 2. On the left, the Sun emits a continuous spectrum at its surface. But that light passes through the atmosphere (the cloud of gas in the middle) and some of that light is absorbed by atoms in the gas. The spectrum on the right is the type of spectrum seen for the Sun, where the dark lines correspond to the wavelengths associated with the atoms or molecules that absorbed the light. Figure 3 shows an absorption spectrum for the Sun, with some of the atoms and molecules present in the Sun's atmosphere labeled. This spectrum was taken from the Earth's surface, so the O2 (molecular oxygen) lines are from Earth's atmosphere.
What does it mean to say "the wavelengths associated with the atoms"? Every element on the periodic table has a different number of protons and thus a different structure. Hydrogen is the simplest atom, with just one proton and one electron orbiting the proton in a neutral atom. To get the electron out of the hydrogen atom entirely requires a certain amount of energy. If there is no energy supplied to the atom, it is stable and the electron is in what we call the ground state of energy. However, the electron can move to different energy levels above the ground state -- imagine rungs on a ladder, with the ground state at the bottom and the top rung being the amount of energy needed to kick the electron out of the atom. Hydrogen has a unique set of energy levels and each level has an exact amount of energy. And recall that this energy has an exact frequency or wavelength given by [latex]E=hf = h c/\lambda[/latex]. When light particles (photons) with exactly one of those wavelengths encounters the atom, it is absorbed. And every element has a different set of energy levels, meaning a distinct set of its own characteristic wavelengths. We thus have a very powerful way of learning which elements are inside a star's atmosphere.
Using the unique pattern of an element to identify whether it is inside of an atmosphere is similar to DNA barcoding used in forensics to identify a match to evidence at a crime scene. Figure 4 shows an example of some of the colors (wavelengths) for a few different elements. No two are the same and we can use these patterns to identify an element in a star or planet's atmosphere. This same technique is used extensively in biochemistry and many other scientific fields. We can think of the unique emission lines associated with an atom or molecule as its chemical fingerprint.
The middle part of Figure 2 shows the physical idea of how an emission spectrum is created. Let's say you have a gas made from atoms of just one type of element. If you heat up that gas, the electrons can move up to higher energy levels and then drop back down, emitting light in the process. This is almost the same situation as the absorption spectrum on the left except we are not looking at the continuous source and the gas but instead just at the gas...so there is no continuous spectrum in the background, just the bright lines that correspond to whatever element is in the gas. The atom is emitting energy at the unique set of wavelengths (colors) for that particular element. Of course, the gas can contain many different atoms and molecules at the same time.
You can take a look at the fingerprints for some other elements using the simulation below. Click on any element to see its unique set of spectral lines. Notice that you can choose to see both absorption (top) and emission (bottom) spectra.
Key Concepts and Summary
By observing the universe with detectors that are sensitive to different energies of light, we can learn about the energy output and the peak temperatures of the objects we detect. Because the brightness of a star or other celestial object decreases with distance, a measurement of distance is needed to back out luminosity (energy per second). The wavelengths of light encode the energy and chemical composition of stars and other celestial bodies - astronomers use spectrographs to disperse light collected at a telescope into a spectrum. Objects emit a continuous (sometimes called "blackbody") spectrum with an intensity distribution that depends on temperature. When atomic transitions take place in cooler outer layers of stars, the spectrum can also have absorption or emission lines. Absorption lines occur when atoms absorb photons of light pushing electrons to a higher energy state. Emission lines occur when atoms release photons and the electrons cascade to a lower energy state.
Review Questions
Summary Questions
- How does the type of light emitted by an object depend on its temperature?
- What is the difference between the brightness of an object (such as a star) and its luminosity?
- How does the total amount of energy emitted differ for hot and cold objects?
- How does spectroscopy give information about an object? What happens when starlight passes through a prism?
- What are the differences between continuous, absorption and emission spectra? What are the similarities between all three?
- Why are the spectral lines for an element sometimes called “chemical fingerprints”?
Activities
- Understanding blackbody radiation. Open the simulation at https://phet.colorado.edu/sims/html/blackbody-spectrum/latest/blackbody-spectrum_en.html.
- The default is set to the temperature of the Sun. Click on the "labels" box to show different parts of the EM spectrum (UV, visible, and infrared). What part of the EM spectrum has the most intense light from the Sun.
- Now set the thermometer to the temperature of the star Sirius. The y-axis now needs to be rescaled to see the value for the peak intensity, Adjust this by using the zoom out button. Once you can see the peak, click on the "Graph Values" box. What is the wavelength of the peak intensity light for Sirius?
- Energy flux. Calculate the solar flux (in W/m2) at the planet Mercury.
Life needs a source of energy to thrive. This energy can come in different forms, from sunlight to energy released when chemicals react. Light is a type of pure energy.
Learning Objectives
By the end of this chapter, you will be able to:
- Understand that there are different types of energy and that energy is conserved
- Explain the wavelength, frequency and energy of a wave or particle of light
- Discuss the different parts of the electromagnetic spectrum
Energy
Different types of energy are all around us -- the electrical energy that powers our technology, the chemical energy that is stored in the food we eat, and the heat energy we feel when when walking in sunlight. These different types of energy can be changed, or converted, from one type to another. For example, the chemical energy in food is converted to energy that allows us to think and move around. We will see other examples of energy transformations in astrobiology, such as the gravitational energy that is converted into heat when a giant cloud of gas and dust collapses and eventually forms stars.
The amount of the energy in the universe is always the same and it is continuously being changed from one form into another. This is the essence of the law of conservation of energy. Other quantities in nature, such as mass and momentum, are also conserved.
Though energy cannot be created or destroyed, it can be transformed into different forms. The two main forms of energy are kinetic energy and potential energy. Kinetic energy is the energy of motion. When an object is moving more quickly, it has more energy. A fast-moving car has more energy than a slow moving car. Thermal energy is actually a form of kinetic energy since higher temperature is really a measure of the average speed of atoms and molecules -- the higher the temperature, the greater the kinetic energy of the atoms and molecules.
Potential energy is the energy that is associated with different positions in space. When you throw a ball high into the air, it has more gravitational potential energy than when it is held in your hand. When an object moves from an area of high potential energy to low potential energy, that energy will be transformed into another form. For example, when an apple falls to the Earth, it will speed up gaining kinetic energy. But potential energy does not need to be related just to gravity. For example, the energy stored in chemicals is in the form of chemical potential energy which can be determined based on the position of different atoms bonded to each other by electric forces of attraction.
A more recently discovered form of energy is the energy associated with mass itself. Einstein's famous equation [latex]E=mc^2[/latex] tells us, that mass-energy equivalence is a fundamental feature of the universe. Any object that has mass therefore also contains energy -- this type of energy is called rest-mass energy. Inside the core of stars, nuclear fusion converts some of the rest-mass of two protons into energy. This process occurs an astounding 1038 times every second and is the source of the energy from the Sun that we receive on Earth.
Light
A great deal of the energy that life on Earth uses comes in one way or another from the Sun's light, although geothermal energy from inside the Earth can also be harnessed. Light from the Sun, or any star, is an example of electromagnetic radiation. Here, the words light and radiation are synonymous, and both are a form of energy. Radiation can sometimes be thought of as dangerous and some types are (for example, gamma rays and X rays), but radiation is a neutral term and is synonymous with energy.
One of the more bizarre aspects of light is the way that it acts, specifically the fact that it can behave like a wave and a particle. In the 17th century, the nature of light was debated and both Isaac Newton and Christiaan Huygens tried to explain it. Newton experimented with lenses and prisms and believed that light was a stream of particles, which he called corpuscles. Huygens, on the other hand, believed that light was a wave that traveled outward in all directions from a source, much like the ripples on a pond that expand outward through the water after a stone is dropped into it. Building upon pioneering work by James Clerk Maxwell and Max Planck, Albert Einstein proposed in 1905 that light can indeed behave both ways, thus solidifying the concept of wave-particle duality, one of the tenets of quantum mechanics. The wave and particle nature of light has now been experimentally verified countless times.
Light as a Wave
Light carries energy and information from one place to another, and this energy is carried in the form of electromagnetic (EM) waves. Other familiar types of waves in nature include sound waves and water waves. All three of these types of waves have some differences and some similarities.
Water and sound waves are mechanical waves and require a medium to travel in. For sound waves, the medium is air and the medium is water for water waves. If you screamed on the surface of the Moon, which has no atmosphere, nobody would hear you as the sound waves have no medium to travel through. (The director Stanley Kubrick got it right in the film 2001: A Space Odyssey.) EM waves do not require water or air or any medium to travel though – they can travel through empty space. This was such a disturbing idea to nineteenth-century scientists that they actually made up a substance to fill all of space—one for which there was no evidence—just so light waves could have something to travel through: they called it the aether. Today, we know that there is no aether and that EM waves have no trouble at all moving through empty space (as all the starlight visible on a clear night must surely be doing).
The speed of a sound wave depends on the medium through which it is traveling. A sound wave moves faster through water than it does through air, for example. However, all electromagnetic waves move at the same speed in empty space (the speed of light—approximately 300,000 kilometers per second, or 300,000,000 meters per second, which can also be written as 3×10⁸ m/s), which turns out to be the fastest possible speed in the universe.
Now for some similarities. All waves are a kind of repeating phenomenon. Whether it is the up-and-down motion of a water wave or the changing electric and magnetic fields in a wave of light, the pattern of disturbance repeats in a cyclical way. Thus, any wave motion can be characterized by a series of crests and troughs. Moving from one crest through a trough to the next crest completes one cycle. The horizontal length covered by one cycle is called the wavelength (λ). Ocean waves provide an analogy: the wavelength is the distance that separates successive wave crests. An example of water waves created when a frog leaps into a pond is shown in Figure 1.
We can also characterize different waves by their frequency, which is the number of wave cycles that pass by per second. If you count 10 crests moving by each second, for example, then the frequency is 10 cycles per second (cps). In honor of Heinrich Hertz, the late nineteenth physicist who, inspired by physicist James Clerk Maxwell’s work, discovered radio waves, a cps is also called a hertz (Hz). Take a look at your radio, for example, and you will see the channel assigned to each radio station is characterized by its frequency, usually in units of kHz (kilohertz, or thousands of hertz) or MHz (megahertz, or millions of hertz).
Concept Check: Wavelength and Frequency
Figure 3 is a schematic showing the wavelengths and frequencies for different colors of light. Red light is at the top and its wavelength (λ) is shown as the distance between two peaks, where the peaks are marked by the vertical black lines. Blue light is on the bottom; notice that it has a shorter wavelength than red light (the length between the two peaks is noticeably shorter).
The frequency of a wave is a measure of how many waves pass by in one second. Let's imagine that the amount of time that elapsed for each of the waves in Figure 3 is 1 second. Looking at red light, two full waves can pass by in this 1 second period, so we say the frequency is 2 cycles per second, or 2 Hz. (Actually, a bit more than two red light wave cycles can pass by, about 2.5, but we will say 2 full waves to keep this example simple.)
- Which color of light has the highest frequency? How about the lowest frequency?
- Which color of light has the shortest wavelength?
Show Answer
- Looking at Figure 3, the most crests pass by in one second for blue light (6 Hz) while the fewest pass by for red light. Thus, blue light has the highest frequency and red light has the lowest.
- Since blue light has the highest frequency, it also has the shortest wavelength. It is easy to see in Figure 3 that λ is shortest for blue light.
Wavelength (λ) and frequency (f) are related because all electromagnetic waves travel at the same speed. The formula for this relationship can be expressed as follows: for any wave motion, the speed at which a wave moves equals the frequency times the wavelength. Waves with longer wavelengths have lower frequencies. Mathematically, we can express this as
[latex]c = \lambda f[/latex]
where the Greek letter for “l”—lambda, λ—is used to denote wavelength and c is the scientific symbol for the speed of light.
The electromagnetic wave model of light (as formulated by James Clerk Maxwell) was one of the great triumphs of nineteenth-century science. In 1887, when Heinrich Hertz actually made invisible electromagnetic waves (what today are called radio waves) on one side of a room and detected them on the other side, it ushered in a new era that led to the modern age of telecommunications. His experiment ultimately led to the technologies of television, cell phones, and today’s wireless networks around the globe.
Light as a Photon
By the beginning of the twentieth century, physicists had to reluctantly accept that sometimes light behaves more like a “particle”—or at least a self-contained packet of energy—than a wave. We call such a packet of electromagnetic energy a photon.
A photon carries a specific amount of energy. How much energy a photon has depends on its frequency. We can use the idea of energy to connect the photon and wave models. How much energy a photon has depends on its frequency. A low-energy radio wave has a low frequency, while a high-energy X-ray at your dentist’s office is a high-frequency wave. Among the colors of visible light, violet-light photons have the highest energy and red-light photons have the lowest.
Test whether the connection between photons and waves is clear to you. In the above example, which photon would have the longer wavelength as a wave: the radio wave or the X-ray? If you answered the radio wave, you are correct. Radio waves have a lower frequency, so the wave cycles are longer
The Electromagnetic Spectrum
Objects in the universe send out an enormous range of radiation, or light. Scientists call this range the electromagnetic (EM) spectrum, which are divided into a number of regions. The spectrum is shown in Figure 4, with some information about the waves in each part or band.
Looking at the EM spectrum in Figure 4, we see that:
- Gamma rays have the highest energy and radio waves have the lowest energy
- Radio waves have the longest wavelength and gamma rays have the shortest wavelength
- Radio waves have the highest frequency and gamma rays have the lowest frequency
These properties of light are summarized by the beautifully simple equation that relates the energy of a photon to its frequency (or wavelength), where h is Planck's constant:
[latex]E=hf[/latex]
This relationship shows the wave-particle duality of light, as the energy of photon (a particle of light) is directly related to its frequency (a wave property). Since h has a constant value, you can immediately get the energy of a particular color of light simply by knowing its frequency (or wavelength, which can be expressed as [latex]\lambda = c / f[/latex]).
Another property of light that has already been mentioned but is worth re-emphasizing is that all types of light travel at the speed of light. Since the speed of light is constant, all light travels at the same speed.
Worked Example: Frequency and Wavelength
Red light has a wavelength of about 650 nm and blue light has a wavelength of about 450 nm. Recall that nm is the abbreviation for nanometers.
What is the frequency of red light?
The frequency of any type of light is related to its wavelength as [latex]f = c / \lambda[/latex], where c is the speed of light.
To use this equation, we must be sure that the units are all consistent. If we use 3×10⁸ m/s for the speed of light, then the wavelength must be in units of meters and the frequency will be in units of Hz (where 1 Hz = 1 cycle per second). So, we must first convert the wavelength from nanometers into meters. One nanometer is one-billionth of a meter: 1 nm = 10-9 m so it follows that 650 nm = 650×10-9 m. Expressed in scientific notation, the wavelength of red light is 6.50×10⁻⁷ m.
[latex]f = c / \lambda[/latex] = (3×10⁸ m/s) ⁄ (6.50×10⁻⁷ m) = 461,538,461,538,461 Hz
That's a huge number of cycles in one second! Expressing this in scientific notation, f = 4.62×10¹⁴ Hz.
The wavelength of visible light (like red and blue) is often reported in THz, where T is the prefix one trillion, or 1012.
Extra 1: Show that the frequency can also be expressed as 462 THz.
Show Answer
The frequency 4.62×10¹⁴ Hz can also be written as 4.62×102×1012 Hz
4.62×102 = 462 and 1012 Hz = 1 THZ, so f = 462 THz
Extra 2: Show that the frequency of blue light (with a wavelength of 450 nm) is 666 THz.
Show Answer
[latex]f = c / \lambda[/latex] = (3×10⁸ m/s) ⁄ (4.50×10⁻⁷ m) = 6.66×10¹⁴ Hz = 666 THz
Types of Electromagnetic Radiation
Throughout our study of astrobiology, we will encounter all types of light. When we collect light using a camera or sensor on the Earth's surface, that light must first travel through the Earth's atmosphere before it reaches the ground. Depending on the type of light, some of it may be partially or completely absorbed by molecules in different parts of the Earth's atmosphere. This means that some types of telescopes need to be above the Earth's atmosphere in order to detect any light. Also, we will see that this absorbed light will show up as a kind of set of Earth's chemical fingerprints in any observations that contain the Earth's atmosphere; this is the basic idea behind biosignatures for life, and we will probe it more deeply in the exoplanet chapters.
The way that light is absorbed in Earth's atmosphere for each part of the EM spectrum is shown in Figure 5.
We highlight a few properties of each type of light that are of relevance to astrobiology, as well as what types of telescopes are used to study the universe in each type of light.
Radio Waves
Radio waves have the longest wavelengths of any type of radiation -- they can range from a few millimeters all they way up to hundreds of kilometers (for reference, Switzerland is about 300 km across). Radio waves have very low energies and are all around us in our everyday lives. On Earth, cell phones, radio and TV transmissions, satellites and radar all emit radio waves and these pass right through our bodies. Radio waves are also produced in nature by a number of astrophysical objects, including stars and pulsars. The most abundant element in the cosmos -- hydrogen -- also naturally emits radio waves at a very specific wavelength of 21 cm (which corresponds to a frequency of 1420 MHz). As we will see later in the chapter on SETI, astronomers search for signals from advanced extraterrestrial civilizations that are close to the 21 cm radiation that hydrogen produces.
Most radio waves reach the ground, as seen by the "radio window" in Figure 5. The lowest frequency radio waves do not make it to the Earth's surface and this region of the EM spectrum remains unexplored. Because radio waves are long, in general the telescopes (in the case of radio astronomy, these are called dishes or antennae) need to be very large. Some of the first radio observations made to look for signs of intelligent life were carried out by Frank Drake in 1960 using the 85-foot Green Bank Telescope. There is another way to work around the large size needed for dishes through a technique called interferometry. Using this technique, a number of small radio dishes can be made to work in concert and achieve the same precision as a larger dish. The Hat Creek Radio Observatory in northern California, for example, has 28 dishes that are each 6 meters and can all point to the same target on the sky and collectively function as a 40 m dish.
Microwaves
Microwaves are also low energy radiation and have sizes that range from about 1 mm up to 300 mm. The most familiar source of microwaves on Earth is probably microwave ovens. Microwaves are used extensively by satellites to monitor weather on the Earth (Doppler radar maps use microwaves) and for remote sensing of the Earth's surface. The ancient radiation left over from the Big Bang also happens to fall into the microwave part of the EM spectrum. This Cosmic Microwave Background (CMB) radiation was discovered serendipitously in 1965 and has a wavelength of 1.9 mm. The CMB is literally everywhere on the sky and will appear as "background noise" in any observations that include this wavelength.
As seen in Figure 5, some microwave radiation makes it to the ground (the telescope used to detect the CMB in 1965 was on the ground in New Jersey, USA) but some parts are also absorbed by the Earth's atmosphere. The COBE, WMAP, and Planck missions all studied the CMB in more detail and were space-based missions.
Infrared
Infrared light is given off by anything with a temperature. This discovery was made in 1800 by the astronomer William Herschel. Herschel studied the rainbow created when white light was sent through a prism and he found that the invisible region beyond the red edge of the rainbow was hotter than the temperature of the rainbow! Herschel called this type of radiation "calorific rays", or heat rays, and today we refer to these heat rays as infrared (IR) light. Our eyes are only sensitive to visible light (some animals, such as vampire bats and goldfish, can see into the infrared), although we can still "see" this type of light by using an IR camera or night vision goggles. These types of sensors pick up differences in infrared intensity. Since most IR light gets absorbed by the Earth's atmosphere, many IR telescopes are in space.
IR light is of great importance in astronomy because it can penetrate, or travel through, dust that is opaque to visible light. This idea is best shown with a comparison of the same picture taken in visible light and infrared light. Figure 7 shows pictures of the Carina Nebula taken by the Hubble Space Telescope (HST) in visible light (left) and infrared light (right). You can see an enormous amount of stars and other objects in the infrared that are not seen in the visible, as infrared light travels right through the dust while visible light is absorbed by the dust.
The James Webb Space Telescope (JWST), which launched in 2021 and has a mirror 2.7 times larger than the HST (meaning it can collect over 7 times as much light), detects IR light. IR light covers the range of about 1-1000 micrometers, where micrometers are abbreviated as μm and are often referred to as microns; for reference, E. Coli bacteria are 2 microns and a human hair is 100 microns. JWST can sense wavelengths in the range of 0.6-28 microns. One of the main goals of JWST is to study planetary systems and the origin of life. One way JWST is doing this is by studying the atmospheres of exoplanets to see if any molecules needed for life, as we know it, are present. This will be discussed in more detail in the chapters on exoplanets.
Visible Light
Human eyes evolved to detect wavelengths spanning the visible part of the EM spectrum, which covers 400 nm to 750 nm. Stars emit visible light and life on Earth would not exist without the light from the Sun. Microscopes and optical telescopes both take visible light and focus it into an image -- the study of visible light is essential to astrobiology. For example, detailed pictures of the surface of Mars that show evidence for past liquid water are taken with visible cameras like Mastcam-Z on the Perseverance rover.
Visible light is not absorbed by the Earth's atmosphere but it does get distorted as it passes through, thus causing images to become blurry. Stars as viewed from the Earth's surface appear to twinkle for this reason. However, optical (visible) telescopes on the Earth's surface can use techniques such as adaptive optics to correct for the atmospheric distortion of visible light. The Hubble Space Telescope does not need to worry about this when it collects visible light.
Some searches for intelligent extraterrestrial life in the universe are carried out using optical telescopes; these searches typically scan the sky and look for anomalous pulses, perhaps from lasers being used by a distant civilization.
Ultraviolet
Ultraviolet (UV) light has a shorter wavelength than visible light and ranges from about 10-400 nm. Stars hotter than the Sun emit primarily UV light but the Sun emits some UV light, too. This is probably most apparent when you are outside on a sunny day and forgot to bring some sunblock -- your skin will absorb some of the UV (specifically, UVA) light. The fact that stars emit UV radiation is important for many aspects of life, in addition to protecting your skin. UV light can actually break the bonds between the hydrogen and oxygen atoms in a water molecule in a process called photolysis and this can create ozone in the atmosphere, which in turn protects life from dangerous radiation that can damage cells.
UV light is emitted from a range of astrophysical sources, including sites of star formation and planetary aurorae. As seen in Figure 5, nearly all UV radiation is absorbed by the Earth's atmosphere so UV telescopes are almost always in space, although some telescopes on high mountain tops, like the Keck telescopes atop Mauna Kea in Hawaii, have UV instruments. NASA's SWIFT satellite is actively studying the universe in UV light, and the Hubble Space Telescope has been probing a wide range of UV sources since 1990.
X Rays
X rays are a high energy type of radiation, with short wavelengths of just 0.01-10 nm, and they can be absorbed by tissue and bones in our bodies. They can destroy DNA so great care is taken when X ray machines are used to take medical images. Fortunately for life, X rays are absorbed by the Earth's atmosphere so they are not a concern on Earth's surface (but are a great concern for astronauts traveling above the Earth's atmosphere).
X rays are generated by high energy astrophysical phenomena such as supernova as well as the Sun's corona. During a total solar eclipse, the very hot gas in the Sun's corona can be seen. The composition of soil on Mars is studied using X ray instruments on Martian rovers, such as Spirit and Opportunity and the active Perseverance mission.
Gamma Rays
Gamma rays are the most energetic type of radiation in the cosmos and have wavelengths on the order of the size of the nucleus inside an atom. On Earth, gamma rays are produced naturally by lightning and radioactivity. Gamma rays are also created when two neutron stars merge, in addition to the gravitational waves that these events create. Gamma rays produced in neutron star mergers produce many of the heavy elements on the periodic table, such as gold and platinum.
Gamma rays do not make it to the Earth's surface so gamma ray observatories need to be in space. The Fermi Space Telescope has been studying gamma rays on the sky since 2008 and has created a complete map of the sky in gamma rays. The surface composition of a planet can be studied using gamma ray instruments -- the MESSENGER mission to Mercury carried a gamma ray spectrometer.
Multiple Wavebands
To fully understand an object, we ideally want to look at in every type of light that it emits. For many object, this can include all types of radiation, from radio waves to gamma ray. An example of this is shown in Figure 8 for the Crab Nebula:
Key Concepts and Summary
The energy of light is our messenger about the universe. Different colors of light are simply different wavelengths and different wavelengths of light contain different amounts of energy. The longest wavelengths in the electromagnetic spectrum are radio waves and these have the lowest energy. The shortest wavelengths are high energy gamma rays.
Review Questions
Summary Questions
- What is energy? Describe two different kinds of energy and give examples of each.
- What does it mean to say the energy is "conserved"?
- How are the frequency and wavelength of light related to each other?
- What is a photon?
- Which property of light determine how much energy a photon has?
- What are the seven main parts of the electromagnetic spectrum? For each band (part), give an example of a source of that type of radiation.
Activities
The light and other kinds of radiation that reach us from objects in the universe encode a wide range of information about what those objects are like and how they work. If we can decipher this code and read the messages it contains, we can learn an enormous amount about the cosmos without ever having to leave Earth or its immediate environment.
Learning Objectives
By the end of this chapter, you will be able to:
- Explain how and why the light emitted by an object depends on its temperature
- Explain the difference between the luminosity and brightness of an object
- Explain how the total energy emitted differs for hot and cold objects
- Describe how spectroscopy can provide information about an object, such as a star.
- Discuss the difference between continuous, absorption and emission spectra.
Some astronomical objects emit mostly infrared radiation, others mostly visible light, and still others mostly ultraviolet radiation. What determines the type of electromagnetic radiation emitted by the Sun, stars, and other dense astronomical objects? The answer often turns out to be their temperature.
At the microscopic level, everything in nature is in motion. A solid is composed of molecules and atoms in continuous vibration: they move back and forth in place, but their motion is much too small for our eyes to make out. A gas consists of atoms or molecules that are flying about freely at high speed, continually bumping into one another and bombarding the surrounding matter. The hotter the solid or gas, the faster the motion of its atoms or molecules. The temperature of something is thus a measure of the average motion energy of the particles that make it up.
This motion at the microscopic level is responsible for much of the EM radiation on Earth and in the universe. As atoms and molecules move about and collide, or vibrate in place, their electrons give off EM radiation. The characteristics of this radiation are determined by the temperature of those atoms and molecules. In a hot material, for example, the individual particles vibrate in place or move rapidly from collisions, so the emitted waves are, on average, more energetic. And recall that higher energy waves have a higher frequency. In cooler materials, the particles have lower energy atomic and molecular motions and thus generate lower energy waves.
Blackbody Radiation and Wien's Law
To further understand the relationship between temperature and light (EM radiation), we consider a type of ideal object called a blackbody. A blackbody absorbs all light that hits it; none of the incoming light is reflected away or passes through the object. The object heats up and gains energy; the object then loses this energy by emitting light at all wavelengths (recall that light is a type of energy). In other words, the object cools off until it reaches the same temperature as its surroundings -- this is called thermodynamic equilibrium -- and it does this by converting the energy it absorbed into energy of motion that is radiated in a specific way (this radiated energy is called thermal or blackbody radiation). A glowing ember of coal cools by radiating energy until it reaches the same temperature as its environment.
Any dense, solid object that has a temperature emits blackbody radiation; this includes people, animals, stove tops, light bulbs, stars and planets. For example, the Earth absorbs EM radiation from the Sun, heats up, and then emits radiation as mostly infrared light. Note that any objects that reflect light, such as a book with a red cover, are not blackbodies. Similarly, if light passes through the object, as with a glass table, it is also not a blackbody. In that respect, the Earth is not a perfect blackbody, since clouds and other particulate matter do reflect some sunlight.
No object in nature is a perfect blackbody but many opaque objects behave like a blackbody so it is a very good approximation and we can use some fairly simple math to learn more about the object. As mentioned above, blackbody radiation is not emitted at just one wavelength or one part of the EM spectrum, but covers all wavelengths. At first this may sound strange -- since humans act like blackbodies, does that mean that our bodies emit dangerous X rays and gamma rays? No, that is not the case (I don't have X ray eyes) and any blackbody emits the most intense radiation at one particular wavelength. Humans have a typical temperature of 98.6°F (or 310 K) and emit the most intense radiation at 9.3 microns (an infrared wavelength, meaning we radiate heat!). The peak wavelength of the radiation that a blackbody gives off depends only on its temperature. This means two very different objects with the same temperature emit identically with the same wavelength of peak intensity. The Earth is just a little bit cooler than a human at 288 K, and its most intense radiation is at 10.1 microns. This relationship between the temperature of a blackbody and its peak wavelength is called Wien's Law and is:
[latex]\lambda_{\rm max} = \frac{ 0.0029 }{T} \rm{~m ~K}[/latex]
where the wavelength is in meters and the temperature is in K (the constant 0.0029 has units of m × K). You can easily verify λmax for a human at 310 K: (0.0029 m K)/(310 K) = 9.3×10⁻⁶ m = 9.3 microns.
The thermal radiation emitted by any blackbody shows a similar shape in the intensity of light at different wavelengths. These shapes are called blackbody curves or thermal energy curves. Figure 9 shows this general shape for blackbody curves for objects of different temperatures. The shape is similar for all temperatures but notice that the intensity for each blackbody curve peaks at a different maximum wavelength.
Notice in Figure 9 that the curves show that, at each temperature, the blackbody objects emit radiation at all wavelengths (all colors) but that the most energy is emitted at a peak wavelength. Physically, this peak corresponds to the average speed of atoms or molecules inside the object, which is a manifestation of its temperature.
The hotter the object, the shorter the peak wavelength -- the object at 5500 K has a shorter λmax (530 nm) than the object at 2500 K (which has λmax of 1160 nm and is in the infrared portion of the EM spectrum). It makes sense, then, that hot objects give off a larger fraction of their energy at shorter wavelengths (higher energies) than do cool objects. You may have observed examples of this rule in everyday life. When a burner on an electric stove is turned on low, it emits only heat, which is infrared radiation, but does not glow with visible light. If the burner is set to a higher temperature, it starts to glow a dull red. At a still-higher setting, it glows a brighter orange-red (shorter wavelength). At even higher temperatures, which cannot be reached with ordinary stoves, metal can appear brilliant yellow or even blue-white.
We can use these ideas to come up with a thermometer for measuring the temperatures of stars. Because many stars give off most of their energy in visible light, the color of light that dominates a star’s appearance is an indicator of its temperature. If one star looks red and another looks blue, which one has the higher temperature? Because blue is the shorter-wavelength color, it is the sign of a hotter star. (Note that the temperatures we associate with different colors in science are not the same as the ones artists use. In art, red is often called a “hot” color and blue a “cool” color. Likewise, we commonly see red on faucet or air conditioning controls to indicate hot temperatures and blue to indicate cold temperatures. Although these are common uses to us in daily life, in nature, it’s the other way around.)
What about the Sun? The Sun has a surface temperature of 5800 K so Wien's law immediately tells us that λmax is 500 nm. Which corresponds to green light. But the Sun doesn't look green, it looks yellow or white! What's going on?! This makes sense when you consider that the Sun is also emitting red light and blue light; these all mix together as a nearly white color. Pure purple stars are also never seen for similar reasons -- the blue and violet mix into a more deep blue color.
C0lor Temperature
Different wavelengths (or frequencies) of light correspond to different colors. But what exactly is color? Is it a property of an object, like its size, or is it something that our brains perceive? Our eyes receive light, which is sent to the brain for processing. When we look at an object, we are seeing the light that is reflected off that object. If there is no light in the room, then we do not see anything at all. When light strikes an object, some of the light is reflected and some of it is absorbed. Human eyes have evolved to see visible light; some other animals, such as birds, can see ultraviolet light! Photoreceptors called cones in the retina of our eyes are sensitive to red, blue, and green light. In that sense, every color can be broken down into a combination of red, blue, and green. This is why television only needs those three colors to accurately simulate reality. In low light conditions, rods in the retina take over and are only sensitive to one color; hence, we see shades of gray.
The Sun emits white light, which contains all colors. As an example, let’s consider what happens when sunlight strikes a house painted red. The white light hits the red house, and only red light is reflected to our eyes; all of the other colors are absorbed by the paint molecules. Pigments are substances that selectively absorb very specific wavelengths of light, leaving only the desired wavelength of light reflected.
How does the color emitted by an object relate to its temperature? Wien’s law gives a mathematical relationship for this and shows that the temperature of a blackbody is inversely proportional to the wavelength of the light emitted. As a more visual example, consider a piece of metal being heated up. First it will turn a dull red color, then orange to white, and eventually it becomes blue when it is hottest. The scale is shown in Figure 10, where the temperatures are in Kelvin.
Light bulbs are designed with color temperature in mind. This is likely a familiar concept to photographers when selecting back lighting for a shoot. For a "candlelight" type background, a bulb of around 2000 K will be best, while a "natural daylight" background is best achieved with a bulb at 4500 K. Most fluorescent light bulbs in classrooms are around 5000 K while those in a library will be closer to 3000 K.
Luminosity and Brightness
Wien's Law shows that blackbodies, like stars, emit the most intense radiation at a specific wavelength, λmax. What exactly is this intensity a measure of?
Luminosity is the total amount of energy that an object (like a star) puts out each second. It has dimensional units of energy per second. In the same way that a 100 W bulb will always put out 100 Watts whether we are standing close or farther away, the luminosity of a star does not depend on our distance from it.
However, astronomers do not measure luminosity directly with a telescope; they measure brightness: the luminosity that is intercepted by a detector such as a photographic plate or a digital camera. If you imagine a spherical surface - a bubble - around a star, then the luminosity is the integrated (total) light from the surface of that bubble. The brightness, which is the luminosity per unit area, decreases as the surface area of the spherical volume increases. This is the same phenomenon that happens with expanding balloons. The balloon has a certain amount of material, usually latex or rubber. Analogous to luminosity, that amount of material is constant, no matter how much air is in the balloon. However, as the balloon expands, that constant amount of material is stretched over a larger surface area. The walls of the balloon get thinner and the amount of material per unit area decreases. The luminosity of a star is constant. The brightness that we measure depends on whether we are "up close" or far away from the star.
This is shown in Figure 11, where the light from a star with luminosity L spreads out into spheres of increasing surface area as it travels away from the star. At a distance d from the star, we can measure the brightness ($B$) by dividing the total power emitted by the star (L) by the surface area of the sphere that the light has now spread into:
[latex]B = \frac{L}{4 \pi d^2}[/latex]
This idea—that the apparent brightness of a source (how bright it looks to us) gets weaker with distance in the way we have described—is shown in Figure 11 below. At point 1, the light is concentrated into one box. By the time the light reaches point 2, which is twice as far as point 1, it is now spread out into four squares.
Concept Check: Brightness and distances of stars
You observe two stars, named Sol-2 and Sol-3, that have the exact same luminosity as the Sun (this means they have the same temperature, radius, and luminosity as the Sun). You measure the brightness of both stars with the same instrument and find that the light from Sol-2 is twenty-five times brighter than the light from Sol-3. Which star is closer to the Earth and by how much? Explain your reasoning.
Show Answer
Ans: Sol-2 is five times closer than Sol-3. Brightness drops as the distance squared, so the ratio of the distances to Sol-2 and Sol-3 is given by [latex]\sqrt{B_{Sol2}/B_{Sol3}}[/latex] or [latex]\sqrt{25}[/latex] = 5.
Let's consider the luminosity of the Sun and the amount of energy from the Sun that reaches the Earth. This will be important to know when we study exoplanets and want to know how much light from the host star reaches the exoplanet. The luminosity of the Sun is 3.9×1026 W -- in other words, it emits the same amount of power as 3.9×1024 100 W light bulbs (or 39 trillion trillion 100 W bulbs!). As the light travels away from the Sun, it is spread out more and more, as all of that light needs to cover spheres (bubbles) that have greater surface area. The distance from the Earth to the Sun is 151 million km, or 1.51×10¹¹ m. Putting this value into the brightness equation, we find that we receive 1360 W/m2 of sunlight on the Earth. That means every 1 m2 patch on the Earth, which is about the size of a standard chess board, receives 1360 Joules of energy every second. Venus is closer to the Sun than the Earth and receives more energy for every square meter, 2600 W/m2, while Mars is further and receives only 600 W/m2.
Worked Example: Calculating the energy received from the Sun
How much radiation from the Sun is received at Saturn's moon Titan? You can assume that Titan and Saturn are at the same distance from Earth.
We can find the value by using the relationship for brightness, luminosity and distance:
[latex]B = \frac{L}{4 \pi d^2}[/latex]
Here, L is the luminosity of the Sun and d is the distance of Titan from the Sun. The distance from the Sun to Titan (Saturn) is 1.45 billion km (or 1.45×10¹² m).
B = (3.9×1026 W)/(4 π (1.45×10¹² m)2) = 14.8 W/m2
This makes sense -- Saturn is almost 10 times further from the Sun than the Earth (Earth is 1 AU and Saturn is 9.57 AU), so the value should be significantly lower than Earth's. [In fact, you could also find this value by taking the ratio (1/9.57)2 and multiplying by 1360 W/m2]
Show mathematically that the Earth receives 1360 W/m2 from the Sun.
Show Answer
The only difference here is the distance: now it is the distance from the Earth to the Sun, which is 151 million km.
B = (3.9×1026 W)/(4 π (1.51×10¹¹ m)2) = 1361 W/m2
Spectroscopy
Light from objects is filled with information. By taking the light from an object and splitting it apart into a spectrum, we can decode this light. Spectroscopy is a fundamental tool for astrobiology and allows us to detect exoplanets and study the chemical makeup of their atmospheres.
The most familiar example of spectroscopy is the rainbow of colors that is produced when white light is sent through a prism, as seen in Figure 1. A water droplet can also split up (or disperse) light and create a rainbow when a light beam passes through it. Both prisms and water droplets can serve as spectrometers or spectrographs -- tools used to disperse light into a spectrum.
Stars emit all types of electromagnetic radiation but emit the most intense light at a specific wavelength (see Wien's Law). Note that infrared and ultraviolet light are also emitted by the Sun and are split out as seen in Figure 1 -- our eyes just can't perceive these types of radiation. The distribution of colors, which is naturally organized by wavelength (or frequency), is called a spectrum. There are three main types of spectra: continuous, absorption, and emission as shown in Figure 2. If the shape of the spectrum on the bottom left of Figure 2 looks familiar, it is because you have seen it before when learning about blackbody (thermal) radiation curves.
A continuous spectrum looks like the rainbow shown in Figure 1. However, sunlight that reaches the Earth actually is an absorption spectrum, not a continuous spectrum. Why? The Sun does emit a continuous spectrum from its core but some of that light is absorbed by different atoms as it passes through the Sun's atmosphere. This is shown in Figure 2. On the left, the Sun emits a continuous spectrum at its surface. But that light passes through the atmosphere (the cloud of gas in the middle) and some of that light is absorbed by atoms in the gas. The spectrum on the right is the type of spectrum seen for the Sun, where the dark lines correspond to the wavelengths associated with the atoms or molecules that absorbed the light. Figure 3 shows an absorption spectrum for the Sun, with some of the atoms and molecules present in the Sun's atmosphere labeled. This spectrum was taken from the Earth's surface, so the O2 (molecular oxygen) lines are from Earth's atmosphere.
What does it mean to say "the wavelengths associated with the atoms"? Every element on the periodic table has a different number of protons and thus a different structure. Hydrogen is the simplest atom, with just one proton and one electron orbiting the proton in a neutral atom. To get the electron out of the hydrogen atom entirely requires a certain amount of energy. If there is no energy supplied to the atom, it is stable and the electron is in what we call the ground state of energy. However, the electron can move to different energy levels above the ground state -- imagine rungs on a ladder, with the ground state at the bottom and the top rung being the amount of energy needed to kick the electron out of the atom. Hydrogen has a unique set of energy levels and each level has an exact amount of energy. And recall that this energy has an exact frequency or wavelength given by [latex]E=hf = h c/\lambda[/latex]. When light particles (photons) with exactly one of those wavelengths encounters the atom, it is absorbed. And every element has a different set of energy levels, meaning a distinct set of its own characteristic wavelengths. We thus have a very powerful way of learning which elements are inside a star's atmosphere.
Using the unique pattern of an element to identify whether it is inside of an atmosphere is similar to DNA barcoding used in forensics to identify a match to evidence at a crime scene. Figure 4 shows an example of some of the colors (wavelengths) for a few different elements. No two are the same and we can use these patterns to identify an element in a star or planet's atmosphere. This same technique is used extensively in biochemistry and many other scientific fields. We can think of the unique emission lines associated with an atom or molecule as its chemical fingerprint.
The middle part of Figure 2 shows the physical idea of how an emission spectrum is created. Let's say you have a gas made from atoms of just one type of element. If you heat up that gas, the electrons can move up to higher energy levels and then drop back down, emitting light in the process. This is almost the same situation as the absorption spectrum on the left except we are not looking at the continuous source and the gas but instead just at the gas...so there is no continuous spectrum in the background, just the bright lines that correspond to whatever element is in the gas. The atom is emitting energy at the unique set of wavelengths (colors) for that particular element. Of course, the gas can contain many different atoms and molecules at the same time.
You can take a look at the fingerprints for some other elements using the simulation below. Click on any element to see its unique set of spectral lines. Notice that you can choose to see both absorption (top) and emission (bottom) spectra.
Key Concepts and Summary
By observing the universe with detectors that are sensitive to different energies of light, we can learn about the energy output and the peak temperatures of the objects we detect. Because the brightness of a star or other celestial object decreases with distance, a measurement of distance is needed to back out luminosity (energy per second). The wavelengths of light encode the energy and chemical composition of stars and other celestial bodies - astronomers use spectrographs to disperse light collected at a telescope into a spectrum. Objects emit a continuous (sometimes called "blackbody") spectrum with an intensity distribution that depends on temperature. When atomic transitions take place in cooler outer layers of stars, the spectrum can also have absorption or emission lines. Absorption lines occur when atoms absorb photons of light pushing electrons to a higher energy state. Emission lines occur when atoms release photons and the electrons cascade to a lower energy state.
Review Questions
Summary Questions
- How does the type of light emitted by an object depend on its temperature?
- What is the difference between the brightness of an object (such as a star) and its luminosity?
- How does the total amount of energy emitted differ for hot and cold objects?
- How does spectroscopy give information about an object? What happens when starlight passes through a prism?
- What are the differences between continuous, absorption and emission spectra? What are the similarities between all three?
- Why are the spectral lines for an element sometimes called “chemical fingerprints”?
Activities
- Understanding blackbody radiation. Open the simulation at https://phet.colorado.edu/sims/html/blackbody-spectrum/latest/blackbody-spectrum_en.html.
- The default is set to the temperature of the Sun. Click on the "labels" box to show different parts of the EM spectrum (UV, visible, and infrared). What part of the EM spectrum has the most intense light from the Sun.
- Now set the thermometer to the temperature of the star Sirius. The y-axis now needs to be rescaled to see the value for the peak intensity, Adjust this by using the zoom out button. Once you can see the peak, click on the "Graph Values" box. What is the wavelength of the peak intensity light for Sirius?
- Energy flux. Calculate the solar flux (in W/m2) at the planet Mercury.
Stars can be classified by their spectra, and we can use these classes to understand how much energy different types of stars emit, helping us to determine if a planet around another star could have the right conditions for life.
Learning Objectives
By the end of this chapter, you will be able to:
- Describe the sequence of spectral types for stars and how they are ordered
- Describe the main stages of life for a low-mass or a high-mass star.
- Explain why the H-R diagram is useful for understanding the properties of different stars.
- Describe the processes that created all of the elements on the periodic table.
Spectral Types for Stars
In 1814 Joseph Fraunhofer studied the spectrum of the Sun and cataloged the dark lines superposed on a continuous spectrum. A decade later, Gustav Kirchhoff and Robert Bunsen (famous for the Bunsen burner) realized that the dark lines in the spectrum were caused by absorption of light in the atmosphere of the Sun. When other stars were observed, they sometimes had different intensities or completely different absorption lines. The absorption lines in spectra provided a quantitative tool for classifying stars.
Want to Know More: The Harvard "Computers"
In 1890, the Directory of the Harvard College Observatory, Edward Pickering, needed a workforce to analyze and catalog the extensive photographic data that had been collected. He employed dozens of women "computers" as his assistants. He believed that these women (unappealingly referred to as "Pickering's Harem") were ideal for the job because they did excellent work and they could be paid half the salary of men. Henrietta Swan Leavitt, who classified Cepheid variable stars, and Annie Jump Cannon were two of Pickering's women computers.
Annie Jump Cannon was nearly deaf throughout her career. She was a suffragist and a member of the National Women's Party. In 1935, she created the Annie J. Cannon Prize for "the woman of any country, whose contributions to the science of astronomy are the most distinguished.

The Director of the Harvard Observatory, Edward Pickering, obtained spectra for 10,000 stars. He and his staff grouped the spectra according to the strength of hydrogen lines with letters from A through Q. Director Pickering enlisted the help of Annie Jump Cannon, one of his "women computers." Cannon and Antonia Maury found a more natural ordering that merged the stellar types into the smooth continuous sequence shown in the spectral sequence below in Figure 6. But it was not clear what this classification meant - what physical processes were driving the differences in the spectra?
Annie Jump Cannon expanded the catalog to include more than a million stars, and she developed a new system for spectral classification with seven main groups: O, B, A, F, G, K, M and three classes of peculiar stars. The original classification of stars was in alphabetical form, but it was later realized that the letters needed to be rearranged to sort them by temperature to have a measurable parameter. Each spectral type is further subdivided from 0 to 9 (increasing numbers moving toward the next cooler spectral type). Stars of type O are the hottest and type M stars are the coolest. Our Sun is a G2 star. The Sun is cooler than a G1 star and hotter than a G3 star.

The spectral type sequence OBAFGM is a temperature sequence. The mnemonic "Oh Be A Fine Girl Kiss Me" is an outdated but still useful way to remember the order of the sequence. The Stefan-Boltzmann law shows that the luminosity of a star is related to its temperature and radius. What determines the luminosity of a star after it is born? The answer is its mass. We'll go into this more deeply in the Star Formation section, but we note here that everything about a star's life is determined by the mass of the cloud of gas and dust that it forms from. A massive O or B star races through its fuel and has a short life, while a low mass M star can take trillions of years to use up all of its fuel and die.
For any type of star, the main source of energy comes from the fusion of hydrogen into helium. All stars are made mostly of hydrogen so there is a lot of it to start with -- how much depends on the mass of the star. All stars spend the vast majority of their life in this hydrogen-burning phase. Stars in the hydrogen-burning phase are called main sequence stars.
The lifetime of a main sequence star depends on two factors: how much hydrogen exists and the rate of hydrogen fusion. For massive O-type stars, there is 100 times more hydrogen fuel than for stars like the Sun. However, the rate of fusion is so high that the O-type stars burn through this fuel in a million years. In comparison, stars like the Sun will burn hydrogen for about 10 billion years. And the lowest mass M stars will burn hydrogen for more than 100 billion years (since the galaxy is only 13.8 billion years old, there are no M stars that have depleted all of their hydrogen yet). Table 1 shows the different properties of a star in its hydrogen-burning phase.

Looking at Table 1 we can note some immediate trends: High mass stars are hotter, more luminous and have a larger radius than low mass stars. Hot stars have a blue color while cooler stars are orange or red.
Concept Check: stellar luminosity
The Sun is a G star.
(a) About how many times more luminous is the Sun as compared to an M star?
(b) Does an O star have a smaller or larger radius than the Sun? By how many times?
Show Answer
(a) 30 (b) the O star's radius is 15 times larger
The location of the spectral lines in a star's spectrum can also be used to determine the line-of-sight motion of the star -- its radial velocity -- through the Doppler effect. We explore this concept more deeply when learning about detecting exoplanets.
Stellar Evolution
Our world has risen from the ashes of massive stars. Those massive stars are rare: they make up just 0.1% of all stars. The synthesis of heavy elements occurs during the final 10% of the lifetime of these stars. Except for hydrogen, the atoms in our bodies were all formed by nucleosynthesis in stars. Without those stars, or specifically without the death of those stars, we would not have the material needed to build planets and needed for prebiotic and biological chemistry.
It bears repeating that the the mass of the star is what drives the rate of fusion reactions and therefore the evolution of a star. The definition of "high mass" is generally taken to be around eight times the mass of the Sun. Low-mass stars are much more common, as seen in Table 1. These lower mass stars take the upper path in Figure 7 below and end their lives as compact white dwarfs. Higher mass stars follow the lower path in Figure 7 and end their lives as exotic neutron stars or black holes.

Pressure vs. Gravity

As we discuss the different stages of a star's life, it helps to keep in mind that from the moment a star is born, there is a competition between gravity and pressure. Gravity tends to make the star collapse in on itself, while thermal pressure tends to push the star apart. When the two are balanced, we say a star is in hydrostatic equilibrium.
A main sequence star is in hydrostatic equilibrium. Throughout its life, stars find a way to keep pressure and gravity balanced. However, as we will see, for the most massive stars gravity will eventually win and create a black hole.
Stellar evolution of low mass stars
Red giants
Roughly 99.9% of the stars are AFGKM spectral type stars. These stars fuse hydrogen in their cores on the main sequence and then evolve into red giants when the hydrogen is depleted. When hydrogen runs out, the core collapses and heats up. The red giant stars puff off about half of their mass (hydrogen enriched with helium, and trace metals like carbon, nitrogen, and oxygen), polluting the interstellar medium like an industrial chimney stack. Pressure takes over as a star becomes a red giant and this causes its radius to swell up to 100 times its size as a main sequence star. The star also becomes more luminous at this stage, as additional heating causes fusion to continue more quickly in a shell around the core.
As the outer envelope of the red giant (confusingly called a planetary nebula because astronomers were originally uncertain about these objects) mixes with the interstellar medium, the core of the remnant red giant collapses. If the core mass is less than 1.4 solar masses, it becomes a white dwarf. This is the ultimate fate of our Sun.
White dwarfs
A white dwarf is about the size of the Earth, and it is an incredibly dense object - one teaspoon of white dwarf material weighs several tons. Nuclear fusion is no longer taking place in a white dwarf (except for a short period of hydrogen fusion on the surface). Here, electron degeneracy pressure supports the white dwarf against gravity. This supporting pressure arises from the quantum mechanical nature of electrons. As is the case with atoms, identical electrons are forbidden from occupying the same energy levels and so are forced into higher energy levels that give atoms and white dwarfs their increasing sizes as the number of electrons increase. As long as the mass of the remnant white dwarf is less than about 1.4 times the mass of the Sun, electron degeneracy can support it against further collapse.
Stellar evolution of high mass stars
Red supergiants
As fragments of a cold molecular cloud begin to contract and form stars, hundreds to thousands of stars are born; however, only about 0.1% of the newborn stars will have enough mass to become O or B type stars. These massive stars contract quickly and carry out hydrogen fusion at a furious pace for 1 or 2 million years. At that point they have burned through their endowment of hydrogen. The core collapses until helium fusion begins and the outer shell expands, forming a red supergiant star. There are several cycles of fuel depletion, contraction, and re-ignition as the core of the red supergiant develops an onion layer structure, with stratified shell burning of different elements. Once the core contains iron, the star collapses again, but iron fusion does not produce energy and cannot support the star against gravitational collapse. Therefore, iron is the end of the line for elements formed via fusion; heavier elements are created during the supernova explosion. After the star explodes as a supernova, the core of the star now hits a fork in the road:
- if the core mass is between 1.4 and 3 times the mass of the Sun, then the star becomes a neutron star
- if the core is greater than 3 times the mass of the Sun, then the star becomes a black hole.
Betelgeuse: ready to explode?
Betelgeuse is a red supergiant star that is 12 - 20 times the mass of the Sun with a radius that is almost 900 times the radius of the Sun. Betelgeuse would sweep out almost to Jupiter if it were the center of our solar system. The star can be seen in the Orion constellation - at the shoulder of the famed hunter. Betelgeuse has been in the news lately, because astronomers noticed that this red supergiant started dimming in October 2019 and think that it may explode as a supernova soon. We have a ring-side seat to watch the evolution of this star, but it is impossible to know if we will see this happen next week, or over the next several thousand years. Because Betelgeuse is 640 light years away, it is possible that the star has already gone supernova and we just haven't gotten the memo yet.
https://youtu.be/FosDJOVaKFc?feature=shared
Credit: Space.com / produced & edited by Steve Spaleta
Neutron stars
Pulsars
As the remnant core collapses into a neutron star, it spins up, conserving angular momentum. In other words, as its radius gets smaller, it spins faster (just like an ice skater spins faster when they pull their arms in). Neutron stars, when they first form, can rotate hundreds of times per second with a narrow beam of electromagnetic radiation that spins with the star like a lighthouse. If the Earth happens to reside in the path of this beam of light, we see the neutron star as a rapidly blinking source - a pulsar. Pulsars were theoretically predicted going back to the 1930s. In 1968, Jocelyn Bell observed radio emission pulses that confirmed the existence of neutron stars.

As an interesting historical side note to Bell's discovery of pulsars, when the first pulsar was detected, the source of its regular pulses was unclear. The original name for the first pulsar was LGM-1, where LGM stands for little green men. This was considered to be a possible sign of contact from an extraterrestrial civilization.
Pulsars are of additional interest to the search for life in the universe as the first exoplanet detected in 1992 was found orbiting a pulsar. If this seems surprising, given that a pulsar is what's left after a star explodes as a supernova, it is speculated that the exoplanets may have formed after the explosion.
Black Holes
Electron degeneracy can support a stellar core (or white dwarf) against collapse if the total mass is less than 1.4 Msun. Neutron degeneracy can support a core against collapse if the remnant stellar core is between 1.4 and 2-3 Msun. If the mass of the remnant stellar core is greater than about 3 time the mass of the Sun, there is nothing that can stop the collapse, and a black hole is formed. Nothing escapes the black hole -- not even light -- so it is very difficult to find these stellar ghosts. But there are about a dozen candidate black holes in binary star systems where the second star is still visible. We can measure the orbit of the visible star and deduce the presence of a massive, but invisible star, and in some cases we can see gas being funneled off the visible star and heated up to tens of millions of degrees as it spirals onto an accretion disk around something that cannot be seen. If it walks like a duck and it quacks like a duck....
Neutron Star Mergers and Gravitational Waves
There is another possible fate for the most massive stars that are part of binary systems. Once they become either neutron stars or black holes, these objects will spiral in towards each other and eventually merge, releasing an enormous amount of energy in the form of gravitational waves. The first gravitational waves from such a cataclysmic event were detected in 2015 with the LIGO instruments. This process is believed to be the source of production for many elements.
H-R Diagram
The different stages in the life of a star are nicely summarized in Figure 7 above. But we have learned an immense amount about the properties of a star -- its temperature, luminosity, and radius -- and how they vary throughout a star's life. These properties can be seen dynamically in a figure that shows the luminosity of a star plotted against its temperature. This type of diagram is called the Hertzsprung-Russell (H-R) diagram, in honor of the two astronomers who discovered it around 1910.
Figure 10 shows an H-R diagram. Since the temperature of a star is directly related to its spectral type, the x-axis can show either of these variables. The y-axis shows the luminosity compared to the Sun (notice that the Sun has luminosity of 1 on this scale). The majority of the stars shown fall along the main sequence, which runs from the upper left to the lower right. The main sequence is the phase of a star's life when it is burning hydrogen into helium.
You can further explore the H-R diagram using the simulation below.
To start, click on "show luminosity class" and plot the nearest stars and the brightest stars. Click on different parts on the H-R diagram (the default, shown by a red X, is the Sun). How does the size of the star change as you move to different luminosity classes?
Want to know more: Luminosity Class
Stars have both a spectral type (OBAFGKM) and a luminosity class (I, II, III, IV, V). Spectral type is directly tied to the temperature of a star. The energy output of a star (luminosity) is directly tied to both temperature and radius. Therefore, two stars can have the same temperature, but they can have different luminosities if their radii are different. You can verify this by locating the star Capella on the H-R diagram in Figure HR. Capella has nearly the same spectral type (and temperature) as the Sun, at G3, but is more than 100 times more luminous. Capella has finished burning through its hydrogen on the main sequence and is now a red giant star.
The radius of a star is constant while it is burning hydrogen - this is the "main sequence" or luminosity class V for a star. Stars of luminosity class V are also called "dwarfs." When hydrogen is depleted from the core in a star that is similar in mass to the Sun, the core of the star collapses, but the outer envelope expands so that overall, the radius of the star increases. Now, the star evolves across the subgiant branch (luminosity class IV) and the surface temperature cools as the star expands. Even as the outer envelope of the star is increasing, the core of the star is collapsing; when the pressure is high enough in the core, helium fusion begins and the star enters the giant phase (luminosity class III). Stars that are more massive than the Sun will evolve from class V to giants (class III) or supergiants (class II or class I) depending on their mass. There are also subdwarfs (luminosity class VI) and white dwarfs (luminosity class VII) but by convention, those luminosity classes are not often used. Instead, those stars are usually just called "subdwarfs" or "white dwarfs."
Here is a summary of the luminosity classes:
-
- I - supergiants
- II - supergiants
- III - giants
- IV - subgiants
- V - main sequence (dwarfs)
Assembling the Periodic Table
In discussing spectroscopy and stars, a couple of facts can be highlighted: (1) all stars are made mostly of hydrogen; (2) every element has a unique "chemical fingerprint," or distinct set of spectral lines. We can ask a question related to both of these points: Where did all of the elements in the universe come from?
Following the Big Bang, the only atomic elements that existed in the early universe were hydrogen, helium, and a small amount of lithium. All other elements in the periodic table were formed later through nucleosynthesis and the mergers of neutron stars. Since we need those other elements to form planets and life, we review and summarize the processes that form these elements.
Nucleosynthesis
Nucleosynthesis is the process of building up heavy elements from lighter elements through fusion. In the Sun and other stars, the most common atom is hydrogen. It is possible for hydrogen nuclei (protons) to overcome the strong electrostatic repulsive forces because of the enormous temperature and pressure in the core of a star and fuse into heavier nuclei. The energy output of the Sun is 3.8 x 1026 W or 3.8 x 1026 J/s (one watt is equal to 1 joule of energy every second). This energy comes from the fusion of hydrogen into helium in the core of the Sun.
Theories of nucleosynthesis inside stars are able to predict the relative abundances with which the elements occur in nature. The way stars build up elements during various nuclear reactions really can explain why some elements (oxygen, carbon, and iron) are common and others are quite rare (gold, silver, and uranium).
Want to know more: Hydrogen Fusion
The exact pathway for nucleosynthesis is very temperature-dependent. In a star like the Sun (or less massive than the Sun), the process is proton-proton (or p-p) fusion and follows the steps outlined in the animation below.
In addition to making helium, the p-p chain produces the energy that supports the Sun against collapse. One reaction cycle in the p-p chain produces 25 MeV of energy (eV are a very tiny unit of energy... 25 MeV is just 4×10-12 joules of energy). In the second step of the p-p chain, a proton is transformed into a neutron. How does that happen?
In the first step of p-p nucleosynthesis, a small fraction of hydrogen transforms into deuterium (an isotope of hydrogen with a neutron added to the nucleus, written as 2H). This is the rate-limiting step in the p-p chain because the transformation of a proton into a neutron is statistically improbable. Once deuterium is created, the rest of the p-p pathway proceeds relatively quickly.
As hydrogen fusion occurs in the Sun, most of the mass of the hydrogen is converted into an "ash" of helium. However, there is a slight difference of 0.71% between the mass of 4 protons and the mass of a helium nucleus; this fraction of the original mass is converted into energy and the mass loss rate from the Sun, $\Delta m$, can be calculated with Einstein's famous equation:
$E = \Delta m c^2$
where $c$ is the speed of light. We can solve this equation for $\Delta m$ and find how mass is converted into energy every second in the Sun:
$$\Delta m = \frac{E}{c^2}$$
$\Delta m$ = (3.8×1026 J)/(3×108 m/s)2 = 4×10⁹ kg = 4 billion kg
Think about that... every second, 4 billion kg (or 4.4 million tons) of the mass of our Sun vanishes -- it is transformed into energy that is radiated away. However, this represents only 0.71% of the mass of hydrogen that is converted into helium. How much hydrogen is being burned in the sun every second?
$m_{H}$ = (4×10⁹ kg)/(0.0071) = 5.63×10¹¹ kg = 563 billion kg $\sim$ 600 million tons
To produce the Sun’s luminosity of 4 × 1026 watts, some 600 million tons of hydrogen must be converted into helium each second, of which about 4 million tons are converted from matter into energy. As large as these numbers are, the store of hydrogen (and thus of nuclear energy) in the Sun is still more enormous, and can last a long time—billions of years, in fact.
Stars that are more massive than the Sun have more gravitational pressure in their cores and hotter temperatures. Massive stars that have trace amounts of carbon, nitrogen, and oxygen (CNO) can take a more efficient path for synthesizing helium, using CNO as catalysts to form helium nuclei . The energy yield is higher and therefore more efficient: 26.72 MeV per helium nucleus instead of 25 MeV per helium nucleus with the p-p pathway.
Manufacturing heavier elements
So, if hydrogen fusion is forming helium, how does that get us to carbon, oxygen, nitrogen, phosphorus, sulfur.... all the good stuff that we need for life? Stars on the main sequence (dwarfs) burn only hydrogen in their cores. Elements with atomic masses greater than helium can be formed only after the star leaves the main sequence. After most of the hydrogen in the core has been fused to helium, hydrogen fusion slows down. This is a problem for the star because H-fusion was supporting the star against gravitational collapse. As the rate of H-fusion declines, gravity begins to win, and the core of the star collapses. This causes the pressure and temperature to increase. When the pressure and temperature are high enough, helium fusion in the core is initiated. During this gravitational collapse, the pressure and temperature of hydrogen gas in a shell surrounding the core "reignites" and begins forming helium.
Next, the helium nucleus (a.k.a. an alpha particle) fuses into carbon and oxygen. For low mass stars (masses less than about 3 solar masses) this is the end of nuclear fusion reactions. Low mass stars do not form most of the elements that we need for life. For this, we need high mass stars.
Massive stars are rare with relatively short lifetimes (millions rather than billions of years). But, massive stars do all of the heavy lifting when it comes to manufacturing high atomic mass elements. Like their lower mass counterparts, massive stars burn hydrogen on the main sequence. But when hydrogen fusion ends, there is a rapid succession of fusion and collapse events. When the core depletes the element it is burning in the core, gravity squeezes the star, and the next stage of core nuclear fusion along with shell burning of lighter elements begins. Close to the end of its life, the massive star has developed a stratified, onion skin structure with the heaviest elements in the core and surrounding shells of successively lighter elements, as shown in Figure 11 below. However, that fusion stops when iron is formed in the core. For elements with lower atomic mass than iron, fusion reactions are exothermic - they give off energy and support the star against gravity. Iron fusion is endothermic - energy is used in this reaction. In other words, iron is not capable of fusing to a heavier element.
The next move belongs to gravity. Once the core collapse begins, the onion shells in the core mix, and the density increases. The outer layers of the star fall in, hit the high density core, and bounce off in a fierce supernova event that blows out about half of the material in the star. During the supernova, the shock waves generate high enough pressures to produce the heaviest elements in the periodic table. The final distribution of elements has some interesting structure. The addition of alpha particles favors production of even-numbered atomic mass elements and leaves behind an even-odd pattern in the logarithmic elemental abundances. There is an obvious iron peak in the elemental abundances with higher-mass elements being increasingly rare.

Key Concepts and Summary
The peak intensity of a star coupled with its spectrum reveals its temperature and the chemical composition. Stellar spectra have been organized into a temperature sequence: OBAFGKM, from the hottest to the coolest stars. Stars like the Sun burn hydrogen in their cores for about 8-9 billion years - our middle aged Sun is halfway through this process. Once the hydrogen in the core has been fused, the star begins to evolve through a giant phase, fusing successively higher atomic mass elements to produce the elements in the Periodic Table. Stars end their life as a white dwarf, neutron star, or black hole, depending on the mass of the star.
Review Questions
Summary Questions
- What does the spectral type of a star depend on? Why isn't the sequence of spectral types alphabetical?
- How does the lifetime of a star depend on its mass?
- Explain how thermonuclear fusion in the core of a star creates energy. Which element is being fused when a star is on the main sequence?
- Describe the five main luminosity classes for stars. What luminosity class is the Sun? Betelgeuse?
- What is displayed on a H-R diagram? How does an H-R diagram help us understand the properties and evolution of stars?
- How do the spectral type and luminosity class of a star differ from each other?
- How were the elements on the periodic table created? Explain a few of the different processes and how elements were created (nucleosynthesis).
Activities
- H-R Diagram simulator. Open the H-R Diagram simulator above (or you can open it in a separate window at https://astro.unl.edu/classaction/animations/stellarprops/hrexplorer.html).
- Click on "show luminosity classes"; next, plot the nearest stars and then plot the brightest stars. Why do the nearest stars and brightest stars fall into different regions on the H-R diagram?
- Look up the temperature and luminosity for the star Vega (be sure that the temperature is in K and that the luminosity is reported relative to the Sun) and enter them in the boxes in the "Cursor Properties" box on the left. How do the size (radius) and color of Vega compare with the Sun?
a process in which information about the output of a system is routed back as an input to modify the actions being taken by the system
a process in which information about the output of a system is routed back as an input to modify the actions being taken by the system
a process in which information about the output of a system is routed back as an input to modify the actions being taken by the system
Stars can be classified by their spectra, and we can use these classes to understand how much energy different types of stars emit, helping us to determine if a planet around another star could have the right conditions for life.
Learning Objectives
By the end of this chapter, you will be able to:
- Describe the sequence of spectral types for stars and how they are ordered
- Describe the main stages of life for a low-mass or a high-mass star.
- Explain why the H-R diagram is useful for understanding the properties of different stars.
- Describe the processes that created all of the elements on the periodic table.
Spectral Types for Stars
In 1814 Joseph Fraunhofer studied the spectrum of the Sun and cataloged the dark lines superposed on a continuous spectrum. A decade later, Gustav Kirchhoff and Robert Bunsen (famous for the Bunsen burner) realized that the dark lines in the spectrum were caused by absorption of light in the atmosphere of the Sun. When other stars were observed, they sometimes had different intensities or completely different absorption lines. The absorption lines in spectra provided a quantitative tool for classifying stars.
Want to Know More: The Harvard "Computers"
In 1890, the Directory of the Harvard College Observatory, Edward Pickering, needed a workforce to analyze and catalog the extensive photographic data that had been collected. He employed dozens of women "computers" as his assistants. He believed that these women (unappealingly referred to as "Pickering's Harem") were ideal for the job because they did excellent work and they could be paid half the salary of men. Henrietta Swan Leavitt, who classified Cepheid variable stars, and Annie Jump Cannon were two of Pickering's women computers.
Annie Jump Cannon was nearly deaf throughout her career. She was a suffragist and a member of the National Women's Party. In 1935, she created the Annie J. Cannon Prize for "the woman of any country, whose contributions to the science of astronomy are the most distinguished.
The Director of the Harvard Observatory, Edward Pickering, obtained spectra for 10,000 stars. He and his staff grouped the spectra according to the strength of hydrogen lines with letters from A through Q. Director Pickering enlisted the help of Annie Jump Cannon, one of his "women computers." Cannon and Antonia Maury found a more natural ordering that merged the stellar types into the smooth continuous sequence shown in the spectral sequence below in Figure 6. But it was not clear what this classification meant - what physical processes were driving the differences in the spectra?
Annie Jump Cannon expanded the catalog to include more than a million stars, and she developed a new system for spectral classification with seven main groups: O, B, A, F, G, K, M and three classes of peculiar stars. The original classification of stars was in alphabetical form, but it was later realized that the letters needed to be rearranged to sort them by temperature to have a measurable parameter. Each spectral type is further subdivided from 0 to 9 (increasing numbers moving toward the next cooler spectral type). Stars of type O are the hottest and type M stars are the coolest. Our Sun is a G2 star. The Sun is cooler than a G1 star and hotter than a G3 star.
The spectral type sequence OBAFGM is a temperature sequence. The mnemonic "Oh Be A Fine Girl Kiss Me" is an outdated but still useful way to remember the order of the sequence. The Stefan-Boltzmann law shows that the luminosity of a star is related to its temperature and radius. What determines the luminosity of a star after it is born? The answer is its mass. We'll go into this more deeply in the Star Formation section, but we note here that everything about a star's life is determined by the mass of the cloud of gas and dust that it forms from. A massive O or B star races through its fuel and has a short life, while a low mass M star can take trillions of years to use up all of its fuel and die.
For any type of star, the main source of energy comes from the fusion of hydrogen into helium. All stars are made mostly of hydrogen so there is a lot of it to start with -- how much depends on the mass of the star. All stars spend the vast majority of their life in this hydrogen-burning phase. Stars in the hydrogen-burning phase are called main sequence stars.
The lifetime of a main sequence star depends on two factors: how much hydrogen exists and the rate of hydrogen fusion. For massive O-type stars, there is 100 times more hydrogen fuel than for stars like the Sun. However, the rate of fusion is so high that the O-type stars burn through this fuel in a million years. In comparison, stars like the Sun will burn hydrogen for about 10 billion years. And the lowest mass M stars will burn hydrogen for more than 100 billion years (since the galaxy is only 13.8 billion years old, there are no M stars that have depleted all of their hydrogen yet). Table 1 shows the different properties of a star in its hydrogen-burning phase.
Looking at Table 1 we can note some immediate trends: High mass stars are hotter, more luminous and have a larger radius than low mass stars. Hot stars have a blue color while cooler stars are orange or red.
Concept Check: stellar luminosity
The Sun is a G star.
(a) About how many times more luminous is the Sun as compared to an M star?
(b) Does an O star have a smaller or larger radius than the Sun? By how many times?
Show Answer
(a) 30 (b) the O star's radius is 15 times larger
The location of the spectral lines in a star's spectrum can also be used to determine the line-of-sight motion of the star -- its radial velocity -- through the Doppler effect. We explore this concept more deeply when learning about detecting exoplanets.
Stellar Evolution
Our world has risen from the ashes of massive stars. Those massive stars are rare: they make up just 0.1% of all stars. The synthesis of heavy elements occurs during the final 10% of the lifetime of these stars. Except for hydrogen, the atoms in our bodies were all formed by nucleosynthesis in stars. Without those stars, or specifically without the death of those stars, we would not have the material needed to build planets and needed for prebiotic and biological chemistry.
It bears repeating that the the mass of the star is what drives the rate of fusion reactions and therefore the evolution of a star. The definition of "high mass" is generally taken to be around eight times the mass of the Sun. Low-mass stars are much more common, as seen in Table 1. These lower mass stars take the upper path in Figure 7 below and end their lives as compact white dwarfs. Higher mass stars follow the lower path in Figure 7 and end their lives as exotic neutron stars or black holes.
Pressure vs. Gravity
As we discuss the different stages of a star's life, it helps to keep in mind that from the moment a star is born, there is a competition between gravity and pressure. Gravity tends to make the star collapse in on itself, while thermal pressure tends to push the star apart. When the two are balanced, we say a star is in hydrostatic equilibrium.
A main sequence star is in hydrostatic equilibrium. Throughout their lives, stars use stabilizing feedback loops to keep pressure and gravity balanced. However, as we will see, for the most massive stars gravity will eventually win and create a black hole.
Stellar evolution of low mass stars
Red giants
Roughly 99.9% of the stars are AFGKM spectral type stars. These stars fuse hydrogen in their cores on the main sequence and then evolve into red giants when the hydrogen is depleted. When hydrogen runs out, the core collapses and heats up. The red giant stars puff off about half of their mass (hydrogen enriched with helium, and trace metals like carbon, nitrogen, and oxygen), polluting the interstellar medium like an industrial chimney stack. Pressure takes over as a star becomes a red giant and this causes its radius to swell up to 100 times its size as a main sequence star. The star also becomes more luminous at this stage, as additional heating causes fusion to continue more quickly in a shell around the core.
As the outer envelope of the red giant (confusingly called a planetary nebula because astronomers were originally uncertain about these objects) mixes with the interstellar medium, the core of the remnant red giant collapses. If the core mass is less than 1.4 solar masses, it becomes a white dwarf. This is the ultimate fate of our Sun.
White dwarfs
A white dwarf is about the size of the Earth, and it is an incredibly dense object - one teaspoon of white dwarf material weighs several tons. Nuclear fusion is no longer taking place in a white dwarf (except for a short period of hydrogen fusion on the surface). Here, electron degeneracy pressure supports the white dwarf against gravity. This supporting pressure arises from the quantum mechanical nature of electrons. As is the case with atoms, identical electrons are forbidden from occupying the same energy levels and so are forced into higher energy levels that give atoms and white dwarfs their increasing sizes as the number of electrons increase. As long as the mass of the remnant white dwarf is less than about 1.4 times the mass of the Sun, electron degeneracy can support it against further collapse.
Stellar evolution of high mass stars
Red supergiants
As fragments of a cold molecular cloud begin to contract and form stars, hundreds to thousands of stars are born; however, only about 0.1% of the newborn stars will have enough mass to become O or B type stars. These massive stars contract quickly and carry out hydrogen fusion at a furious pace for 1 or 2 million years. At that point they have burned through their endowment of hydrogen. The core collapses until helium fusion begins and the outer shell expands, forming a red supergiant star. There are several cycles of fuel depletion, contraction, and re-ignition as the core of the red supergiant develops an onion layer structure, with stratified shell burning of different elements. Once the core contains iron, the star collapses again, but iron fusion does not produce energy and cannot support the star against gravitational collapse. Therefore, iron is the end of the line for elements formed via fusion; heavier elements are created during the supernova explosion. After the star explodes as a supernova, the core of the star now hits a fork in the road:
- if the core mass is between 1.4 and 3 times the mass of the Sun, then the star becomes a neutron star
- if the core is greater than 3 times the mass of the Sun, then the star becomes a black hole.
Betelgeuse: ready to explode?
Betelgeuse is a red supergiant star that is 12 - 20 times the mass of the Sun with a radius that is almost 900 times the radius of the Sun. Betelgeuse would sweep out almost to Jupiter if it were the center of our solar system. The star can be seen in the Orion constellation - at the shoulder of the famed hunter. Betelgeuse has been in the news lately, because astronomers noticed that this red supergiant started dimming in October 2019 and think that it may explode as a supernova soon. We have a ring-side seat to watch the evolution of this star, but it is impossible to know if we will see this happen next week, or over the next several thousand years. Because Betelgeuse is 640 light years away, it is possible that the star has already gone supernova and we just haven't gotten the memo yet.
https://youtu.be/FosDJOVaKFc?feature=shared
Credit: Space.com / produced & edited by Steve Spaleta
Neutron stars
Pulsars
As the remnant core collapses into a neutron star, it spins up, conserving angular momentum. In other words, as its radius gets smaller, it spins faster (just like an ice skater spins faster when they pull their arms in). Neutron stars, when they first form, can rotate hundreds of times per second with a narrow beam of electromagnetic radiation that spins with the star like a lighthouse. If the Earth happens to reside in the path of this beam of light, we see the neutron star as a rapidly blinking source - a pulsar. Pulsars were theoretically predicted going back to the 1930s. In 1968, Jocelyn Bell observed radio emission pulses that confirmed the existence of neutron stars.
As an interesting historical side note to Bell's discovery of pulsars, when the first pulsar was detected, the source of its regular pulses was unclear. The original name for the first pulsar was LGM-1, where LGM stands for little green men. This was considered to be a possible sign of contact from an extraterrestrial civilization.
Pulsars are of additional interest to the search for life in the universe as the first exoplanet detected in 1992 was found orbiting a pulsar. If this seems surprising, given that a pulsar is what's left after a star explodes as a supernova, it is speculated that the exoplanets may have formed after the explosion.
Black Holes
Electron degeneracy can support a stellar core (or white dwarf) against collapse if the total mass is less than 1.4 Msun. Neutron degeneracy can support a core against collapse if the remnant stellar core is between 1.4 and 2-3 Msun. If the mass of the remnant stellar core is greater than about 3 time the mass of the Sun, there is nothing that can stop the collapse, and a black hole is formed. Nothing escapes the black hole -- not even light -- so it is very difficult to find these stellar ghosts. But there are about a dozen candidate black holes in binary star systems where the second star is still visible. We can measure the orbit of the visible star and deduce the presence of a massive, but invisible star, and in some cases we can see gas being funneled off the visible star and heated up to tens of millions of degrees as it spirals onto an accretion disk around something that cannot be seen. If it walks like a duck and it quacks like a duck....
Neutron Star Mergers and Gravitational Waves
There is another possible fate for the most massive stars that are part of binary systems. Once they become either neutron stars or black holes, these objects will spiral in towards each other and eventually merge, releasing an enormous amount of energy in the form of gravitational waves. The first gravitational waves from such a cataclysmic event were detected in 2015 with the LIGO instruments. This process is believed to be the source of production for many elements.
H-R Diagram
The different stages in the life of a star are nicely summarized in Figure 7 above. But we have learned an immense amount about the properties of a star -- its temperature, luminosity, and radius -- and how they vary throughout a star's life. These properties can be seen dynamically in a figure that shows the luminosity of a star plotted against its temperature. This type of diagram is called the Hertzsprung-Russell (H-R) diagram, in honor of the two astronomers who discovered it around 1910.
Figure 10 shows an H-R diagram. Since the temperature of a star is directly related to its spectral type, the x-axis can show either of these variables. The y-axis shows the luminosity compared to the Sun (notice that the Sun has luminosity of 1 on this scale). The majority of the stars shown fall along the main sequence, which runs from the upper left to the lower right. The main sequence is the phase of a star's life when it is burning hydrogen into helium.
You can further explore the H-R diagram using the simulation below.
To start, click on "show luminosity class" and plot the nearest stars and the brightest stars. Click on different parts on the H-R diagram (the default, shown by a red X, is the Sun). How does the size of the star change as you move to different luminosity classes?
Want to know more: Luminosity Class
Stars have both a spectral type (OBAFGKM) and a luminosity class (I, II, III, IV, V). Spectral type is directly tied to the temperature of a star. The energy output of a star (luminosity) is directly tied to both temperature and radius. Therefore, two stars can have the same temperature, but they can have different luminosities if their radii are different. You can verify this by locating the star Capella on the H-R diagram in Figure HR. Capella has nearly the same spectral type (and temperature) as the Sun, at G3, but is more than 100 times more luminous. Capella has finished burning through its hydrogen on the main sequence and is now a red giant star.
The radius of a star is constant while it is burning hydrogen - this is the "main sequence" or luminosity class V for a star. Stars of luminosity class V are also called "dwarfs." When hydrogen is depleted from the core in a star that is similar in mass to the Sun, the core of the star collapses, but the outer envelope expands so that overall, the radius of the star increases. Now, the star evolves across the subgiant branch (luminosity class IV) and the surface temperature cools as the star expands. Even as the outer envelope of the star is increasing, the core of the star is collapsing; when the pressure is high enough in the core, helium fusion begins and the star enters the giant phase (luminosity class III). Stars that are more massive than the Sun will evolve from class V to giants (class III) or supergiants (class II or class I) depending on their mass. There are also subdwarfs (luminosity class VI) and white dwarfs (luminosity class VII) but by convention, those luminosity classes are not often used. Instead, those stars are usually just called "subdwarfs" or "white dwarfs."
Here is a summary of the luminosity classes:
-
- I - supergiants
- II - supergiants
- III - giants
- IV - subgiants
- V - main sequence (dwarfs)
Assembling the Periodic Table
In discussing spectroscopy and stars, a couple of facts can be highlighted: (1) all stars are made mostly of hydrogen; (2) every element has a unique "chemical fingerprint," or distinct set of spectral lines. We can ask a question related to both of these points: Where did all of the elements in the universe come from?
Following the Big Bang, the only atomic elements that existed in the early universe were hydrogen, helium, and a small amount of lithium. All other elements in the periodic table were formed later through nucleosynthesis and the mergers of neutron stars. Since we need those other elements to form planets and life, we review and summarize the processes that form these elements.
Nucleosynthesis
Nucleosynthesis is the process of building up heavy elements from lighter elements through fusion. In the Sun and other stars, the most common atom is hydrogen. It is possible for hydrogen nuclei (protons) to overcome the strong electrostatic repulsive forces because of the enormous temperature and pressure in the core of a star and fuse into heavier nuclei. The energy output of the Sun is 3.8 x 1026 W or 3.8 x 1026 J/s (one watt is equal to 1 joule of energy every second). This energy comes from the fusion of hydrogen into helium in the core of the Sun.
Theories of nucleosynthesis inside stars are able to predict the relative abundances with which the elements occur in nature. The way stars build up elements during various nuclear reactions really can explain why some elements (oxygen, carbon, and iron) are common and others are quite rare (gold, silver, and uranium).
Want to know more: Hydrogen Fusion
The exact pathway for nucleosynthesis is very temperature-dependent. In a star like the Sun (or less massive than the Sun), the process is proton-proton (or p-p) fusion and follows the steps outlined in the animation below.
In addition to making helium, the p-p chain produces the energy that supports the Sun against collapse. One reaction cycle in the p-p chain produces 25 MeV of energy (eV are a very tiny unit of energy... 25 MeV is just 4×10-12 joules of energy). In the second step of the p-p chain, a proton is transformed into a neutron. How does that happen?
In the first step of p-p nucleosynthesis, a small fraction of hydrogen transforms into deuterium (an isotope of hydrogen with a neutron added to the nucleus, written as 2H). This is the rate-limiting step in the p-p chain because the transformation of a proton into a neutron is statistically improbable. Once deuterium is created, the rest of the p-p pathway proceeds relatively quickly.
As hydrogen fusion occurs in the Sun, most of the mass of the hydrogen is converted into an "ash" of helium. However, there is a slight difference of 0.71% between the mass of 4 protons and the mass of a helium nucleus; this fraction of the original mass is converted into energy and the mass loss rate from the Sun, $\Delta m$, can be calculated with Einstein's famous equation:
$E = \Delta m c^2$
where $c$ is the speed of light. We can solve this equation for $\Delta m$ and find how mass is converted into energy every second in the Sun:
$$\Delta m = \frac{E}{c^2}$$
$\Delta m$ = (3.8×1026 J)/(3×108 m/s)2 = 4×10⁹ kg = 4 billion kg
Think about that... every second, 4 billion kg (or 4.4 million tons) of the mass of our Sun vanishes -- it is transformed into energy that is radiated away. However, this represents only 0.71% of the mass of hydrogen that is converted into helium. How much hydrogen is being burned in the sun every second?
$m_{H}$ = (4×10⁹ kg)/(0.0071) = 5.63×10¹¹ kg = 563 billion kg $\sim$ 600 million tons
To produce the Sun’s luminosity of 4 × 1026 watts, some 600 million tons of hydrogen must be converted into helium each second, of which about 4 million tons are converted from matter into energy. As large as these numbers are, the store of hydrogen (and thus of nuclear energy) in the Sun is still more enormous, and can last a long time—billions of years, in fact.
Stars that are more massive than the Sun have more gravitational pressure in their cores and hotter temperatures. Massive stars that have trace amounts of carbon, nitrogen, and oxygen (CNO) can take a more efficient path for synthesizing helium, using CNO as catalysts to form helium nuclei . The energy yield is higher and therefore more efficient: 26.72 MeV per helium nucleus instead of 25 MeV per helium nucleus with the p-p pathway.
Manufacturing heavier elements
So, if hydrogen fusion is forming helium, how does that get us to carbon, oxygen, nitrogen, phosphorus, sulfur.... all the good stuff that we need for life? Stars on the main sequence (dwarfs) burn only hydrogen in their cores. Elements with atomic masses greater than helium can be formed only after the star leaves the main sequence. After most of the hydrogen in the core has been fused to helium, hydrogen fusion slows down. This is a problem for the star because H-fusion was supporting the star against gravitational collapse. As the rate of H-fusion declines, gravity begins to win, and the core of the star collapses. This causes the pressure and temperature to increase. When the pressure and temperature are high enough, helium fusion in the core is initiated. During this gravitational collapse, the pressure and temperature of hydrogen gas in a shell surrounding the core "reignites" and begins forming helium.
Next, the helium nucleus (a.k.a. an alpha particle) fuses into carbon and oxygen. For low mass stars (masses less than about 3 solar masses) this is the end of nuclear fusion reactions. Low mass stars do not form most of the elements that we need for life. For this, we need high mass stars.
Massive stars are rare with relatively short lifetimes (millions rather than billions of years). But, massive stars do all of the heavy lifting when it comes to manufacturing high atomic mass elements. Like their lower mass counterparts, massive stars burn hydrogen on the main sequence. But when hydrogen fusion ends, there is a rapid succession of fusion and collapse events. When the core depletes the element it is burning in the core, gravity squeezes the star, and the next stage of core nuclear fusion along with shell burning of lighter elements begins. Close to the end of its life, the massive star has developed a stratified, onion skin structure with the heaviest elements in the core and surrounding shells of successively lighter elements, as shown in Figure 11 below. However, that fusion stops when iron is formed in the core. For elements with lower atomic mass than iron, fusion reactions are exothermic - they give off energy and support the star against gravity. Iron fusion is endothermic - energy is used in this reaction. In other words, iron is not capable of fusing to a heavier element.
The next move belongs to gravity. Once the core collapse begins, the onion shells in the core mix, and the density increases. The outer layers of the star fall in, hit the high density core, and bounce off in a fierce supernova event that blows out about half of the material in the star. During the supernova, the shock waves generate high enough pressures to produce the heaviest elements in the periodic table. The final distribution of elements has some interesting structure. The addition of alpha particles favors production of even-numbered atomic mass elements and leaves behind an even-odd pattern in the logarithmic elemental abundances. There is an obvious iron peak in the elemental abundances with higher-mass elements being increasingly rare.
Key Concepts and Summary
The peak intensity of a star coupled with its spectrum reveals its temperature and the chemical composition. Stellar spectra have been organized into a temperature sequence: OBAFGKM, from the hottest to the coolest stars. Stars like the Sun burn hydrogen in their cores for about 8-9 billion years - our middle aged Sun is halfway through this process. Once the hydrogen in the core has been fused, the star begins to evolve through a giant phase, fusing successively higher atomic mass elements to produce the elements in the Periodic Table. Stars end their life as a white dwarf, neutron star, or black hole, depending on the mass of the star.
Review Questions
Summary Questions
- What does the spectral type of a star depend on? Why isn't the sequence of spectral types alphabetical?
- How does the lifetime of a star depend on its mass?
- Explain how thermonuclear fusion in the core of a star creates energy. Which element is being fused when a star is on the main sequence?
- Describe the five main luminosity classes for stars. What luminosity class is the Sun? Betelgeuse?
- What is displayed on a H-R diagram? How does an H-R diagram help us understand the properties and evolution of stars?
- How do the spectral type and luminosity class of a star differ from each other?
- How were the elements on the periodic table created? Explain a few of the different processes and how elements were created (nucleosynthesis).
Activities
- H-R Diagram simulator. Open the H-R Diagram simulator above (or you can open it in a separate window at https://astro.unl.edu/classaction/animations/stellarprops/hrexplorer.html).
- Click on "show luminosity classes"; next, plot the nearest stars and then plot the brightest stars. Why do the nearest stars and brightest stars fall into different regions on the H-R diagram?
- Look up the temperature and luminosity for the star Vega (be sure that the temperature is in K and that the luminosity is reported relative to the Sun) and enter them in the boxes in the "Cursor Properties" box on the left. How do the size (radius) and color of Vega compare with the Sun?
Stars can be classified by their spectra, and we can use these classes to understand how much energy different types of stars emit, helping us to determine if a planet around another star could have the right conditions for life.
Learning Objectives
By the end of this chapter, you will be able to:
- Describe the sequence of spectral types for stars and how they are ordered
- Describe the main stages of life for a low-mass or a high-mass star.
- Explain why the H-R diagram is useful for understanding the properties of different stars.
- Describe the processes that created all of the elements on the periodic table.
Spectral Types for Stars
In 1814 Joseph Fraunhofer studied the spectrum of the Sun and cataloged the dark lines superposed on a continuous spectrum. A decade later, Gustav Kirchhoff and Robert Bunsen (famous for the Bunsen burner) realized that the dark lines in the spectrum were caused by absorption of light in the atmosphere of the Sun. When other stars were observed, they sometimes had different intensities or completely different absorption lines. The absorption lines in spectra provided a quantitative tool for classifying stars.
Want to Know More: The Harvard "Computers"
In 1890, the Directory of the Harvard College Observatory, Edward Pickering, needed a workforce to analyze and catalog the extensive photographic data that had been collected. He employed dozens of women "computers" as his assistants. He believed that these women (unappealingly referred to as "Pickering's Harem") were ideal for the job because they did excellent work and they could be paid half the salary of men. Henrietta Swan Leavitt, who classified Cepheid variable stars, and Annie Jump Cannon were two of Pickering's women computers.
Annie Jump Cannon was nearly deaf throughout her career. She was a suffragist and a member of the National Women's Party. In 1935, she created the Annie J. Cannon Prize for "the woman of any country, whose contributions to the science of astronomy are the most distinguished.
The Director of the Harvard Observatory, Edward Pickering, obtained spectra for 10,000 stars. He and his staff grouped the spectra according to the strength of hydrogen lines with letters from A through Q. Director Pickering enlisted the help of Annie Jump Cannon, one of his "women computers." Cannon and Antonia Maury found a more natural ordering that merged the stellar types into the smooth continuous sequence shown in the spectral sequence below in Figure 6. But it was not clear what this classification meant - what physical processes were driving the differences in the spectra?
Annie Jump Cannon expanded the catalog to include more than a million stars, and she developed a new system for spectral classification with seven main groups: O, B, A, F, G, K, M and three classes of peculiar stars. The original classification of stars was in alphabetical form, but it was later realized that the letters needed to be rearranged to sort them by temperature to have a measurable parameter. Each spectral type is further subdivided from 0 to 9 (increasing numbers moving toward the next cooler spectral type). Stars of type O are the hottest and type M stars are the coolest. Our Sun is a G2 star. The Sun is cooler than a G1 star and hotter than a G3 star.
The spectral type sequence OBAFGM is a temperature sequence. The mnemonic "Oh Be A Fine Girl Kiss Me" is an outdated but still useful way to remember the order of the sequence. The Stefan-Boltzmann law shows that the luminosity of a star is related to its temperature and radius. What determines the luminosity of a star after it is born? The answer is its mass. We'll go into this more deeply in the Star Formation section, but we note here that everything about a star's life is determined by the mass of the cloud of gas and dust that it forms from. A massive O or B star races through its fuel and has a short life, while a low mass M star can take trillions of years to use up all of its fuel and die.
For any type of star, the main source of energy comes from the fusion of hydrogen into helium. All stars are made mostly of hydrogen so there is a lot of it to start with -- how much depends on the mass of the star. All stars spend the vast majority of their life in this hydrogen-burning phase. Stars in the hydrogen-burning phase are called main sequence stars.
The lifetime of a main sequence star depends on two factors: how much hydrogen exists and the rate of hydrogen fusion. For massive O-type stars, there is 100 times more hydrogen fuel than for stars like the Sun. However, the rate of fusion is so high that the O-type stars burn through this fuel in a million years. In comparison, stars like the Sun will burn hydrogen for about 10 billion years. And the lowest mass M stars will burn hydrogen for more than 100 billion years (since the galaxy is only 13.8 billion years old, there are no M stars that have depleted all of their hydrogen yet). Table 1 shows the different properties of a star in its hydrogen-burning phase.
Looking at Table 1 we can note some immediate trends: High mass stars are hotter, more luminous and have a larger radius than low mass stars. Hot stars have a blue color while cooler stars are orange or red.
Concept Check: stellar luminosity
The Sun is a G star.
(a) About how many times more luminous is the Sun as compared to an M star?
(b) Does an O star have a smaller or larger radius than the Sun? By how many times?
Show Answer
(a) 30 (b) the O star's radius is 15 times larger
The location of the spectral lines in a star's spectrum can also be used to determine the line-of-sight motion of the star -- its radial velocity -- through the Doppler effect. We explore this concept more deeply when learning about detecting exoplanets.
Stellar Evolution
Our world has risen from the ashes of massive stars. Those massive stars are rare: they make up just 0.1% of all stars. The synthesis of heavy elements occurs during the final 10% of the lifetime of these stars. Except for hydrogen, the atoms in our bodies were all formed by nucleosynthesis in stars. Without those stars, or specifically without the death of those stars, we would not have the material needed to build planets and needed for prebiotic and biological chemistry.
It bears repeating that the the mass of the star is what drives the rate of fusion reactions and therefore the evolution of a star. The definition of "high mass" is generally taken to be around eight times the mass of the Sun. Low-mass stars are much more common, as seen in Table 1. These lower mass stars take the upper path in Figure 7 below and end their lives as compact white dwarfs. Higher mass stars follow the lower path in Figure 7 and end their lives as exotic neutron stars or black holes.
Pressure vs. Gravity
As we discuss the different stages of a star's life, it helps to keep in mind that from the moment a star is born, there is a competition between gravity and pressure. Gravity tends to make the star collapse in on itself, while thermal pressure tends to push the star apart. When the two are balanced, we say a star is in hydrostatic equilibrium.
A main sequence star is in hydrostatic equilibrium. Throughout their lives, stars use stabilizing feedback loops to keep pressure and gravity balanced. However, as we will see, for the most massive stars gravity will eventually win and create a black hole.
Stellar evolution of low mass stars
Red giants
Roughly 99.9% of the stars are AFGKM spectral type stars. These stars fuse hydrogen in their cores on the main sequence and then evolve into red giants when the hydrogen is depleted. When hydrogen runs out, the core collapses and heats up. The red giant stars puff off about half of their mass (hydrogen enriched with helium, and trace metals like carbon, nitrogen, and oxygen), polluting the interstellar medium like an industrial chimney stack. Pressure takes over as a star becomes a red giant and this causes its radius to swell up to 100 times its size as a main sequence star. The star also becomes more luminous at this stage, as additional heating causes fusion to continue more quickly in a shell around the core.
As the outer envelope of the red giant (confusingly called a planetary nebula because astronomers were originally uncertain about these objects) mixes with the interstellar medium, the core of the remnant red giant collapses. If the core mass is less than 1.4 solar masses, it becomes a white dwarf. This is the ultimate fate of our Sun.
White dwarfs
A white dwarf is about the size of the Earth, and it is an incredibly dense object - one teaspoon of white dwarf material weighs several tons. Nuclear fusion is no longer taking place in a white dwarf (except for a short period of hydrogen fusion on the surface). Here, electron degeneracy pressure supports the white dwarf against gravity. This supporting pressure arises from the quantum mechanical nature of electrons. As is the case with atoms, identical electrons are forbidden from occupying the same energy levels and so are forced into higher energy levels that give atoms and white dwarfs their increasing sizes as the number of electrons increase. As long as the mass of the remnant white dwarf is less than about 1.4 times the mass of the Sun, electron degeneracy can support it against further collapse.
Stellar evolution of high mass stars
Red supergiants
As fragments of a cold molecular cloud begin to contract and form stars, hundreds to thousands of stars are born; however, only about 0.1% of the newborn stars will have enough mass to become O or B type stars. These massive stars contract quickly and carry out hydrogen fusion at a furious pace for 1 or 2 million years. At that point they have burned through their endowment of hydrogen. The core collapses until helium fusion begins and the outer shell expands, forming a red supergiant star. There are several cycles of fuel depletion, contraction, and re-ignition as the core of the red supergiant develops an onion layer structure, with stratified shell burning of different elements. Once the core contains iron, the star collapses again, but iron fusion does not produce energy and cannot support the star against gravitational collapse. Therefore, iron is the end of the line for elements formed via fusion; heavier elements are created during the supernova explosion. After the star explodes as a supernova, the core of the star now hits a fork in the road:
- if the core mass is between 1.4 and 3 times the mass of the Sun, then the star becomes a neutron star
- if the core is greater than 3 times the mass of the Sun, then the star becomes a black hole.
Betelgeuse: ready to explode?
Betelgeuse is a red supergiant star that is 12 - 20 times the mass of the Sun with a radius that is almost 900 times the radius of the Sun. Betelgeuse would sweep out almost to Jupiter if it were the center of our solar system. The star can be seen in the Orion constellation - at the shoulder of the famed hunter. Betelgeuse has been in the news lately, because astronomers noticed that this red supergiant started dimming in October 2019 and think that it may explode as a supernova soon. We have a ring-side seat to watch the evolution of this star, but it is impossible to know if we will see this happen next week, or over the next several thousand years. Because Betelgeuse is 640 light years away, it is possible that the star has already gone supernova and we just haven't gotten the memo yet.
https://youtu.be/FosDJOVaKFc?feature=shared
Credit: Space.com / produced & edited by Steve Spaleta
Neutron stars
Pulsars
As the remnant core collapses into a neutron star, it spins up, conserving angular momentum. In other words, as its radius gets smaller, it spins faster (just like an ice skater spins faster when they pull their arms in). Neutron stars, when they first form, can rotate hundreds of times per second with a narrow beam of electromagnetic radiation that spins with the star like a lighthouse. If the Earth happens to reside in the path of this beam of light, we see the neutron star as a rapidly blinking source - a pulsar. Pulsars were theoretically predicted going back to the 1930s. In 1968, Jocelyn Bell observed radio emission pulses that confirmed the existence of neutron stars.
As an interesting historical side note to Bell's discovery of pulsars, when the first pulsar was detected, the source of its regular pulses was unclear. The original name for the first pulsar was LGM-1, where LGM stands for little green men. This was considered to be a possible sign of contact from an extraterrestrial civilization.
Pulsars are of additional interest to the search for life in the universe as the first exoplanet detected in 1992 was found orbiting a pulsar. If this seems surprising, given that a pulsar is what's left after a star explodes as a supernova, it is speculated that the exoplanets may have formed after the explosion.
Black Holes
Electron degeneracy can support a stellar core (or white dwarf) against collapse if the total mass is less than 1.4 Msun. Neutron degeneracy can support a core against collapse if the remnant stellar core is between 1.4 and 2-3 Msun. If the mass of the remnant stellar core is greater than about 3 time the mass of the Sun, there is nothing that can stop the collapse, and a black hole is formed. Nothing escapes the black hole -- not even light -- so it is very difficult to find these stellar ghosts. But there are about a dozen candidate black holes in binary star systems where the second star is still visible. We can measure the orbit of the visible star and deduce the presence of a massive, but invisible star, and in some cases we can see gas being funneled off the visible star and heated up to tens of millions of degrees as it spirals onto an accretion disk around something that cannot be seen. If it walks like a duck and it quacks like a duck....
Neutron Star Mergers and Gravitational Waves
There is another possible fate for the most massive stars that are part of binary systems. Once they become either neutron stars or black holes, these objects will spiral in towards each other and eventually merge, releasing an enormous amount of energy in the form of gravitational waves. The first gravitational waves from such a cataclysmic event were detected in 2015 with the LIGO instruments. This process is believed to be the source of production for many elements.
H-R Diagram
The different stages in the life of a star are nicely summarized in Figure 7 above. But we have learned an immense amount about the properties of a star -- its temperature, luminosity, and radius -- and how they vary throughout a star's life. These properties can be seen dynamically in a figure that shows the luminosity of a star plotted against its temperature. This type of diagram is called the Hertzsprung-Russell (H-R) diagram, in honor of the two astronomers who discovered it around 1910.
Figure 10 shows an H-R diagram. Since the temperature of a star is directly related to its spectral type, the x-axis can show either of these variables. The y-axis shows the luminosity compared to the Sun (notice that the Sun has luminosity of 1 on this scale). The majority of the stars shown fall along the main sequence, which runs from the upper left to the lower right. The main sequence is the phase of a star's life when it is burning hydrogen into helium.
You can further explore the H-R diagram using the simulation below.
To start, click on "show luminosity class" and plot the nearest stars and the brightest stars. Click on different parts on the H-R diagram (the default, shown by a red X, is the Sun). How does the size of the star change as you move to different luminosity classes?
Want to know more: Luminosity Class
Stars have both a spectral type (OBAFGKM) and a luminosity class (I, II, III, IV, V). Spectral type is directly tied to the temperature of a star. The energy output of a star (luminosity) is directly tied to both temperature and radius. Therefore, two stars can have the same temperature, but they can have different luminosities if their radii are different. You can verify this by locating the star Capella on the H-R diagram in Figure HR. Capella has nearly the same spectral type (and temperature) as the Sun, at G3, but is more than 100 times more luminous. Capella has finished burning through its hydrogen on the main sequence and is now a red giant star.
The radius of a star is constant while it is burning hydrogen - this is the "main sequence" or luminosity class V for a star. Stars of luminosity class V are also called "dwarfs." When hydrogen is depleted from the core in a star that is similar in mass to the Sun, the core of the star collapses, but the outer envelope expands so that overall, the radius of the star increases. Now, the star evolves across the subgiant branch (luminosity class IV) and the surface temperature cools as the star expands. Even as the outer envelope of the star is increasing, the core of the star is collapsing; when the pressure is high enough in the core, helium fusion begins and the star enters the giant phase (luminosity class III). Stars that are more massive than the Sun will evolve from class V to giants (class III) or supergiants (class II or class I) depending on their mass. There are also subdwarfs (luminosity class VI) and white dwarfs (luminosity class VII) but by convention, those luminosity classes are not often used. Instead, those stars are usually just called "subdwarfs" or "white dwarfs."
Here is a summary of the luminosity classes:
-
- I - supergiants
- II - supergiants
- III - giants
- IV - subgiants
- V - main sequence (dwarfs)
Assembling the Periodic Table
In discussing spectroscopy and stars, a couple of facts can be highlighted: (1) all stars are made mostly of hydrogen; (2) every element has a unique "chemical fingerprint," or distinct set of spectral lines. We can ask a question related to both of these points: Where did all of the elements in the universe come from?
Following the Big Bang, the only atomic elements that existed in the early universe were hydrogen, helium, and a small amount of lithium. All other elements in the periodic table were formed later through nucleosynthesis and the mergers of neutron stars. Since we need those other elements to form planets and life, we review and summarize the processes that form these elements.
Nucleosynthesis
Nucleosynthesis is the process of building up heavy elements from lighter elements through fusion. In the Sun and other stars, the most common atom is hydrogen. It is possible for hydrogen nuclei (protons) to overcome the strong electrostatic repulsive forces because of the enormous temperature and pressure in the core of a star and fuse into heavier nuclei. The energy output of the Sun is 3.8 x 1026 W or 3.8 x 1026 J/s (one watt is equal to 1 joule of energy every second). This energy comes from the fusion of hydrogen into helium in the core of the Sun.
Theories of nucleosynthesis inside stars are able to predict the relative abundances with which the elements occur in nature. The way stars build up elements during various nuclear reactions really can explain why some elements (oxygen, carbon, and iron) are common and others are quite rare (gold, silver, and uranium).
Want to know more: Hydrogen Fusion
The exact pathway for nucleosynthesis is very temperature-dependent. In a star like the Sun (or less massive than the Sun), the process is proton-proton (or p-p) fusion and follows the steps outlined in the animation below.
In addition to making helium, the p-p chain produces the energy that supports the Sun against collapse. One reaction cycle in the p-p chain produces 25 MeV of energy (eV are a very tiny unit of energy... 25 MeV is just 4×10-12 joules of energy). In the second step of the p-p chain, a proton is transformed into a neutron. How does that happen?
In the first step of p-p nucleosynthesis, a small fraction of hydrogen transforms into deuterium (an isotope of hydrogen with a neutron added to the nucleus, written as 2H). This is the rate-limiting step in the p-p chain because the transformation of a proton into a neutron is statistically improbable. Once deuterium is created, the rest of the p-p pathway proceeds relatively quickly.
As hydrogen fusion occurs in the Sun, most of the mass of the hydrogen is converted into an "ash" of helium. However, there is a slight difference of 0.71% between the mass of 4 protons and the mass of a helium nucleus; this fraction of the original mass is converted into energy and the mass loss rate from the Sun, [latex]\Delta m[/latex], can be calculated with Einstein's famous equation:
[latex]E = \Delta m c^2[/latex]
where c is the speed of light. We can solve this equation for [latex]\Delta m[/latex] and find how mass is converted into energy every second in the Sun:
$$\Delta m = \frac{E}{c^2}$$
[latex]\Delta m[/latex] = (3.8×1026 J)/(3×108 m/s)2 = 4×10⁹ kg = 4 billion kg
Think about that... every second, 4 billion kg (or 4.4 million tons) of the mass of our Sun vanishes -- it is transformed into energy that is radiated away. However, this represents only 0.71% of the mass of hydrogen that is converted into helium. How much hydrogen is being burned in the sun every second?
[latex]m_{H}[/latex] = (4×10⁹ kg)/(0.0071) = 5.63×10¹¹ kg = 563 billion kg $\sim$ 600 million tons
To produce the Sun’s luminosity of 4 × 1026 watts, some 600 million tons of hydrogen must be converted into helium each second, of which about 4 million tons are converted from matter into energy. As large as these numbers are, the store of hydrogen (and thus of nuclear energy) in the Sun is still more enormous, and can last a long time—billions of years, in fact.
Stars that are more massive than the Sun have more gravitational pressure in their cores and hotter temperatures. Massive stars that have trace amounts of carbon, nitrogen, and oxygen (CNO) can take a more efficient path for synthesizing helium, using CNO as catalysts to form helium nuclei . The energy yield is higher and therefore more efficient: 26.72 MeV per helium nucleus instead of 25 MeV per helium nucleus with the p-p pathway.
Manufacturing heavier elements
So, if hydrogen fusion is forming helium, how does that get us to carbon, oxygen, nitrogen, phosphorus, sulfur.... all the good stuff that we need for life? Stars on the main sequence (dwarfs) burn only hydrogen in their cores. Elements with atomic masses greater than helium can be formed only after the star leaves the main sequence. After most of the hydrogen in the core has been fused to helium, hydrogen fusion slows down. This is a problem for the star because H-fusion was supporting the star against gravitational collapse. As the rate of H-fusion declines, gravity begins to win, and the core of the star collapses. This causes the pressure and temperature to increase. When the pressure and temperature are high enough, helium fusion in the core is initiated. During this gravitational collapse, the pressure and temperature of hydrogen gas in a shell surrounding the core "reignites" and begins forming helium.
Next, the helium nucleus (a.k.a. an alpha particle) fuses into carbon and oxygen. For low mass stars (masses less than about 3 solar masses) this is the end of nuclear fusion reactions. Low mass stars do not form most of the elements that we need for life. For this, we need high mass stars.
Massive stars are rare with relatively short lifetimes (millions rather than billions of years). But, massive stars do all of the heavy lifting when it comes to manufacturing high atomic mass elements. Like their lower mass counterparts, massive stars burn hydrogen on the main sequence. But when hydrogen fusion ends, there is a rapid succession of fusion and collapse events. When the core depletes the element it is burning in the core, gravity squeezes the star, and the next stage of core nuclear fusion along with shell burning of lighter elements begins. Close to the end of its life, the massive star has developed a stratified, onion skin structure with the heaviest elements in the core and surrounding shells of successively lighter elements, as shown in Figure 11 below. However, that fusion stops when iron is formed in the core. For elements with lower atomic mass than iron, fusion reactions are exothermic - they give off energy and support the star against gravity. Iron fusion is endothermic - energy is used in this reaction. In other words, iron is not capable of fusing to a heavier element.
The next move belongs to gravity. Once the core collapse begins, the onion shells in the core mix, and the density increases. The outer layers of the star fall in, hit the high density core, and bounce off in a fierce supernova event that blows out about half of the material in the star. During the supernova, the shock waves generate high enough pressures to produce the heaviest elements in the periodic table. The final distribution of elements has some interesting structure. The addition of alpha particles favors production of even-numbered atomic mass elements and leaves behind an even-odd pattern in the logarithmic elemental abundances. There is an obvious iron peak in the elemental abundances with higher-mass elements being increasingly rare.
Key Concepts and Summary
The peak intensity of a star coupled with its spectrum reveals its temperature and the chemical composition. Stellar spectra have been organized into a temperature sequence: OBAFGKM, from the hottest to the coolest stars. Stars like the Sun burn hydrogen in their cores for about 8-9 billion years - our middle aged Sun is halfway through this process. Once the hydrogen in the core has been fused, the star begins to evolve through a giant phase, fusing successively higher atomic mass elements to produce the elements in the Periodic Table. Stars end their life as a white dwarf, neutron star, or black hole, depending on the mass of the star.
Review Questions
Summary Questions
- What does the spectral type of a star depend on? Why isn't the sequence of spectral types alphabetical?
- How does the lifetime of a star depend on its mass?
- Explain how thermonuclear fusion in the core of a star creates energy. Which element is being fused when a star is on the main sequence?
- Describe the five main luminosity classes for stars. What luminosity class is the Sun? Betelgeuse?
- What is displayed on a H-R diagram? How does an H-R diagram help us understand the properties and evolution of stars?
- How do the spectral type and luminosity class of a star differ from each other?
- How were the elements on the periodic table created? Explain a few of the different processes and how elements were created (nucleosynthesis).
Activities
- H-R Diagram simulator. Open the H-R Diagram simulator above (or you can open it in a separate window at https://astro.unl.edu/classaction/animations/stellarprops/hrexplorer.html).
- Click on "show luminosity classes"; next, plot the nearest stars and then plot the brightest stars. Why do the nearest stars and brightest stars fall into different regions on the H-R diagram?
- Look up the temperature and luminosity for the star Vega (be sure that the temperature is in K and that the luminosity is reported relative to the Sun) and enter them in the boxes in the "Cursor Properties" box on the left. How do the size (radius) and color of Vega compare with the Sun?
Stars can be classified by their spectra, and we can use these classes to understand how much energy different types of stars emit, helping us to determine if a planet around another star could have the right conditions for life.
Learning Objectives
By the end of this chapter, you will be able to:
- Describe the sequence of spectral types for stars and how they are ordered
- Describe the main stages of life for a low-mass or a high-mass star.
- Explain why the H-R diagram is useful for understanding the properties of different stars.
- Describe the processes that created all of the elements on the periodic table.
Spectral Types for Stars
In 1814 Joseph Fraunhofer studied the spectrum of the Sun and cataloged the dark lines superposed on a continuous spectrum. A decade later, Gustav Kirchhoff and Robert Bunsen (famous for the Bunsen burner) realized that the dark lines in the spectrum were caused by absorption of light in the atmosphere of the Sun. When other stars were observed, they sometimes had different intensities or completely different absorption lines. The absorption lines in spectra provided a quantitative tool for classifying stars.
Want to Know More: The Harvard "Computers"
In 1890, the Directory of the Harvard College Observatory, Edward Pickering, needed a workforce to analyze and catalog the extensive photographic data that had been collected. He employed dozens of women "computers" as his assistants. He believed that these women (unappealingly referred to as "Pickering's Harem") were ideal for the job because they did excellent work and they could be paid half the salary of men. Henrietta Swan Leavitt, who classified Cepheid variable stars, and Annie Jump Cannon were two of Pickering's women computers.
Annie Jump Cannon was nearly deaf throughout her career. She was a suffragist and a member of the National Women's Party. In 1935, she created the Annie J. Cannon Prize for "the woman of any country, whose contributions to the science of astronomy are the most distinguished.
The Director of the Harvard Observatory, Edward Pickering, obtained spectra for 10,000 stars. He and his staff grouped the spectra according to the strength of hydrogen lines with letters from A through Q. Director Pickering enlisted the help of Annie Jump Cannon, one of his "women computers." Cannon and Antonia Maury found a more natural ordering that merged the stellar types into the smooth continuous sequence shown in the spectral sequence below in Figure 6. But it was not clear what this classification meant - what physical processes were driving the differences in the spectra?
Annie Jump Cannon expanded the catalog to include more than a million stars, and she developed a new system for spectral classification with seven main groups: O, B, A, F, G, K, M and three classes of peculiar stars. The original classification of stars was in alphabetical form, but it was later realized that the letters needed to be rearranged to sort them by temperature to have a measurable parameter. Each spectral type is further subdivided from 0 to 9 (increasing numbers moving toward the next cooler spectral type). Stars of type O are the hottest and type M stars are the coolest. Our Sun is a G2 star. The Sun is cooler than a G1 star and hotter than a G3 star.
The spectral type sequence OBAFGM is a temperature sequence. The mnemonic "Oh Be A Fine Girl Kiss Me" is an outdated but still useful way to remember the order of the sequence. The Stefan-Boltzmann law shows that the luminosity of a star is related to its temperature and radius. What determines the luminosity of a star after it is born? The answer is its mass. We'll go into this more deeply in the Star Formation section, but we note here that everything about a star's life is determined by the mass of the cloud of gas and dust that it forms from. A massive O or B star races through its fuel and has a short life, while a low mass M star can take trillions of years to use up all of its fuel and die.
For any type of star, the main source of energy comes from the fusion of hydrogen into helium. All stars are made mostly of hydrogen so there is a lot of it to start with -- how much depends on the mass of the star. All stars spend the vast majority of their life in this hydrogen-burning phase. Stars in the hydrogen-burning phase are called main sequence stars.
The lifetime of a main sequence star depends on two factors: how much hydrogen exists and the rate of hydrogen fusion. For massive O-type stars, there is 100 times more hydrogen fuel than for stars like the Sun. However, the rate of fusion is so high that the O-type stars burn through this fuel in a million years. In comparison, stars like the Sun will burn hydrogen for about 10 billion years. And the lowest mass M stars will burn hydrogen for more than 100 billion years (since the galaxy is only 13.8 billion years old, there are no M stars that have depleted all of their hydrogen yet). Table 1 shows the different properties of a star in its hydrogen-burning phase.
Looking at Table 1 we can note some immediate trends: High mass stars are hotter, more luminous and have a larger radius than low mass stars. Hot stars have a blue color while cooler stars are orange or red.
Concept Check: stellar luminosity
The Sun is a G star.
(a) About how many times more luminous is the Sun as compared to an M star?
(b) Does an O star have a smaller or larger radius than the Sun? By how many times?
Show Answer
(a) 30 (b) the O star's radius is 15 times larger
The location of the spectral lines in a star's spectrum can also be used to determine the line-of-sight motion of the star -- its radial velocity -- through the Doppler effect. We explore this concept more deeply when learning about detecting exoplanets.
Stellar Evolution
Our world has risen from the ashes of massive stars. Those massive stars are rare: they make up just 0.1% of all stars. The synthesis of heavy elements occurs during the final 10% of the lifetime of these stars. Except for hydrogen, the atoms in our bodies were all formed by nucleosynthesis in stars. Without those stars, or specifically without the death of those stars, we would not have the material needed to build planets and needed for prebiotic and biological chemistry.
It bears repeating that the the mass of the star is what drives the rate of fusion reactions and therefore the evolution of a star. The definition of "high mass" is generally taken to be around eight times the mass of the Sun. Low-mass stars are much more common, as seen in Table 1. These lower mass stars take the upper path in Figure 7 below and end their lives as compact white dwarfs. Higher mass stars follow the lower path in Figure 7 and end their lives as exotic neutron stars or black holes.
Pressure vs. Gravity
As we discuss the different stages of a star's life, it helps to keep in mind that from the moment a star is born, there is a competition between gravity and pressure. Gravity tends to make the star collapse in on itself, while thermal pressure tends to push the star apart. When the two are balanced, we say a star is in hydrostatic equilibrium.
A main sequence star is in hydrostatic equilibrium. Throughout their lives, stars use stabilizing feedback loops to keep pressure and gravity balanced. However, as we will see, for the most massive stars gravity will eventually win and create a black hole.
Stellar evolution of low mass stars
Red giants
Roughly 99.9% of the stars are AFGKM spectral type stars. These stars fuse hydrogen in their cores on the main sequence and then evolve into red giants when the hydrogen is depleted. When hydrogen runs out, the core collapses and heats up. The red giant stars puff off about half of their mass (hydrogen enriched with helium, and trace metals like carbon, nitrogen, and oxygen), polluting the interstellar medium like an industrial chimney stack. Pressure takes over as a star becomes a red giant and this causes its radius to swell up to 100 times its size as a main sequence star. The star also becomes more luminous at this stage, as additional heating causes fusion to continue more quickly in a shell around the core.
As the outer envelope of the red giant (confusingly called a planetary nebula because astronomers were originally uncertain about these objects) mixes with the interstellar medium, the core of the remnant red giant collapses. If the core mass is less than 1.4 solar masses, it becomes a white dwarf. This is the ultimate fate of our Sun.
White dwarfs
A white dwarf is about the size of the Earth, and it is an incredibly dense object - one teaspoon of white dwarf material weighs several tons. Nuclear fusion is no longer taking place in a white dwarf (except for a short period of hydrogen fusion on the surface). Here, electron degeneracy pressure supports the white dwarf against gravity. This supporting pressure arises from the quantum mechanical nature of electrons. As is the case with atoms, identical electrons are forbidden from occupying the same energy levels and so are forced into higher energy levels that give atoms and white dwarfs their increasing sizes as the number of electrons increase. As long as the mass of the remnant white dwarf is less than about 1.4 times the mass of the Sun, electron degeneracy can support it against further collapse.
Stellar evolution of high mass stars
Red supergiants
As fragments of a cold molecular cloud begin to contract and form stars, hundreds to thousands of stars are born; however, only about 0.1% of the newborn stars will have enough mass to become O or B type stars. These massive stars contract quickly and carry out hydrogen fusion at a furious pace for 1 or 2 million years. At that point they have burned through their endowment of hydrogen. The core collapses until helium fusion begins and the outer shell expands, forming a red supergiant star. There are several cycles of fuel depletion, contraction, and re-ignition as the core of the red supergiant develops an onion layer structure, with stratified shell burning of different elements. Once the core contains iron, the star collapses again, but iron fusion does not produce energy and cannot support the star against gravitational collapse. Therefore, iron is the end of the line for elements formed via fusion; heavier elements are created during the supernova explosion. After the star explodes as a supernova, the core of the star now hits a fork in the road:
- if the core mass is between 1.4 and 3 times the mass of the Sun, then the star becomes a neutron star
- if the core is greater than 3 times the mass of the Sun, then the star becomes a black hole.
Betelgeuse: ready to explode?
Betelgeuse is a red supergiant star that is 12 - 20 times the mass of the Sun with a radius that is almost 900 times the radius of the Sun. Betelgeuse would sweep out almost to Jupiter if it were the center of our solar system. The star can be seen in the Orion constellation - at the shoulder of the famed hunter. Betelgeuse has been in the news lately, because astronomers noticed that this red supergiant started dimming in October 2019 and think that it may explode as a supernova soon. We have a ring-side seat to watch the evolution of this star, but it is impossible to know if we will see this happen next week, or over the next several thousand years. Because Betelgeuse is 640 light years away, it is possible that the star has already gone supernova and we just haven't gotten the memo yet.
https://youtu.be/FosDJOVaKFc?feature=shared
Credit: Space.com / produced & edited by Steve Spaleta
Neutron stars
Pulsars
As the remnant core collapses into a neutron star, it spins up, conserving angular momentum. In other words, as its radius gets smaller, it spins faster (just like an ice skater spins faster when they pull their arms in). Neutron stars, when they first form, can rotate hundreds of times per second with a narrow beam of electromagnetic radiation that spins with the star like a lighthouse. If the Earth happens to reside in the path of this beam of light, we see the neutron star as a rapidly blinking source - a pulsar. Pulsars were theoretically predicted going back to the 1930s. In 1968, Jocelyn Bell observed radio emission pulses that confirmed the existence of neutron stars.
As an interesting historical side note to Bell's discovery of pulsars, when the first pulsar was detected, the source of its regular pulses was unclear. The original name for the first pulsar was LGM-1, where LGM stands for little green men. This was considered to be a possible sign of contact from an extraterrestrial civilization.
Pulsars are of additional interest to the search for life in the universe as the first exoplanet detected in 1992 was found orbiting a pulsar. If this seems surprising, given that a pulsar is what's left after a star explodes as a supernova, it is speculated that the exoplanets may have formed after the explosion.
Black Holes
Electron degeneracy can support a stellar core (or white dwarf) against collapse if the total mass is less than 1.4 Msun. Neutron degeneracy can support a core against collapse if the remnant stellar core is between 1.4 and 2-3 Msun. If the mass of the remnant stellar core is greater than about 3 time the mass of the Sun, there is nothing that can stop the collapse, and a black hole is formed. Nothing escapes the black hole -- not even light -- so it is very difficult to find these stellar ghosts. But there are about a dozen candidate black holes in binary star systems where the second star is still visible. We can measure the orbit of the visible star and deduce the presence of a massive, but invisible star, and in some cases we can see gas being funneled off the visible star and heated up to tens of millions of degrees as it spirals onto an accretion disk around something that cannot be seen. If it walks like a duck and it quacks like a duck....
Neutron Star Mergers and Gravitational Waves
There is another possible fate for the most massive stars that are part of binary systems. Once they become either neutron stars or black holes, these objects will spiral in towards each other and eventually merge, releasing an enormous amount of energy in the form of gravitational waves. The first gravitational waves from such a cataclysmic event were detected in 2015 with the LIGO instruments. This process is believed to be the source of production for many elements.
H-R Diagram
The different stages in the life of a star are nicely summarized in Figure 7 above. But we have learned an immense amount about the properties of a star -- its temperature, luminosity, and radius -- and how they vary throughout a star's life. These properties can be seen dynamically in a figure that shows the luminosity of a star plotted against its temperature. This type of diagram is called the Hertzsprung-Russell (H-R) diagram, in honor of the two astronomers who discovered it around 1910.
Figure 10 shows an H-R diagram. Since the temperature of a star is directly related to its spectral type, the x-axis can show either of these variables. The y-axis shows the luminosity compared to the Sun (notice that the Sun has luminosity of 1 on this scale). The majority of the stars shown fall along the main sequence, which runs from the upper left to the lower right. The main sequence is the phase of a star's life when it is burning hydrogen into helium.
You can further explore the H-R diagram using the simulation below.
To start, click on "show luminosity class" and plot the nearest stars and the brightest stars. Click on different parts on the H-R diagram (the default, shown by a red X, is the Sun). How does the size of the star change as you move to different luminosity classes?
Assembling the Periodic Table
In discussing spectroscopy and stars, a couple of facts can be highlighted: (1) all stars are made mostly of hydrogen; (2) every element has a unique "chemical fingerprint," or distinct set of spectral lines. We can ask a question related to both of these points: Where did all of the elements in the universe come from?
Following the Big Bang, the only atomic elements that existed in the early universe were hydrogen, helium, and a small amount of lithium. All other elements in the periodic table were formed later through nucleosynthesis and the mergers of neutron stars. Since we need those other elements to form planets and life, we review and summarize the processes that form these elements.
Nucleosynthesis
Nucleosynthesis is the process of building up heavy elements from lighter elements through fusion. In the Sun and other stars, the most common atom is hydrogen. It is possible for hydrogen nuclei (protons) to overcome the strong electrostatic repulsive forces because of the enormous temperature and pressure in the core of a star and fuse into heavier nuclei. The energy output of the Sun is 3.8 x 1026 W or 3.8 x 1026 J/s (one watt is equal to 1 joule of energy every second). This energy comes from the fusion of hydrogen into helium in the core of the Sun.
Theories of nucleosynthesis inside stars are able to predict the relative abundances with which the elements occur in nature. The way stars build up elements during various nuclear reactions really can explain why some elements (oxygen, carbon, and iron) are common and others are quite rare (gold, silver, and uranium).
Want to know more: Hydrogen Fusion
The exact pathway for nucleosynthesis is very temperature-dependent. In a star like the Sun (or less massive than the Sun), the process is proton-proton (or p-p) fusion and follows the steps outlined in the animation below.
In addition to making helium, the p-p chain produces the energy that supports the Sun against collapse. One reaction cycle in the p-p chain produces 25 MeV of energy (eV are a very tiny unit of energy... 25 MeV is just 4×10-12 joules of energy). In the second step of the p-p chain, a proton is transformed into a neutron. How does that happen?
In the first step of p-p nucleosynthesis, a small fraction of hydrogen transforms into deuterium (an isotope of hydrogen with a neutron added to the nucleus, written as 2H). This is the rate-limiting step in the p-p chain because the transformation of a proton into a neutron is statistically improbable. Once deuterium is created, the rest of the p-p pathway proceeds relatively quickly.
As hydrogen fusion occurs in the Sun, most of the mass of the hydrogen is converted into an "ash" of helium. However, there is a slight difference of 0.71% between the mass of 4 protons and the mass of a helium nucleus; this fraction of the original mass is converted into energy and the mass loss rate from the Sun, [latex]\Delta m[/latex], can be calculated with Einstein's famous equation:
[latex]E = \Delta m c^2[/latex]
where c is the speed of light. We can solve this equation for [latex]\Delta m[/latex] and find how mass is converted into energy every second in the Sun:
$$\Delta m = \frac{E}{c^2}$$
[latex]\Delta m[/latex] = (3.8×1026 J)/(3×108 m/s)2 = 4×10⁹ kg = 4 billion kg
Think about that... every second, 4 billion kg (or 4.4 million tons) of the mass of our Sun vanishes -- it is transformed into energy that is radiated away. However, this represents only 0.71% of the mass of hydrogen that is converted into helium. How much hydrogen is being burned in the sun every second?
[latex]m_{H}[/latex] = (4×10⁹ kg)/(0.0071) = 5.63×10¹¹ kg = 563 billion kg $\sim$ 600 million tons
To produce the Sun’s luminosity of 4 × 1026 watts, some 600 million tons of hydrogen must be converted into helium each second, of which about 4 million tons are converted from matter into energy. As large as these numbers are, the store of hydrogen (and thus of nuclear energy) in the Sun is still more enormous, and can last a long time—billions of years, in fact.
Stars that are more massive than the Sun have more gravitational pressure in their cores and hotter temperatures. Massive stars that have trace amounts of carbon, nitrogen, and oxygen (CNO) can take a more efficient path for synthesizing helium, using CNO as catalysts to form helium nuclei . The energy yield is higher and therefore more efficient: 26.72 MeV per helium nucleus instead of 25 MeV per helium nucleus with the p-p pathway.
Manufacturing heavier elements
So, if hydrogen fusion is forming helium, how does that get us to carbon, oxygen, nitrogen, phosphorus, sulfur.... all the good stuff that we need for life? Stars on the main sequence (dwarfs) burn only hydrogen in their cores. Elements with atomic masses greater than helium can be formed only after the star leaves the main sequence. After most of the hydrogen in the core has been fused to helium, hydrogen fusion slows down. This is a problem for the star because H-fusion was supporting the star against gravitational collapse. As the rate of H-fusion declines, gravity begins to win, and the core of the star collapses. This causes the pressure and temperature to increase. When the pressure and temperature are high enough, helium fusion in the core is initiated. During this gravitational collapse, the pressure and temperature of hydrogen gas in a shell surrounding the core "reignites" and begins forming helium.
Next, the helium nucleus (a.k.a. an alpha particle) fuses into carbon and oxygen. For low mass stars (masses less than about 3 solar masses) this is the end of nuclear fusion reactions. Low mass stars do not form most of the elements that we need for life. For this, we need high mass stars.
Massive stars are rare with relatively short lifetimes (millions rather than billions of years). But, massive stars do all of the heavy lifting when it comes to manufacturing high atomic mass elements. Like their lower mass counterparts, massive stars burn hydrogen on the main sequence. But when hydrogen fusion ends, there is a rapid succession of fusion and collapse events. When the core depletes the element it is burning in the core, gravity squeezes the star, and the next stage of core nuclear fusion along with shell burning of lighter elements begins. Close to the end of its life, the massive star has developed a stratified, onion skin structure with the heaviest elements in the core and surrounding shells of successively lighter elements, as shown in Figure 11 below. However, that fusion stops when iron is formed in the core. For elements with lower atomic mass than iron, fusion reactions are exothermic - they give off energy and support the star against gravity. Iron fusion is endothermic - energy is used in this reaction. In other words, iron is not capable of fusing to a heavier element.
The next move belongs to gravity. Once the core collapse begins, the onion shells in the core mix, and the density increases. The outer layers of the star fall in, hit the high density core, and bounce off in a fierce supernova event that blows out about half of the material in the star. During the supernova, the shock waves generate high enough pressures to produce the heaviest elements in the periodic table. The final distribution of elements has some interesting structure. The addition of alpha particles favors production of even-numbered atomic mass elements and leaves behind an even-odd pattern in the logarithmic elemental abundances. There is an obvious iron peak in the elemental abundances with higher-mass elements being increasingly rare.
Key Concepts and Summary
The peak intensity of a star coupled with its spectrum reveals its temperature and the chemical composition. Stellar spectra have been organized into a temperature sequence: OBAFGKM, from the hottest to the coolest stars. Stars like the Sun burn hydrogen in their cores for about 8-9 billion years - our middle aged Sun is halfway through this process. Once the hydrogen in the core has been fused, the star begins to evolve through a giant phase, fusing successively higher atomic mass elements to produce the elements in the Periodic Table. Stars end their life as a white dwarf, neutron star, or black hole, depending on the mass of the star.
Review Questions
Summary Questions
- What does the spectral type of a star depend on? Why isn't the sequence of spectral types alphabetical?
- How does the lifetime of a star depend on its mass?
- Explain how thermonuclear fusion in the core of a star creates energy. Which element is being fused when a star is on the main sequence?
- Describe the five main luminosity classes for stars. What luminosity class is the Sun? Betelgeuse?
- What is displayed on a H-R diagram? How does an H-R diagram help us understand the properties and evolution of stars?
- How do the spectral type and luminosity class of a star differ from each other?
- How were the elements on the periodic table created? Explain a few of the different processes and how elements were created (nucleosynthesis).
Activities
- H-R Diagram simulator. Open the H-R Diagram simulator above (or you can open it in a separate window at https://astro.unl.edu/classaction/animations/stellarprops/hrexplorer.html).
- Click on "show luminosity classes"; next, plot the nearest stars and then plot the brightest stars. Why do the nearest stars and brightest stars fall into different regions on the H-R diagram?
- Look up the temperature and luminosity for the star Vega (be sure that the temperature is in K and that the luminosity is reported relative to the Sun) and enter them in the boxes in the "Cursor Properties" box on the left. How do the size (radius) and color of Vega compare with the Sun?
