Chapter 19 Section 19.3: Variable Stars: One Key to Cosmic Distances
19.3 Variable Stars: One Key to Cosmic Distances
Learning Objectives
By the end of this section, you will be able to:
- Describe how some stars vary their light output and why such stars are important
- Explain the importance of pulsating variable stars, such as cepheids and RR Lyrae-type stars, to our study of the universe
Let’s briefly review the key reasons that measuring distances to the stars is such a struggle. As discussed in The Brightness of Stars, our problem is that stars come in a bewildering variety of intrinsic luminosities. (If stars were light bulbs, we’d say they come in a wide range of wattages.) Suppose, instead, that all stars had the same “wattage” or luminosity. In that case, the more distant ones would always look dimmer, and we could tell how far away a star is simply by how dim it appeared. In the real universe, however, when we look at a star in our sky (with eye or telescope) and measure its apparent brightness, we cannot know whether it looks dim because it’s a low-wattage bulb or because it is far away, or perhaps some of each.
Astronomers need to discover something else about the star that allows us to “read off” its intrinsic luminosity—in effect, to know what the star’s true wattage is. With this information, we can then attribute how dim it looks from Earth to its distance. Recall that the apparent brightness of an object decreases with the square of the distance to that object. If two objects have the same luminosity but one is three times farther than the other, the more distant one will look nine times fainter. Therefore, if we know the luminosity of a star and its apparent brightness, we can calculate how far away it is. Astronomers have long searched for techniques that would somehow allow us to determine the luminosity of a star—and it is to these techniques that we turn next.
Variable Stars
The breakthrough in measuring distances to remote parts of our Galaxy, and to other galaxies as well, came from the study of variable stars. Most stars are constant in their luminosity, at least to within a percent or two. Like the Sun, they generate a steady flow of energy from their interiors. However, some stars are seen to vary in brightness and, for this reason, are called variable stars. Many such stars vary on a regular cycle, like the flashing bulbs that decorate stores and homes during the winter holidays.
Let’s define some tools to help us keep track of how a star varies. A graph that shows how the brightness of a variable star changes with time is called a light curve (Figure 1). The maximum is the point of the light curve where the star has its greatest brightness; the minimum is the point where it is faintest. If the light variations repeat themselves periodically, the interval between the two maxima is called the period of the star. (If this kind of graph looks familiar, it is because we introduced it in Diameters of Stars.)
Cepheid Light Curve.
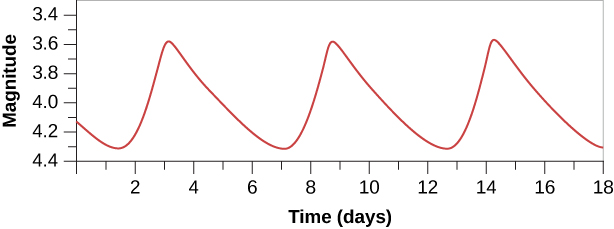
Figure 1. This light curve shows how the brightness changes with time for a typical cepheid variable, with a period of about 6 days.
Pulsating Variables
There are two special types of variable stars for which—as we will see—measurements of the light curve give us accurate distances. These are called cepheid and RR Lyrae variables, both of which are pulsating variable stars. Such a star actually changes its diameter with time—periodically expanding and contracting, as your chest does when you breathe. We now understand that these stars are going through a brief unstable stage late in their lives.
The expansion and contraction of pulsating variables can be measured by using the Doppler effect. The lines in the spectrum shift toward the blue as the surface of the star moves toward us and then shift to the red as the surface shrinks back. As the star pulsates, it also changes its overall color, indicating that its temperature is also varying. And, most important for our purposes, the luminosity of the pulsating variable also changes in a regular way as it expands and contracts.
Cepheid Variables
Cepheids are large, yellow, pulsating stars named for the first-known star of the group, Delta Cephei. This, by the way, is another example of how confusing naming conventions get in astronomy; here, a whole class of stars is named after the constellation in which the first one happened to be found. (We textbook authors can only apologize to our students for the whole mess!)
The variability of Delta Cephei was discovered in 1784 by the young English astronomer John Goodricke (see John Goodricke). The star rises rather rapidly to maximum light and then falls more slowly to minimum light, taking a total of 5.4 days for one cycle. The curve in Figure 1 represents a simplified version of the light curve of Delta Cephei.
Several hundred cepheid variables are known in our Galaxy. Most cepheids have periods in the range of 3 to 50 days and luminosities that are about 1000 to 10,000 times greater than that of the Sun. Their variations in luminosity range from a few percent to a factor of 10.
Polaris, the North Star, is a cepheid variable that, for a long time, varied by one tenth of a magnitude, or by about 10% in visual luminosity, in a period of just under 4 days. Recent measurements indicate that the amount by which the brightness of Polaris changes is decreasing and that, sometime in the future, this star will no longer be a pulsating variable. This is just one more piece of evidence that stars really do evolve and change in fundamental ways as they age, and that being a cepheid variable represents a stage in the life of the star.
The Period-Luminosity Relation
The importance of cepheid variables lies in the fact that their periods and average luminosities turn out to be directly related. The longer the period (the longer the star takes to vary), the greater the luminosity. This period-luminosity relation was a remarkable discovery, one for which astronomers still (pardon the expression) thank their lucky stars. The period of such a star is easy to measure: a good telescope and a good clock are all you need. Once you have the period, the relationship (which can be put into precise mathematical terms) will give you the luminosity of the star.
Let’s be clear on what that means. The relation allows you to essentially “read off” how bright the star really is (how much energy it puts out). Astronomers can then compare this intrinsic brightness with the apparent brightness of the star. As we saw, the difference between the two allows them to calculate the distance.
The relation between period and luminosity was discovered in 1908 by Henrietta Leavitt (Figure 2), a staff member at the Harvard College Observatory (and one of a number of women working for low wages assisting Edward Pickering, the observatory’s director; see Annie Cannon: Classifier of the Stars). Leavitt discovered hundreds of variable stars in the Large Magellanic Cloud and Small Magellanic Cloud, two great star systems that are actually neighboring galaxies (although they were not known to be galaxies then). A small fraction of these variables were cepheids (Figure 3).
Henrietta Swan Leavitt (1868–1921).

Figure 2. Leavitt worked as an astronomer at the Harvard College Observatory. While studying photographs of the Magellanic Clouds, she found over 1700 variable stars, including 20 cepheids. Since all the cepheids in these systems were at roughly the same distance, she was able to compare their luminosities and periods of variation. She thus discovered a fundamental relationship between these characteristics that led to a new and much better way of estimating cosmic distances. (credit: modification of work by AIP)
These systems presented a wonderful opportunity to study the behavior of variable stars independent of their distance. For all practical purposes, the Magellanic Clouds are so far away that astronomers can assume that all the stars in them are at roughly the same distance from us. (In the same way, all the suburbs of Los Angeles are roughly the same distance from New York City. Of course, if you are in Los Angeles, you will notice annoying distances between the suburbs, but compared to how far away New York City is, the differences seem small.) If all the variable stars in the Magellanic Clouds are at roughly the same distance, then any difference in their apparent brightnesses must be caused by differences in their intrinsic luminosities.
Large Magellanic Cloud.
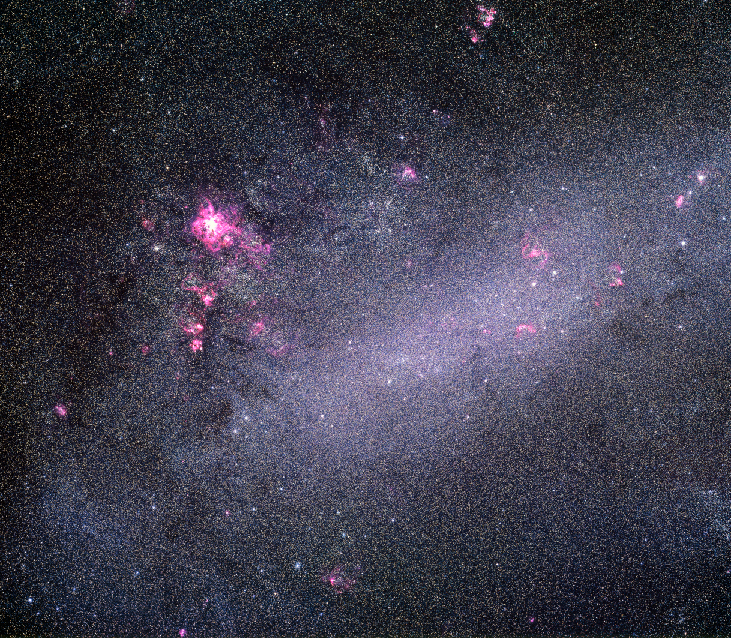
Figure 3. The Large Magellanic Cloud (so named because Magellan’s crew were the first Europeans to record it) is a small, irregularly shaped galaxy near our own Milky Way. It was in this galaxy that Henrietta Leavitt discovered the cepheid period-luminosity relation. (credit: ESO)
Leavitt found that the brighter-appearing cepheids always have the longer periods of light variation. Thus, she reasoned, the period must be related to the luminosity of the stars. When Leavitt did this work, the distance to the Magellanic Clouds was not known, so she was only able to show that luminosity was related to period. She could not determine exactly what the relationship is.
To define the period-luminosity relation with actual numbers (to calibrate it), astronomers first had to measure the actual distances to a few nearby cepheids in another way. (This was accomplished by finding cepheids associated in clusters with other stars whose distances could be estimated from their spectra, as discussed in the next section of this chapter.) But once the relation was thus defined, it could give us the distance to any cepheid, wherever it might be located (Figure 4).
How to Use a Cepheid to Measure Distance.
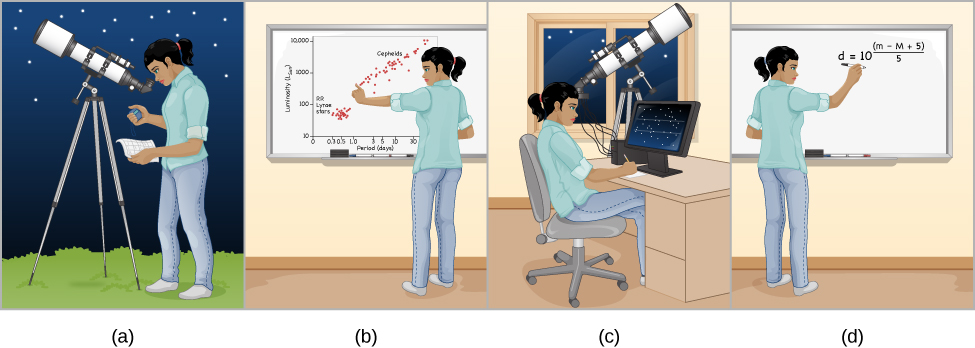
Figure 4. (a) Find a cepheid variable star and measure its period. (b) Use the period-luminosity relation to calculate the star’s luminosity. (c) Measure the star’s apparent brightness. (d) Compare the luminosity with the apparent brightness to calculate the distance.
Here at last was the technique astronomers had been searching for to break the confines of distance that parallax imposed on them. Cepheids can be observed and monitored, it turns out, in many parts of our own Galaxy and in other nearby galaxies as well. Astronomers, including Ejnar Hertzsprung and Harvard’s Harlow Shapley, immediately saw the potential of the new technique; they and many others set to work exploring more distant reaches of space using cepheids as signposts. In the 1920s, Edwin Hubble made one of the most significant astronomical discoveries of all time using cepheids, when he observed them in nearby galaxies and discovered the expansion of the universe. As we will see, this work still continues, as the Hubble Space Telescope and other modern instruments try to identify and measure individual cepheids in galaxies farther and farther away. The most distant known variable stars are all cepheids, with some about 60 million light-years away.
JOHN GOODRICKE
The brief life of John Goodricke (Figure 5) is a testament to the human spirit under adversity. Born deaf and unable to speak, Goodricke nevertheless made a number of pioneering discoveries in astronomy through patient and careful observations of the heavens.
John Goodricke (1764–1786).
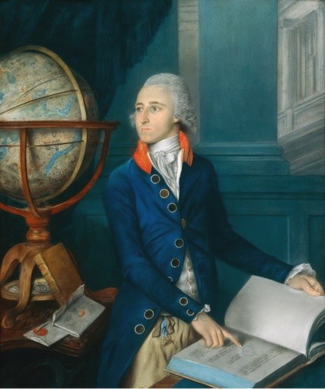 Figure 5. This portrait of Goodricke by artist J. Scouler hangs in the Royal Astronomical Society in London. There is some controversy about whether this is actually what Goodricke looked like or whether the painting was much retouched to please his family. (credit: James Scouler)
Born in Holland, where his father was on a diplomatic mission, Goodricke was sent back to England at age eight to study at a special school for the deaf. He did sufficiently well to enter Warrington Academy, a secondary school that offered no special assistance for students with handicaps. His mathematics teacher there inspired an interest in astronomy, and in 1781, at age 17, Goodricke began observing the sky at his family home in York, England. Within a year, he had discovered the brightness variations of the star Algol (discussed in The Stars: A Celestial Census) and suggested that an unseen companion star was causing the changes, a theory that waited over 100 years for proof. His paper on the subject was read before the Royal Society (the main British group of scientists) in 1783 and won him a medal from that distinguished group.
In the meantime, Goodricke had discovered two other stars that varied regularly, Beta Lyrae and Delta Cephei, both of which continued to interest astronomers for years to come. Goodricke shared his interest in observing with his older cousin, Edward Pigott, who went on to discover other variable stars during his much longer life. But Goodricke’s time was quickly drawing to a close; at age 21, only 2 weeks after he was elected to the Royal Society, he caught a cold while making astronomical observations and never recovered.
Today, the University of York has a building named Goodricke Hall and a plaque that honors his contributions to science. Yet if you go to the churchyard cemetery where he is buried, an overgrown tombstone has only the initials “J. G.” to show where he lies. Astronomer Zdenek Kopal, who looked carefully into Goodricke’s life, speculated on why the marker is so modest: perhaps the rather staid Goodricke relatives were ashamed of having a “deaf-mute” in the family and could not sufficiently appreciate how much a man who could not hear could nevertheless see.
RR Lyrae Stars
A related group of stars, whose nature was understood somewhat later than that of the cepheids, are called RR Lyrae variables, named for the star RR Lyrae, the best-known member of the group. More common than the cepheids, but less luminous, thousands of these pulsating variables are known in our Galaxy. The periods of RR Lyrae stars are always less than 1 day, and their changes in brightness are typically less than about a factor of two.
Astronomers have observed that the RR Lyrae stars occurring in any particular cluster all have about the same apparent brightness. Since stars in a cluster are all at approximately the same distance, it follows that RR Lyrae variables must all have nearly the same intrinsic luminosity, which turns out to be about 50 LSun. In this sense, RR Lyrae stars are a little bit like standard light bulbs and can also be used to obtain distances, particularly within our Galaxy. Figure 6 displays the ranges of periods and luminosities for both the cepheids and the RR Lyrae stars.
Period-Luminosity Relation for Cepheid Variables.
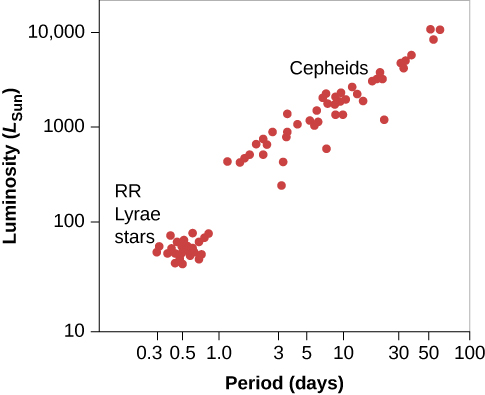
Figure 6. In this class of variable stars, the time the star takes to go through a cycle of luminosity changes is related to the average luminosity of the star. Also shown are the period and luminosity for RR Lyrae stars.
Key Concepts and Summary
Cepheids and RR Lyrae stars are two types of pulsating variable stars. Light curves of these stars show that their luminosities vary with a regularly repeating period. RR Lyrae stars can be used as standard bulbs, and cepheid variables obey a period-luminosity relation, so measuring their periods can tell us their luminosities. Then, we can calculate their distances by comparing their luminosities with their apparent brightnesses, and this can allow us to measure distances to these stars out to over 60 million light-years.
Glossary
- cepheid
- a star that belongs to a class of yellow supergiant pulsating stars; these stars vary periodically in brightness, and the relationship between their periods and luminosities is useful in deriving distances to them
- light curve
- a graph that displays the time variation of the light from a variable or eclipsing binary star or, more generally, from any other object whose radiation output changes with time
- period-luminosity relation
- an empirical relation between the periods and luminosities of certain variable stars
- pulsating variable star
- a variable star that pulsates in size and luminosity
- RR Lyrae
- one of a class of giant pulsating stars with periods shorter than 1 day, useful for finding distances

